Temperature-induced deactivation mechanism of ZnFe2O4 for oxidative dehydrogenation of 1-butene
Xiaoyi
Li
a,
Dang-guo
Cheng
*a,
Zhi-Jian
Zhao
b,
Fengqiu
Chen
a and
Jinlong
Gong
 *b
*b
aKey Laboratory of Biomass Chemical Engineering of Ministry of Education, College of Chemical and Biological Engineering, Zhejiang University, Hangzhou 310027, China. E-mail: dgcheng@zju.edu.cn
bKey Laboratory for Green Chemical Technology of Ministry of Education, School of Chemical Engineering & Technology, Collaborative Innovation Center for Chemical Science & Engineering, Tianjin University, Tianjin 30072, China. E-mail: jlgong@tju.edu.cn
First published on 4th January 2017
Abstract
This paper describes the observation of an irregular decrease in 1-butene conversion during oxidative dehydrogenation over ZnFe2O4 in the production of 1,3-butadiene upon increasing the reaction temperature above 400 °C. Mono and multi-pulse adsorption and reoxidation were developed to determine the reaction mechanism that led to this phenomenon. Adsorbed species were found to be generated by 1-butene adsorption, which blocked the active sites, and with higher reaction temperatures, the surface reconstruction of the catalyst could lead to catalyst deactivation. Temperature-programmed oxidation revealed the correlation between different adsorbed species and the corresponding altered active sites. A temperature-induced surface reconstruction mechanism to explain the possible deactivation was then proposed and confirmed with X-ray photoelectron spectroscopy. The original spinel surface structure of the catalyst was transformed into cubic cells formed by Zn2+ and Fe2+ after the initiation of adsorption at high temperatures, which resulted in its final deactivation.
Introduction
Oxidative dehydrogenation (ODH) has been considered as a promising strategy in the production of alkenes from alkanes, and the products include ethylene,1 propene,2,3 butene,4 and styrene.5,6 Specifically, in the production of 1,3-butadiene (BD), ODH has great advantages in addition to naphtha cracking.7–9 Being both cost-efficient and environmentally friendly, ferrite catalysts have attracted much attention with respect to their possible application in this process since the 1970s. Those with a spinel structure were investigated extensively for their superior catalytic performance in the ODH reaction.10,11A reaction mechanism proposed by R. J. Rennard12 and F. E. Massoth13 has triggered a series of studies targeting its mass transfer process and reaction route. The adsorption mechanism of cis-2-butene was carefully studied over three types of ferrite catalysts at temperatures from 210 to 350 °C.14 Compared with Fe2O3, an improved catalytic performance was obtained over ZnFe2O4 due to the inclusion of Zn2+ in the spinel structure. This insertion of Zn2+ created cation vacancy sites15 and basic lattice oxygen species for the adsorption of butene.
In the case of active species, three types of active sites with different functions were illustrated, including selective oxidative dehydrogenation, combustion, and isomerization.16 A theory was then proposed based on the “semi-hydrogenation” of butene on the surface of ZnFe2O4.17 The resultant adsorbed species on the active sites proved difficult to remove. To the best of our knowledge, there is no direct correlation between the production of such adsorbed species and the corresponding active site.
In addition, the ODH of butene follows the Mars–van Krevelen mechanism, which involves a transition state where the reduced catalyst surface is exposed to the reactants.18,19 A previous study has shown that an increased temperature could potentially trigger a transformation of the catalyst crystal structure.18 Such changes occurred only when the metal ions in the spinel crystal changed their valence state. The existence of the changed structure indicated that recombination of these reduced metal ions occurred in the framework of the crystal.20 Recent results from our group demonstrated a correlation between the changed crystal structure and improved oxygen mobility in the ODH reactions.21–24 The combination of these results indicated a possible surface crystal reconstruction of the catalyst as it was calculated that the major reaction took place on the surface of the catalyst.15 Concerning the crystal structure of ZnFe2O4, the addition of Zn ions into the corundum structure created cation vacancies, which resulted in a higher reactivity in the spinel catalyst, while creating a crystal structure with a stronger temperature dependence.15 This temperature dependence might account for the possible partial deactivation of the catalyst at high reaction temperatures.
This paper describes the observation of an irregular decrease in 1-butene conversion in its ODH over ZnFe2O4 at temperatures above 400 °C. To explain this phenomenon, monopulse adsorption and reoxidation at constant temperature was developed to investigate the adsorption and reaction over an catalyst surface that was not adsorbed to saturation. To further illustrate the fully deactivated status of the catalyst, multi-pulse adsorption and reoxidation at constant temperature was conducted over the catalyst. The results of the above tests were combined with those for temperature-programmed oxidation (TPO) at different temperatures to reveal the correlation between the active sites and the varied proportions of side reactions. Characterization was carried out on model crystal forms of ZnFe2O4 as a comparative analysis to reveal the exact crystal forms attributed to the corresponding products. The surface crystal reconstruction of the catalyst was confirmed by X-ray photoelectron spectroscopy (XPS). A reliable mechanism for the irregular conversion was then proposed and confirmed by XPS analysis with depth-profiling technology.
Experimental
Preparation of ZnFe2O4
The ZnFe2O4 catalyst was prepared by a modified water-free method.25 Specifically, 2.16 g Zn(CH3COO)2·2H2O and 8.08 g Fe(NO3)3·9H2O were mixed and dissolved in 200 mL ethylene glycol monomethyl ether (EGMME) after stirring for a while. Ethanolamine (MEA, 0.62 g) was then added as the complexing agent, and the total solution was stirred for four hours at room temperature. The resultant solution was then heated at 300 °C for 2 h in a muffle furnace to remove the solvent, and a further calcination was conducted directly at 650 °C for another 6 h to yield the crystallized ZnFe2O4. The model composite, ZnFe2O3, was prepared by co-precipitation of the metal salt solutions and crystallized via further calcination at 650 °C for 6 h under N2. Fe2O3 and ZnO were prepared by calcination of Fe(NO3)3·9H2O and Zn(CH3COO)2·2H2O at 650 °C for 6 h in air. FeO was prepared by direct calcination of FeC2O4·2H2O at 650 °C for 6 h under N2.ODH of 1-butene
The ODH of 1-butene was conducted in a fixed-bed reactor. Prior to the catalytic reaction, the catalyst bed was pretreated at 470 °C for 1 h with air and steam. The catalytic reaction was conducted at 375 °C. The feed composition was fixed at butene![[thin space (1/6-em)]](https://www.rsc.org/images/entities/char_2009.gif) :
:![[thin space (1/6-em)]](https://www.rsc.org/images/entities/char_2009.gif) oxygen
oxygen![[thin space (1/6-em)]](https://www.rsc.org/images/entities/char_2009.gif) :
:![[thin space (1/6-em)]](https://www.rsc.org/images/entities/char_2009.gif) steam = 1
steam = 1![[thin space (1/6-em)]](https://www.rsc.org/images/entities/char_2009.gif) :
:![[thin space (1/6-em)]](https://www.rsc.org/images/entities/char_2009.gif) 0.82
0.82![[thin space (1/6-em)]](https://www.rsc.org/images/entities/char_2009.gif) :
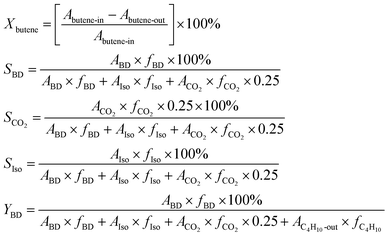
:![[thin space (1/6-em)]](https://www.rsc.org/images/entities/char_2009.gif) 10.4. The GHSV (gas hourly space velocity) was fixed at 438 h−1 on the basis of butene. Reaction products were periodically sampled, analysed with gas chromatography (Qiyang GC9860), and determined using the following calculation on the basis of carbon balance. Xbutene is the conversion of 1-butene, SBD, SIso, and SCO2 are the selectivities of 1,3-butadiene, butene isomers, and carbon dioxide, and YBD is the yield of 1,3-butadiene. A and f are the peak area and correction factor, respectively, of each substance:
10.4. The GHSV (gas hourly space velocity) was fixed at 438 h−1 on the basis of butene. Reaction products were periodically sampled, analysed with gas chromatography (Qiyang GC9860), and determined using the following calculation on the basis of carbon balance. Xbutene is the conversion of 1-butene, SBD, SIso, and SCO2 are the selectivities of 1,3-butadiene, butene isomers, and carbon dioxide, and YBD is the yield of 1,3-butadiene. A and f are the peak area and correction factor, respectively, of each substance:Mono & multi-pulse adsorption and reoxidation
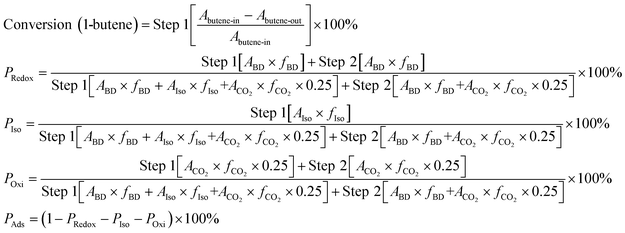
Initially, the saturated adsorption capacity of ZnFe2O4 was determined so as to reveal the exact amount of 1-butene in both mono and multi-pulse adsorption and reoxidation experiments. A chemisorption instrument (Micromeritics, ASAP 2920) was used in this analysis. Mixed gas (10 mL min−1) containing 2% O2 and 98% He was introduced into a U-tube containing 1.0 g ZnFe2O4. The catalyst bed was then heated to 470 °C at 20 °C min−1 and kept at this temperature for 1 hour as the pretreatment. The catalyst was then cooled to 425 °C at 20 °C min−1, and 1-butene was introduced via pulse injection at 0.5 mL per pulse every 200 s. Mass spectroscopy (Hiden QIC-20) was applied here to measure the pulse intensity. The experiment was stopped as soon as the peak area of the mass spectra reached a constant value. The saturated adsorption capacity, Csat, was calculated based on the following calculation:Mono & multi-pulse adsorption and reoxidation was also conducted on a Micromeritics ASAP 2920 instrument. For the monopulse experiment, after the same pretreatment process, a single pulse of 0.5 mL 1-butene was injected into a U-tube containing 1.0 g ZnFe2O4 at 325 °C, 350 °C, 375 °C, 400 °C, and 425 °C, namely, step 1. After each pulse, 10 mL min−1 mixed gas containing 2% O2 and 98% He was introduced and purged for 10 min, namely, step 2. The conversion of 1-butene and the reaction products of both steps were then collected and analyzed by gas chromatography (Qiyang GC9860). The conversion, reaction proportions, and net adsorption were then calculated as follows. PRedox, PIso, POxi, and PAds are the proportions of the redox reaction, isomerization reaction, oxidation reaction, and net adsorption, respectively. A and f are the peak area and correction factor, respectively, of each substance:
Temperature-programmed oxidation
The 1-butene was adsorbed to saturation on 1.0 g ZnFe2O4 at 325 °C, 350 °C, 375 °C, 400 °C, and 425 °C using a chemisorption instrument (Micromeritics, ASAP 2920). After purging at the same temperature with He for 5 min, temperature-programmed oxidation (TPO) proceeded at 5 °C min−1. Mass spectroscopy (Hiden QIC-20) was adopted here to measure the CO2 intensity. The ionization voltage was 70 eV, the source emission current was 200 μA, and the scanning frequency was set at 5 s. With the aim of determining the exact activation temperature of the active sites and their possible corresponding crystal structure, the same process was also conducted on possible crystal forms of ZnFe2O4 in the reaction process, including Fe2O3, ZnFe2O3, ZnO, and FeO.X-ray photoelectron spectroscopy (XPS) analysis
XPS analysis was adopted here to investigate the possible surface crystal structure changes using a VG ESCALAB MARK II at 10−10 Torr with an Al-Kα source (1486.6 eV). The binding energies were calibrated with carbon (C 1s at 285.0 eV). For all measurements, the step width of each energy channel was set at 0.1 eV. Basic measurements were conducted to investigate the valence changes and thus the composition changes of the elements on the catalyst surface after the saturated adsorption of 1-butene at 400 °C. It should be noted that XPS depth profiling was considered reliable for not only surface cleansing33,34 but also for revealing the different elemental compositions of multi-composite structures.35–37 Thus, it was also adopted here to discern the valence changes from the surface to the bulk phase of the catalyst crystal.The XPS depth profiling process was conducted by applying Ar-ion sputtering with a set of standard parameters. Specifically, an acceleration voltage of 5 kV was chosen to provide a reasonable sputter rate. Sputtering was started with an initial sputtering duration of 5 minutes. This was then was continued for another 5 minutes followed by another 10 minutes at the end. With the Ar-ion sputtering parameters provided, a sputter rate of approximately 1 nm min−1 can be reached on a Si standard. To obtain a reasonable ratio of the area of the sputter crater to avoid edge effects, the raster area for the crater was set to 5 × 5 mm2.
High-resolution scans of the C 1s, O 1s, Fe 2p, Fe 3p, and Zn 2p peaks were then acquired. A detailed correlation of the groups or valencies with their binding energy is provided in Table 1. It should be noted that Fe 3p was adopted here for a more precise comparison between the different valencies of Fe instead of the regular Fe 2p.28 The overlapped peaks of Fe 2p made this precise calculation difficult in some cases. Nevertheless, it was still adopted here for comparison between the proportions of iron and zinc, since such comparisons could only be achieved by Fe 2p analysis.27
Results and discussion
1-Butene ODH over ZnFe2O4
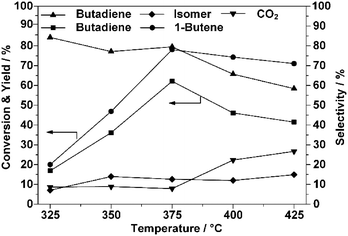
As stated, the conversion of 1-butene exhibited an irregular decrease when the reaction temperature was increased above 375 °C, as shown in Fig. 1. Following the laws of thermodynamics, a higher reaction temperature usually implies a higher conversion of the reactant and, specifically, this principle was usually applied to obtain a better yield of BD.38,39 Additionally, the CO2 selectivity increased with the reaction temperature, while that of BD decreased, which confirmed that the oxidation reaction was favored at higher temperatures.39–41 From Fig. 1, it can be concluded that under the current reaction conditions, the optimal temperature for the ODH process on ZnFe2O4 is 375 °C.1-Butene pulse reaction characterization
To explain the above irregular variation in the conversion of 1-butene, characterization of the pulse reaction was conducted to determine the possible correlation between the adsorption behavior and the catalytic performance. Most existing studies investigated this possible correlation with adsorption experiments, in which the adsorption of butene was conducted at room temperature.12,14,42 However, the increased temperature could enhance the adsorption process and possibly provide more energy to the active sites, which ultimately changed the reaction results.43–45Generally, the saturated adsorption capacity increases with the adsorption temperature for chemical adsorption. Thus, the highest reaction temperature, 425 °C, was chosen here to measure the saturated capacity. As shown in Fig. 2, the peak area of butene reached its balance point after the fourth pulse, indicating saturation of the adsorption surface. Hence, in the following investigations on the alteration of the surface adsorption behavior at increasing reaction temperatures, five pulses of 1-butene were adopted.
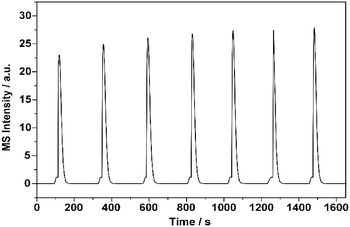 | ||
| Fig. 2 Saturated adsorption capacity experiment with 1-butene over ZnFe2O4 catalyst. The volume of each 1-butene pulse was set at 0.5 mL, and the interval between every pulse was set at 200 s. | ||
Fig. 3 presents the results of the monopulse adsorption and reaction. There were several parallel reactions taking place on the surface of ZnFe2O4 in the reaction. Clearly, the ODH of 1-butene is the prime reaction in the system. However, the increasing temperature has resulted in a drastically decreasing yield of BD, which explicitly indicates strengthened side-reactions.
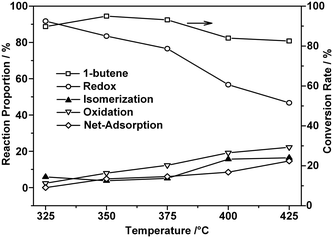 | ||
| Fig. 3 Reaction proportion and 1-butene conversion of monopulse adsorption and reoxidation reaction at different temperatures. The volume of each 1-butene pulse was set at 0.5 mL. | ||
With the monopulse analysis, there was an obvious increase in the net adsorption. Previous studies have indicated that this adsorbed species could possibly result in a decrease in this limited surface area of the catalyst, leading to mass transfer difficulties.17,45,46 Additionally, this resultant adsorbed species could block the active sites of the catalyst, which inhibits the reoxidation process of this reaction by blocking oxygen from the reduced sites. Nevertheless, without the saturated adsorption of butene, only some of the surface active sites were involved in the monopulse experiment. Saturated adsorption was then employed to better illustrate the exact mechanism.
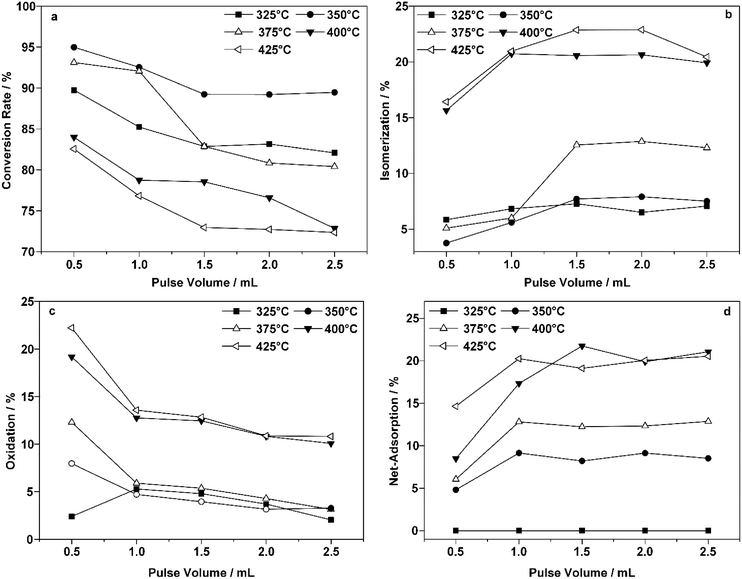
Fig. 4 presents the changes in the conversion of 1-butene and the reaction proportions with each pulse of 1-butene at five different temperatures. An obvious decrease in the 1-butene conversion was observed as the reaction temperature increased (Fig. 4a). The conversion usually reached equilibrium after three pulses at a constant temperature, which indicated saturated adsorption on the surface of the ZnFe2O4 catalyst. As the temperature increased, the conversion dropped slightly after an initial increase. The decreased conversion indicated that catalyst deactivation occurred at a higher temperature.
On the other hand, the isomerization reaction increased with the reaction temperature (Fig. 4b). This was also confirmed in previous studies.15,47,48 As the temperature increased from 375 °C to over 400 °C, the proportion of the isomerization reaction increased significantly from 13% to 21%, which contributed to the ever decreasing yield of BD. However, this increase also ceased after three pulses, which indicated that another issue caused the declining conversion.
Fig. 4c presents the oxidation products collected after each consecutive pulse. A clear decrease was observed here, as the oxidation process removed a certain percentage of the adsorbed species. However, after three pulses, oxidation at the same temperature could no longer completely remove these species, and the proportion remaining increased drastically as the temperature increased above 400 °C.
A significantly enhanced chemisorption effect was observed as the reaction temperature increased, as shown in Fig. 4d. Unlike the species represented in Fig. 4c, these products could not be oxidized at the same temperature. As is indicated by the numbers in Fig. 4d, the results of the calculation revealed that scarcely any adsorbed species remained at 325 °C. This could be due to either reduced adsorption or complete oxidation under such conditions. The net adsorption proportion reached over 17% at temperatures above 400 °C. Some of the adsorbed species that accumulated could not be removed by the oxidation process at the same temperature.
Thus, it could be concluded that adsorbed species were generated on the surface of the catalyst, which could be removed even when the oxidation process was conducted at the same temperature. Such a process could be enhanced dramatically as the temperature increased above 400 °C. Moreover, the vital lattice oxygen refilling process within the redox mechanism was also blocked, hindering not only the reoxidation process but also the mass transfer within the reaction environment.
Temperature-programmed oxidation
To provide a better explanation for the correlation between the active sites and the adsorbed species produced by adsorption of 1-butene at higher temperatures, temperature-programmed oxidation (TPO) was conducted for 1-butene adsorbed to saturation on ZnFe2O4. It is reasonable to presume that determination of the peak temperature in TPO characterization of the oxidization products (CO2) would reveal the correlation between the adsorbed species and the corresponding active sites at different reaction temperatures.45,49,50Meanwhile, to better understand the crystal forms that potentially contributed to the corresponding active sites on the catalyst surface, the above characterization was also performed on each possible crystal structure that might be formed during the ODH process. A temperature of 400 °C was chosen here as stronger adsorption would occur under such conditions.
Fig. 5 exhibits the results of the TPO experiments. As shown in Fig. 5a, adsorption at 325 °C resulted in only one peak at around 600 °C. Increasing the adsorption temperature above 350 °C resulted in the appearance of a peak at 500 °C. When the temperature was increased above 400 °C, another peak appeared at 400 °C. All three peaks indicated possible active sites on the surface of the ZnFe2O4 catalyst. As the adsorption temperature increased, these were successively activated. Based on work on the adsorption behaviors of ferrite oxide,16,17 there were three possible species of active sites. These are: (1) combustion sites for the production of CO2, (2) selective oxidation sites for ODH in the production of BD, and (3) isomerization sites for the production of isomers with double bond migration. Active sites (1) and (2) were shown to be activated at 325 °C.17 When the temperature was raised to 375 °C, the main peak of CO2 was observed at around 500 °C. A corresponding phenomenon was an improvement in the overall conversion of 1-butene and the yield of BD. This indicated that the active-site species for this production is the (2) selective oxidation site. When the temperature was elevated above 400 °C, especially at 425 °C, all three active sites were completely activated. A corresponding phenomenon was a sudden increase in the proportion of the net adsorption in the multi-pulse adsorption experiment.
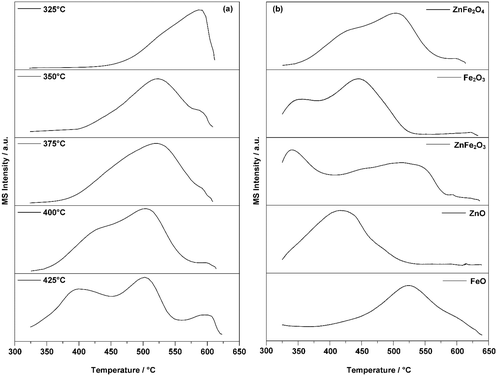 | ||
| Fig. 5 (a) TPO results for 1-butene adsorbed on ZnFe2O4 catalyst at different temperatures; (b) TPO results for 1-butene adsorbed on ZnFe2O4 and its relevant crystal forms at 400 °C. | ||
As the temperature increased, 1-butene participated in the adsorption and the reaction increased. However, the net adsorption and other side reactions represented a large proportion of this. The activation of all the active-site species could possibly contribute to the generation of both effects, finally leading to a lower proportion of the redox reaction.
Fig. 5b demonstrates the TPO results for the possible crystal structures formed during the reaction. The structures of these crystals would confirm the exact active sites for the generated products by revealing the correlating peak temperature of CO2. This characterization was conducted at 400 °C as all active-site species were activated at this temperature. Additionally, no pretreatment conditions were applied to the possible crystal forms as it was certain that several of these would be oxidized. The TPO results shown in Fig. 5a indicated that the peak of CO2 around 500 °C correlated with the active-site species for the selective oxidation. Thus, it is logical to presume that the same active-site species on the possible crystal forms would exhibit the same CO2 peak temperature.
Comparing the peak temperatures of these crystal forms in Fig. 5b, ZnFe2O3 (ZnO + 2FeO), Fe2O3, and FeO shared similar temperature peaks with ZnFe2O4 around 500 °C. Thus, it is reasonable to believe that the active sites of the ferrite catalyst for the ODH of butene were a combination of both Fe3+ and Fe2+. In the ODH process at a high reaction temperature, Zn2+ was shown to suppress over-oxidation by reducing the content of Fe3+ and Fe2+ on the surface of the catalyst and providing more oxygen vacancies for better oxygen mobility, which specifically targeted the ODH process.14,51,52 The CO2 peak of ZnO also indicated that the possible active site generated by the combination of Zn2+ and Fe3+ for selective oxidation might be activated with a lower reaction temperature than ferrite oxide alone. The active-site species for the isomerization were other Fe3+ ions with less lattice oxygen. According to previous research,12 as all the active sites on the surface of the catalyst were activated at this temperature, the activated 1-butene would then form π-alkenyl groups on all active site species. At high reaction temperatures, it was shown in the multi-pulse reaction that such enhancement could lead to the rapid formation of adsorbed species. In conclusion, as the adsorption reaction temperature increased above 400 °C, the active-site species for effective ODH were generally considered to be a combination of both Fe3+ and Fe2+ ions; the isomers and CO2 were generally produced by the Fe3+, which was not fully activated due to insufficient lattice oxygen.
X-ray photoelectron spectroscopy (XPS) analysis of catalyst surface pretreated with 1-butene adsorption
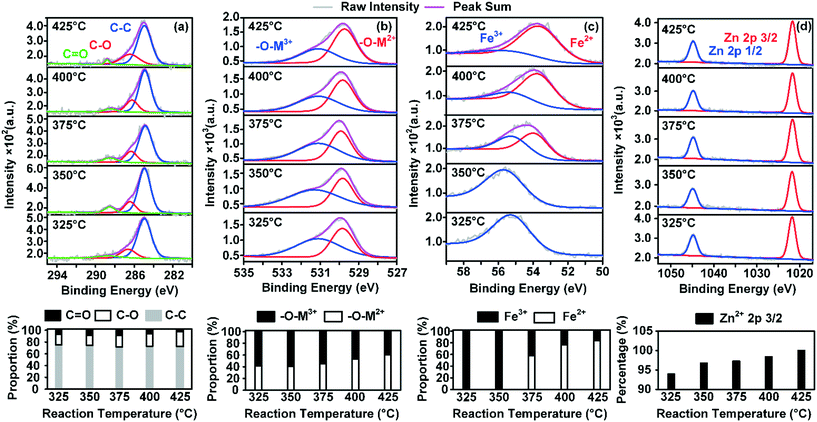
To better understand the nature of the adsorbed species and its effect on possible changes in the surface structure of ZnFe2O4, X-ray photoelectron spectroscopy (XPS) analysis was conducted at five different temperatures. C 1s, O 1s, Fe 3p, and Zn 2p were adopted here to demonstrate the changes in the element valences. On each sample, 1-butene was adsorbed to saturation at given temperatures.The results of the XPS analysis are depicted in Fig. 6. The C 1s spectrum revealed that the proportion of C![[double bond, length as m-dash]](https://www.rsc.org/images/entities/char_e001.gif) O groups decreased gradually as the temperature increased. However, there was an increase in C–O, and the proportion of the carbon main peak was relatively stable. It has been shown that an increase in –C–O indicates the formation of the intermediate structure O–C–O on the surface of the catalyst,17 which could represent the direct transformation of the mentioned adsorbed species.
O groups decreased gradually as the temperature increased. However, there was an increase in C–O, and the proportion of the carbon main peak was relatively stable. It has been shown that an increase in –C–O indicates the formation of the intermediate structure O–C–O on the surface of the catalyst,17 which could represent the direct transformation of the mentioned adsorbed species.
The above phenomena all revealed the fact that increasing the temperature enhanced the formation of adsorbed species. Fe2+, which required a continuous feed of lattice oxygen from the internal lattice, was also produced. Meanwhile, in the actual ODH reactions, the rising temperature provided the required activation energy for combustion sites, which enhanced the direct combustion process.14
The combined effects could largely consume the oxygen in the reaction atmosphere in order to remove this adsorbed species and leave less oxygen for lattice oxygen replenishment. This potential inhibition phenomenon was the initial cause of further partial deactivation of the catalyst at high temperatures. Besides, neither the fully oxidized nor the fully reduced zinc ferrite structures were considered to be ideal for ODH reactions,17 whereas partially reduced structures were favored in this reaction. Hence, this also explained the partial deactivation at temperatures higher than 400 °C, where a drastic decrease in Fe3+ was observed in the surface structure of the catalyst. Additionally, the spectra of O 1s and Fe 3p both proved that there was accelerated consumption of Fe3+ on the surface of the catalyst. As the temperature was raised above 375 °C, Fe2+ took up 58% of the iron content of the surface of the catalyst. The lattice oxygen that correlated with divalent metal ions also increased from 45% to 53%. Meanwhile, a gradual increase in Zn2+ on the surface of ZnFe2O4 was observed, as Zn2+ inhibited over-oxidation of 1-butene at high temperatures.12,18 However, the existing Zn2+ and the reduced Fe2+ could form a new crystal phase in the near surface of the catalyst crystal, resulting in a probable rearrangement of the surface crystal structure. As the temperature reached 425 °C, 83% of the iron content on the surface of the catalyst was Fe2+. It is reasonable to presume that the crystal phase near the surface of the catalyst was completely different from that in the bulk. And this rearranged surface crystal structure was believed to lead to fewer active oxygen species for the production of BD and also contribute to the formation of adsorbed species on the active sites of the catalyst.
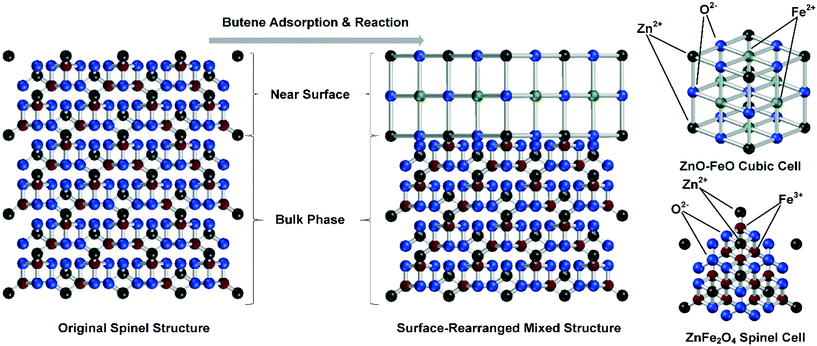
With a changed valency, the original surface crystal structure cannot be maintained. Here, we propose a mechanism based on the crystal structure changes in the near surface of the catalyst. In this mechanism, a new crystal structure was formed by Fe2+ and Zn2+ over the surface of the catalyst, which differed from the crystal phase in the bulk phase of the catalyst. This difference would inhibit the lattice oxygen movement between these two phases, decreasing the number of crystal defects essential for reoxidation and potentially leading to deactivation of the active sites on the catalyst surface. The crystal structure changes resulted from the elevated temperature in the 1-butene ODH reaction and led to further catalyst deactivation with the formation of adsorbed species, as shown in Fig. 7.
After the 1-butene adsorption and reaction, a large percentage of Fe3+ ions in the catalyst surface was reduced to Fe2+, which formed a new crystal phase with the existing Zn2+. The spinel structure on the surface of the catalyst could be changed into a cubic structure formed by a mixed crystal phase of ZnO and FeO. In the crystal structure of the spinel phase, Zn2+ was tetracoordinated and took up the vacancies formed by closely packed O2− tetrahedra, while Fe3+ was octacoordinated and took up the vacancies formed by closely packed O2− octahedra.14,16,53,54 In the cubic structure, both Fe2+ and Zn2+ were hexacoordinated. Comparing these two crystal phases, the number of active sites differed considerably, and the cubic structure left fewer oxygen species for the reoxidation process, which led to further catalyst deactivation at high temperatures.
The previous XPS analysis provided a basic analysis of the surface composition of the catalyst after the surface reaction with 1-butene. However, this speculation is still in need of further verification. Hence we adopted XPS depth profiling with Ar-ion sputtering to obtain a detailed insight into the changes in the crystal structure and reveal the differences between the near surface and the bulk phase.
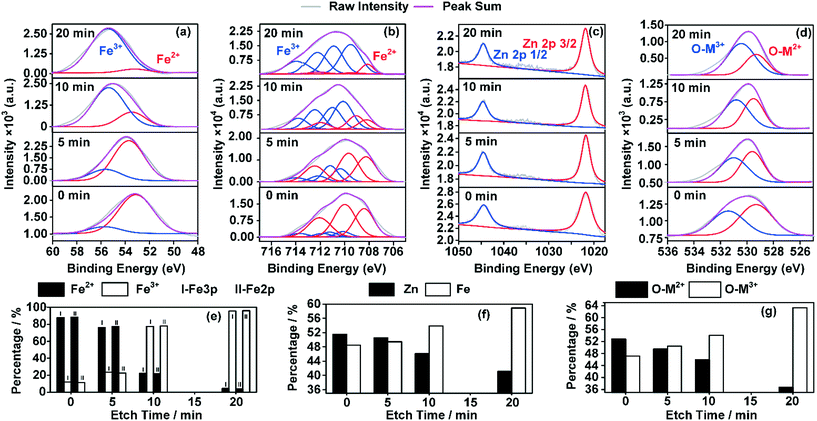
Fig. 8 shows the XPS results indicating the changes in the valence distributions and compositions of the elements of ZnFe2O4, on which 1-butene was adsorbed to saturation at 400 °C. By extending the sputtering time, different valencies of the elements were revealed at different depths of the catalyst crystals from the surface to the bulk. Changes in the valencies of Zn, O, and Fe were calculated based on the area of the coordinating peaks. Fe 2p was adopted here for comparison with Zn 2p to determine the total amount of Fe and Zn. This also provided additional data for Fe 3p for comparison between the amounts of Fe2+ and Fe3+.
As shown in Fig. 8(e), from the surface to the bulk, the proportion of Fe3+ increased while that of Fe2+ decreased. A drastic decrease was witnessed in the proportion of Fe2+ from over 88% at the surface to less than 5% in the bulk phase. This change indicated a different crystal composition and the probability of a completely different crystal structure compared with the bulk phase. In addition, as shown in Fig. 8(f), the total amount of Zn decreased, while that of Fe increased. This indicates a different crystal structure, which was formed in the near surface of the catalyst crystal, while the bulk phase remained almost unchanged. Moreover, changes in the O 1s graph (Fig. 8(g)) of the oxygen species that bonded with metal ions of different valencies also confirmed this theory.
In a word, a changed crystal structure was observed in the near surface of the ZnFe2O4 crystal, which was probably reconstructed from Zn2+ and Fe2+. This could be completely different from the bulk phase of the crystal, resulting in a less catalytically active crystal surface.10,17,55 This changed crystal structure could possibly enhance not only the adsorption but also the isomerization process in this system,15 which could finally lead to partial deactivation of the catalyst.
Conclusions
Characterization of the pulse reaction of 1-butene confirmed that increasing the temperature would result in the formation of adsorbed species on the surface of the catalyst. The adsorbed species cannot be removed by the subsequent oxidation process at the same temperature. The TPO results revealed a correlation between the three types of active sites and their activation temperature. Among these, only the selective oxidation site (2) was crucial for ODH of 1-butene. By comparing the TPO results for ZnFe2O4 with its relevant crystal forms, it was shown that the surface crystal structure was changed into one with a high proportion of Fe2+ and Zn2+, which replaced the original spinel structure. This change further reduced the number of active sites, which lowered the catalytic activity. XPS analysis demonstrated that the changed surface was covered with adsorbed species and that the proportion of Fe2+ increased while that of Fe3+ decreased drastically. Based on this observation, a possible theory for the changes in the surface of the crystal was proposed and confirmed by XPS depth profiling. The proportions of Fe2+, Fe3+, and Zn2+ changed from the surface to the bulk phase of the crystal, which indicated a dramatic change in the composition of the structure. These results confirmed the changes in the valencies and, indirectly, the changes in the crystal structures. The formation of adsorbed species on the active sites and temperature-induced surface crystal reconstruction contributed together to reducing the amount of lattice oxygen over the surface of the catalyst and weakening the oxygen mobility between the lattices, which finally caused catalyst deactivation.Acknowledgements
The support from the National Key Research and Development Program of China (2016YFA0202900), the National Natural Science Foundation of China (21622606, 21525626), Zhejiang Provincial Natural Science Foundation (LZ13B060004), and the Program for Zhejiang Leading Team of S&T Innovation (2013TD07) is greatly appreciated. The authors are also grateful to the Program of Introducing Talents of Disciplines to China Universities (No. B06006).Notes and references
- S. Wang, K. Murata, T. Hayakawa, S. Hamakawa and K. Suzuki, Appl. Catal., A, 2000, 196, 1–8 CrossRef CAS.
- G. Liu, L. Zeng, Z. J. Zhao, H. Tian, T. Wu and J. L. Gong, ACS Catal., 2016, 6, 2158–2162 CrossRef CAS.
- G. Liu, Z. J. Zhao, T. Wu, L. Zeng and J. L. Gong, ACS Catal., 2016, 6, 5207–5214 CrossRef.
- S. K. Masoudian, S. Sadighi, A. Abbasi, F. Salehirad and A. Fazlollahi, Chem. Eng. Technol., 2013, 36, 1593–1598 CrossRef CAS.
- O. Watzenberger, E. Ströfer and A. Anderlohr, Chem. Eng. Technol., 1999, 22, 659–662 CrossRef CAS.
- N. V. Qui, P. Scholz, T. F. Keller, K. Pollok and B. Ondruschka, Chem. Eng. Technol., 2013, 36, 300–306 CrossRef CAS.
- J. C. Liu, X. Chen, S. Zhao, X. Cao and B. X. Shen, Ind. Eng. Chem. Res., 2015, 54, 12664–12670 CrossRef CAS.
- J. C. Liu, B. X. Shen, D. Q. Wang and J. H. Dong, J. Pet. Sci. Eng., 2009, 66, 156–160 CrossRef CAS.
- K. M. V. Geem, I. Dhuyvetter, S. Prokopiev, M. F. Reyniers, D. Viennet and G. B. Marin, Ind. Eng. Chem. Res., 2009, 48, 861–868 CrossRef.
- J. A. Toledo, P. Bosch, M. A. Valenzuela, A. Montoya and N. Nava, J. Mol. Catal. A: Chem., 1997, 125, 53–62 CrossRef CAS.
- W. R. Cares and J. W. Hightower, J. Catal., 1971, 193–203 CrossRef.
- R. J. Rennard and W. L. Kehl, J. Catal., 1971, 21, 282–293 CrossRef CAS.
- F. E. Massoth and D. A. Scarpiello, J. Catal., 1971, 21, 294–302 CrossRef CAS.
- H. H. Kung, M. C. Kung and B. L. Yang, J. Catal., 1981, 69, 506–510 CrossRef CAS.
- H. H. Kung, B. Kundalkar, M. C. Kung and W. H. Cheng, J. Phys. Chem., 1980, 13, 382–388 CrossRef.
- M. C. Kung, W. H. Cheng and H. H. Kung, J. Phys. Chem., 1979, 83, 1737–1744 CrossRef CAS.
- S. K. Shen, L. X. Yan, J. Liu and Y. G. Yin, Cuihua Xuebao, 1987, 8, 113–120 CAS.
- J. A. Toledo, N. Nava, M. Martinez and X. Bokhimi, Appl. Catal., A, 2002, 234, 137–144 CrossRef.
- J. A. Toledo, H. Armendariz and E. Lopez-Salinas, Catal. Lett., 2000, 66, 19–24 CrossRef CAS.
- N. J. Jebarathinam, M. Eswaramoorthy and V. Krishnasamy, Appl. Catal., A, 1996, 145, 57–74 CrossRef CAS.
- C. Wan, D. G. Cheng, F. Q. Chen and X. L. Zhan, RSC Adv., 2015, 5, 42609–42615 RSC.
- C. Wan, D. G. Cheng, F. Q. Chen and X. L. Zhan, Chem. Eng. Sci., 2015, 135, 553–558 CrossRef CAS.
- C. Wan, D. G. Cheng, F. Q. Chen and X. L. Zhan, Catal. Today, 2016, 264, 180–184 CrossRef CAS.
- C. Wan, D. G. Cheng, F. Q. Chen and X. L. Zhan, J. Chem. Technol. Biotechnol., 2016, 91, 353–358 CrossRef CAS.
- G. Li, X. Zhu, W. Song, Z. Yang, J. Dai, Y. Sun and Y. Fu, J. Am. Ceram. Soc., 2011, 94, 2872–2877 CrossRef CAS.
- C. D. Wanger, W. M. Riggs, L. E. Davis, J. F. Moulder and G. E. Muilenberg, Handbook of X-ray Photoelectron Spectroscopy, Perkin-Elmer Corp, Physical Electronics Division, Eden Prairie, Minnesota, USA, 1979 Search PubMed.
- A. P. Grosvenor, B. A. Kobe, M. C. Biesinger and N. S. McIntyre, Surf. Interface Anal., 2004, 36, 1564–1574 CrossRef CAS.
- T. Yamashita and P. Hayes, Appl. Surf. Sci., 2008, 254, 2441–2449 CrossRef CAS.
- D. Q. Yang and E. Sacher, J. Phys. Chem. C, 2009, 113, 6418–6425 CAS.
- L. P. Kazansky, Appl. Surf. Sci., 2010, 257, 1166–1174 CrossRef CAS.
- Z. Xu, S. Gu, S. Huang, K. Tang, J. Ye, S. Zhu, M. Xu and Y. Zheng, J. Magn. Magn. Mater., 2015, 385, 257–264 CrossRef CAS.
- K. Kotsis and V. Staemmler, Phys. Chem. Chem. Phys., 2006, 8, 1490–1498 RSC.
- Z. Y. Hou, O. Yokota, T. Tanaka and T. Yashima, Appl. Catal., A, 2003, 253, 381–387 CrossRef CAS.
- Z. Y. Hou, O. Yokota, T. Tanaka and T. Yashima, Appl. Surf. Sci., 2004, 233, 58–68 CrossRef CAS.
- K. Koshmak, A. Banshchikov, T. Vergentev, M. Montecchi, D. Céolin, J. P. Rueff, N. S. Sokolov and L. Pasquali, J. Phys. Chem. C, 2014, 118, 10122–10130 CAS.
- R. Steinberger, J. Duchoslav, M. Arndt and D. Stifter, Corros. Sci., 2014, 82, 154–164 CrossRef CAS.
- S. Mukherjee, P. K. Santra and D. D. Sarma, Depth Profiling and Internal Structure Determination of Low Dimensional Materials Using X-ray Photoelectron Spectroscopy, Brookhaven National Laboratory, National Institute of Standards and Technology, Upton, NY, USA, 2016 Search PubMed.
- Y. Chung, Y. Kwon, T. J. Kim, S. J. Lee and S. Oh, Catal. Lett., 2009, 131, 579–586 CrossRef CAS.
- H. Lee, J. C. Jung, H. Kim, Y. Chung, T. J. Kim, S. J. Lee, S. Oh, Y. S. Kim and I. K. Song, Catal. Commun., 2008, 9, 1137–1142 CrossRef CAS.
- H. Lee, J. C. Jung, H. Kim, Y. Chung, T. J. Kim, S. J. Lee, S. Oh, Y. S. Kim and I. K. Song, Catal. Lett., 2008, 122, 281–286 CrossRef CAS.
- Y. Chung, Y. Kwon, T. J. Kim, S. J. Lee and S. Oh, Catal. Lett., 2009, 130, 417–423 CrossRef CAS.
- B. Pandey and D. L. Weathers, Nucl. Instrum. Methods Phys. Res., Sect. B, 2014, 332, 359–363 CrossRef CAS.
- H. H. Kung, Transition Metal Oxides: Surface Chemistry and Catalysis, Elsevier Science Publishers B.V, 1989 Search PubMed.
- J. D. Wang, W. M. Song and Y. G. Yin, Chin. J. Chem. Phys., 1990, 2, 113–119 Search PubMed.
- X. Y. Gu, Y. C. Dai and P. R. Xu, Chem. React. Eng. Technol., 1990, 1, 20–24 Search PubMed.
- W. Y. Zhou, X. C. Chen, Q. Y. Li, C. Y. Liu, S. X. Zhou, J. Z. Xue and J. Z. Lin, Cuihua Xuebao, 1983, 3, 167–176 Search PubMed.
- W. Xu, Y. Yin, G. Li and S. Chen, Appl. Catal., A, 1992, 89, 131–142 CrossRef CAS.
- W. Xu, Y. Yin, S. L. Suib, J. C. Edwards and C. OYoung, J. Phys. Chem., 1995, 99, 9443–9451 CrossRef CAS.
- W. Q. Xu, L. Y. Yang, G. Y. Li, S. Chen and Y. G. Yin, Beijing Fuzhuang Xueyuan Xuebao, 1991, 2, 42–48 Search PubMed.
- H. Lee, J. C. Jung and I. K. Song, Catal. Lett., 2009, 133, 321–327 CrossRef CAS.
- H. Lee, J. C. Jung, H. Kim, Y. Chung, T. J. Kim, S. J. Lee, S. Oh, Y. S. Kim and I. K. Song, Catal. Lett., 2008, 124, 364–368 CrossRef CAS.
- H. Lee, J. C. Jung, H. Kim, Y. Chung, T. J. Kim, S. J. Lee, S. Oh, Y. S. Kim and I. K. Song, Catal. Lett., 2009, 131, 344–349 CrossRef CAS.
- B. L. Yang, F. Hong and H. H. Kung, J. Phys. Chem., 1984, 88, 2531–2534 CrossRef CAS.
- F. Hong, B. L. Yang, L. H. Schwartz and H. H. Kung, J. Phys. Chem., 1984, 88, 2525–2530 CrossRef CAS.
- L. Y. Yang, S. Chen and Y. G. Yin, Beijing Fuzhuang Xueyuan Xuebao, 1992, 1, 20–25 Search PubMed.
| This journal is © The Royal Society of Chemistry 2017 |

