
 Open Access Article
 This Open Access Article is licensed under a
 Creative Commons Attribution 3.0 Unported Licence
Eugenol-modified polysiloxanes as effective anticorrosion additives for epoxy resin coatings
Guang Chena,
Jinghan Fengb,
Wei Qiub and
Yuming Zhao *a
*a
aDepartment of Chemistry, Memorial University, St. John’s, NL, Canada A1B 3X7. E-mail: yuming@mun.ca; Fax: +1 709 864 3728; Tel: +1 709 864 8747
bDepartment of Ocean and Naval Architectural Engineering, Memorial University, St. John’s, NL, Canada A1B 3X5
First published on 12th December 2017
Abstract
A series of polysiloxanes appended with eugenol functionalities has been synthesized through Pt-catalyzed hydrosilylation reactions. These eugenol-modified polysiloxanes were blended with commercial epoxy resins as anticorrosion additives at a low loading percent (2.5 wt%), and the properties of the resulting coatings were investigated by chemical, electrochemical and microscopic characterizations. It was found that the eugenol-modified polysiloxane additives can significantly increase the performance of epoxy resin coatings in terms of thermal stability, hydrophobicity and resistance to water penetration. Our studies demonstrate that eugenol-modified polysiloxanes are a new class of anticorrosion material with potential applications in marine corrosion control and protection.
1 Introduction
Organic coatings provide an effective way to inhibit or slow down unwanted corrosion processes taking place on metal surfaces by forming protective barriers impermeable to corrosive solutions or species.1–3 Epoxy resins are among the most widely used anti-corrosion coatings and adhesives, owing to their high chemical and corrosion resistance, mechanical strength and strong adhesion to diverse substrates, and hence they have become a favored choice for long-term, cost-effective anticorrosion protection in various industrial applications.4,5 Nevertheless, typical epoxy-based coatings do not show very good performance in terms of UV light resistance and water/moisture repellency, which in turn negatively impact their anticorrosion performance. In particular, when exposed in environments with high humidity and salinity (e.g. seawater), epoxy resins are susceptible to significant water absorption due to the presence of hydrophilic hydroxyl groups in the molecular structures of epoxy resins.6–9 The water adsorption triggers water penetration through the epoxy coating layer and deteriorates its adhesion to the metal surface. Once the water reaches the metal surface, the coating layer loses its protective function. To enhance their anticorrosion performance, epoxy resins are often combined with other functional materials (e.g. additives) to achieve improved stability and water repellency (i.e. hydrophobicity), and consequently improve corrosion protection.10–15Polysiloxanes are inorganic polymers comprised of stable hydrophobic Si–O backbones. They possess many outstanding attributes, such as high thermal stability, good tolerance to UV radiation, low temperature flexibility, strong hydrophobicity and moisture resistance. In addition, polysiloxanes are known to generate extremely low volatile organic compound (VOC) emissions. VOCs emitted from surface coatings have received growing concern for their adverse effects on human health and the environment. Hence, polysiloxane-based materials are recognized as a type of sustainable and environmentally benign coating material. Despite their many advantageous features, polysiloxanes usually do not show very good compatibility with commonly used organic coatings (e.g. polyurethanes and epoxy resins), mainly due to their hydrophobic nature. To enhance the applicability of polysiloxanes in coating technologies, chemical modifications have been performed to covalently link various organic functional groups to the molecular backbones of polysiloxanes.16–23
In this paper, we investigate the chemical modification of polysiloxanes with a renewable and bioactive organic compound, eugenol, and explore the application of the eugenol-modified polysiloxanes as anticorrosion additives in polymer coatings. Eugenol (2-methoxy-4-(prop-2-enyl)phenol) is a naturally occurring phenol “essential oil” which can be extracted from various plant sources such as clove oil.24 Eugenol is categorized as GRAS (generally recognized as safe) by the World Health Organization (WHO) and is non-mutagenic. As a low-cost and abundantly available organic compound, eugenol has been widely used in the food industry,25,26 medicine27,28 and dentistry29–32 due to its numerous pharmacological properties such as anaesthetic activity, antioxidant potential, antimicrobial effects, anti-inflammatory and anti-carcinogenic properties, and neuroprotective functions.24
Chemically, the presence of an allyl group in eugenol enables it to be covalently integrated into polymers and nanostructures through diverse chemistries. In 2012, Hawker and co-workers developed an efficient method to convert eugenol into a silyl-protected catechol which was then linked to polysiloxanes through thiol–ene coupling.33 The functionalized polysiloxanes were fabricated into various 2D and 3D patterned surfaces with straightforward pH-activated catechol-mediated adhesion. In 2014, Shibata and co-workers performed thiol–ene photopolymerizations of allyl-functionalized eugenols to make bio-based polymer networks.34 Harvey et al. reported the synthesis of a eugenol-derived bisphenol using Ru-catalyzed metathesis followed by Pd/C-catalyzed hydrogenation reactions. The bisphenol was utilized as a building block to prepare polycarbonate/cyanate ester networks35 and thermosetting resin.36 Renard and co-workers in 2016 reported the synthesis of antibacterial and antioxidant polymer networks derived from eugenol and linalool through a photoactivated thiol–ene reaction.37 Wan et al. developed a type of eugenol-based epoxy resin which shows enhanced mechanical properties and reduced flammability.38 Parisi et al. copolymerized eugenol and 4-penten-1-ol using Pd catalysis, and the resulting copolymers were found to show antibacterial properties.39 In 2015, Deng et al. prepared a methacrylated eugenol from eugenol and methacryloyl chloride, and the methacrylated eugenol was subjected to suspension polymerization to form polymer microspheres with oil-adsorbent abilities.40 Most recently, Kessler and co-workers used the same methacrylated eugenol as a reactive diluent to copolymerize with a commercial maleinated acrylated epoxidized soybean oil resin.41 In 2017, Brook and co-workers reported the use of Pt-catalyzed hydrosilylation and the Piers-Rubinsztajn reaction to link polysiloxanes to eugenol through its phenol, methoxy and allyl groups, forming silicon-based elastomers with tunable morphologies and constituent parts.42 According to the recent progress in eugenol-based polymeric materials described above, it is reasonable to envision that the functionalization of polysiloxanes with eugenol moieties would lead to new polymeric materials with physico-chemical and mechanical properties beneficial for applications in coating technology. In particular, we herein focus on the study of eugenol-functionalized polysiloxanes as anticorrosion additives to enhance the performance of conventional epoxy resin coatings (e.g. bisphenol-A diglycidyl ether types of resin).
2 Experimental
2.1 Materials and reagents
Polymethylhydrosiloxane (PMHS, Mn = 1700–3500 g mol−1), eugenol, triethoxyvinylsilane and chloroplatinic acid (H2PtCl6) were purchased from Sigma-Aldrich. Unmodified liquid epoxy resin (a diglycidyl ether of bisphenol A, EPON 828) and a polyamide curing agent (EPIKURE 3115) were provided by Hexion Inc., Ohio, USA (detailed information can be found from https://www.hexion.com). All solvents were of reagent grade and were used as received. Steel test panels (Q-PANEL QD-36) were procured from Q-Lab Corp (http://www.q-lab.com). These panels were thoroughly washed with acetone and dried in a desiccator for 24 hours prior to use. The general procedure for the preparation of epoxy coatings is described as follows: epoxy resin 828 (10.00 g) was diluted by xylenes (6.70 g). To the resulting solution was added 12.00 g epikure 3115 (12.00 g), polysiloxane (0.25 g, 2.5 wt%) and n-butanol (0.80 g). The mixture was stirred at room temperature for 30 min and allowed to stand for another 30 min before being applied to the steel panels.2.2 Synthesis of the eugenol-functionalized polysiloxanes
Two eugenol-functionalized polysiloxanes (P1 and P2) were synthesized via the Pt-catalyzed hydrosilylation reactions described in Fig. 1. For the synthesis, Speier’s catalyst43 was first prepared by dissolving H2PtCl6 (10.0 mg) in isopropanol (1.00 mL), and the freshly prepared catalyst was allowed to age for a few days before use. In the synthesis of P1, PMHS (2.00 g), eugenol (6.00 g) and Speier’s catalyst (0.04 mL) were mixed in a round-bottom flask and stirred for 2 days at room temperature. The resulting mixture was diluted with dichloromethane, then subjected to silica column flash chromatographic separation. Excess starting materials were flushed out of the silica column using dichloromethane as an eluent. Afterwards, P1 was collected using ethyl acetate as an eluent. Evaporation of the solvent under vacuum gave pure P1 (5.90 g) as a pale yellow viscous oil. 1H NMR (500 MHz, CDCl3): δ 6.67 (s, 1H), 6.57 (s, 2H), 5.43 (s, 1H), 4.68 (s, 0.13H), 3.73 (s, 3H), 2.46 (s, 2H), 1.57 (s, 2H), 0.49 (s, 2H), 0.05 (s, 3H) ppm (numbers of protons are reported as relative values); 13C NMR (75 MHz, CDCl3): δ 146.5, 143.8, 134.5, 121.1, 114.3, 111.2, 55.9, 39.4, 25.5, 17.6, 2.1, 0.2 pm; FTIR (KBr): 3504, 3422, 2957, 2926, 2858, 2152, 1607, 1512, 1460, 1429, 1367, 1259, 1232, 1151, 1076, 1018, 907, 843, 781 cm−1; GPC: Mn = 4100 g mol−1, PDI = 2.3.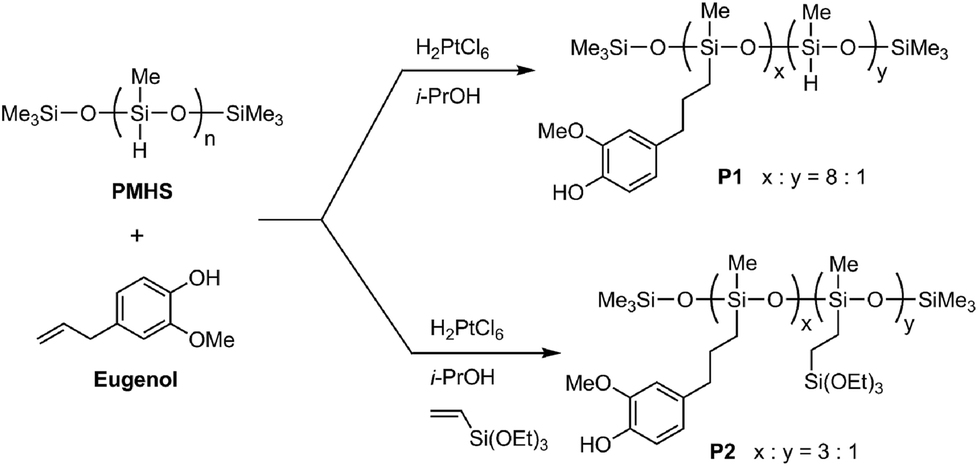 | ||
| Fig. 1 Synthesis of eugenol-functionalized polysiloxanes P1 and P2 through Pt-catalyzed hydrosilylation reactions. | ||
In the synthesis of P2, PMHS (2.00 g), eugenol (5.00 g), triethoxyvinylsilane (2.00 g) and Speier’s catalyst (0.04 mL) were mixed and stirred for 2 days at room temperature. The resulting mixture was diluted with dichloromethane, then subjected to silica flash column chromatographic separation. Excess starting materials were flushed out of the silica column using dichloromethane as an eluent. Afterwards, P2 was collected using ethyl acetate as an eluent. Evaporation of the solvent under vacuum gave pure P2 (6.70 g) as a pale yellow viscous oil. 1H NMR (500 MHz, CDCl3): δ 6.76 (s, 1H), 6.58 (s, 2H), 5.49 (s, 1H), 3.76 (s, 5H), 2.48 (s, 2H), 1.58 (s, 2H), 1.18 (s, 3H), 0.52 (s, 3H), 0.05 (s, 4H) ppm (numbers of protons are reported as relative values); 13C NMR (75 MHz, CDCl3): δ 146.5, 143.8, 134.6, 121.1, 114.3, 111.2, 58.6, 55.9, 39.4, 25.5, 18.5, 17.6, 2.1, 0.2 ppm; FTIR (KBr): 3518, 3412, 2953, 2926, 1607, 1514, 1456, 1429, 1367, 1259, 1234, 1148, 1072, 1015, 955, 843, 766 cm−1; GPC: Mn = 5900 g mol−1, PDI = 3.1.
2.3 Preparation of the polysiloxane-epoxy coatings
Prior to the detailed examination of the anticorrosion performance, the optimal weight percent load (wt%) of polysiloxane as an additive in the epoxy coatings was determined by soaking epoxy-coated test panels with P1 at various wt% in an aqueous solution of NaCl (3.5 wt%). The anticorrosion effectiveness was evaluated by simple visual examination of the plates after soaking the test panels in 3.5% brine for two weeks. The best performance was found when the additive P1 was loaded at 2–10 wt%. When the additive loading was either lower than 2 wt% or higher than 10 wt%, the anticorrosion effectiveness was found to decrease significantly. Coatings containing P1 between 2.5 wt% and 10 wt%, however, did not show much difference in performance in our screening immersion tests. From a practical point of view (i.e. cost-effectiveness), 2.5 wt% was thus chosen as the percent load for the polysiloxane additives in the rest of our experiments.For the preparation of the polysiloxane-epoxy coatings, a small amount of eugenol-modified polysiloxane P1 or P2 (2.5 wt%) was blended with commercial epoxy resins with stirring for 30 min at room temperature. The polysiloxane-doped epoxy resins were then applied on steel test panels by a brush coating method. The coated test panels were cured at room temperature for 7 days and then stored in a desiccator for 1 day before testing. For comparison purposes, some test panels were also coated with epoxy resins without any additives using the same method.
2.4 Characterization
Fourier-transform infrared (FTIR) spectra were recorded on a Bruker Tensor 2 spectrometer equipped with a ZnSe ATR module. 1H and 13C nuclear magnetic resonance (NMR) spectra were measured on a Bruker Avance 500 MHz spectrometer or a Tecmag APOLLO 300 MHz spectrometer with chloroform-d as the solvent. Gel permeation chromatographic (GPC) analysis was performed on a VISCOTEK GPC Max 2001 system with the TDA 305 triple detector array using polystyrene standards and THF as the eluent.Thermal gravimetric analysis (TGA) of the cured epoxy coatings was conducted on a TA Instruments Q500 Thermogravimetric Analyzer, scanned from 25 °C to 600 °C at a heating rate of 20 °C min−1 under nitrogen. The weight loss of the samples was determined as a function of the increasing temperature.
The surface morphological properties of the epoxy coatings were examined using a Q-Scope atomic force microscope (AFM) operated in the tapping mode and a Hitachi S570 scanning electron microscope (SEM) operated at 10 kV. Each of the samples for SEM imaging was prepared by dip-casting a steel panel (1.5 × 1.5 cm2) with the epoxy coatings. The hydrophobicity of the epoxy coatings was evaluated by water contact angle measurements using the method reported by Lamour and co-workers.44
2.5 Corrosion tests
The polysiloxane-epoxy-coated steel panels were subjected to corrosion tests by immersing them in an aqueous solution of NaCl (3.5 wt%) for varied periods. The effects of the eugenol-modified polysiloxanes P1 and P2 as additives on the anticorrosion performance were assessed by electrochemical impedance spectroscopic (EIS) analysis, carried out on a Metrohm Autolab potentiostat equipped with FRA32M at open circuit potentials over the frequency range of 10 kHz to 0.1 Hz with a perturbation amplitude of 10 mV. The impedance data was analyzed using the NOVA software provided by Metrohm Autolab. The electrochemical analysis was done in a three-electrode electrochemical cell including a coated steel panel as the working electrode (with a surface area of 19 cm2), a stainless steel counter electrode and an Ag/AgCl reference electrode. An aqueous NaCl solution (3.5 wt%) was used as the electrolyte solution. A Faraday cage was applied to shield the cell from external noise effects.3 Results and discussion
3.1 Structural properties of the eugenol-modified polysiloxanes P1 and P2
The chemical structures of the eugenol-functionalized polysiloxanes P1 and P2 were first characterized by FTIR spectroscopy and the detailed spectra are given in Fig. 2. In the spectrum of P1, the typical stretching modes due to the O–H, C–H and C![[double bond, length as m-dash]](https://www.rsc.org/images/entities/char_e001.gif) C bonds in eugenol can be clearly observed, confirming the covalent attachment of eugenol to the backbone of PMHS after the Pt-catalyzed hydrosilylation. Moreover, there is a weak vibrational band at 2140 cm−1 in the spectrum of P1, which is due to the Si–H stretching mode, and it indicates that the hydrosilylation of PMHS with eugenol did not fully consume the Si–H groups. Quantitatively, the percentage of Si–H groups that remained in P1 was determined to be ca. 11 mol%, according to the integration value of the Si–H signal (at δ 4.70 ppm) relative to those of the other protons in the 1H NMR spectrum (see Fig. 3A). For P2, the signals due to Si–H bonds are absent from both its IR and 1H NMR spectra, indicating that the Si–H groups have been completely consumed by the hydrosilylation reactions during the synthesis of P2. The high efficiency of Si–H conversion can be attributed to the good reactivity of triethoxyvinylsilane because of its less sterically hindered structure. Careful examination of the 1H NMR spectrum of P2 reveals that about 75% of the Si–H groups on the PMHS backbone had reacted with eugenol, while the other 25% had reacted with triethoxyvinylsilane via hydrosilylation. The synthetic outcome of P2 is consistent with the molar ratio of the starting materials applied (eugenol vs. tirethoxyvinylsilane, 3
C bonds in eugenol can be clearly observed, confirming the covalent attachment of eugenol to the backbone of PMHS after the Pt-catalyzed hydrosilylation. Moreover, there is a weak vibrational band at 2140 cm−1 in the spectrum of P1, which is due to the Si–H stretching mode, and it indicates that the hydrosilylation of PMHS with eugenol did not fully consume the Si–H groups. Quantitatively, the percentage of Si–H groups that remained in P1 was determined to be ca. 11 mol%, according to the integration value of the Si–H signal (at δ 4.70 ppm) relative to those of the other protons in the 1H NMR spectrum (see Fig. 3A). For P2, the signals due to Si–H bonds are absent from both its IR and 1H NMR spectra, indicating that the Si–H groups have been completely consumed by the hydrosilylation reactions during the synthesis of P2. The high efficiency of Si–H conversion can be attributed to the good reactivity of triethoxyvinylsilane because of its less sterically hindered structure. Careful examination of the 1H NMR spectrum of P2 reveals that about 75% of the Si–H groups on the PMHS backbone had reacted with eugenol, while the other 25% had reacted with triethoxyvinylsilane via hydrosilylation. The synthetic outcome of P2 is consistent with the molar ratio of the starting materials applied (eugenol vs. tirethoxyvinylsilane, 3![[thin space (1/6-em)]](https://www.rsc.org/images/entities/char_2009.gif) :1). It is worth noting that the functionalization of P2 with triethoxysilyl groups may also bring about some beneficial effects for corrosion protection. For instance, Yang and co-workers utilized triethoxylsilane as a hydrolyzable group to achieve self-healing coatings with improved corrosion prohibition.45 The average molecular weights of the eugenol-functionalized polysiloxanes P1 and P2 were analyzed by gel permeation chromatography (GPC), showing that P1 has a number average molecular weight (Mn) of 3200 g mol−1 and a polydispersity index (PDI) of 2.5. For P2, the GPC analysis showed that Mn = 4200 g mol−1 and PDI = 3.1. The GPC-measured molecular weights of P1 and P2 are moderately greater than that of the starting material PMHS (ca. 1700–3500 g mol−1), which indicates a lower degree of functionalization than that determined by the 1H NMR and FTIR studies (vide infra). It is likely that eugenol-functionalized PMHS has very different sizes and shapes than those of unmodified PMHS, owing to the addition of polar eugenol groups.46 As such, the GPC-determined molecular weights of eugenol-functionalized PMHS are somewhat underestimated.
:1). It is worth noting that the functionalization of P2 with triethoxysilyl groups may also bring about some beneficial effects for corrosion protection. For instance, Yang and co-workers utilized triethoxylsilane as a hydrolyzable group to achieve self-healing coatings with improved corrosion prohibition.45 The average molecular weights of the eugenol-functionalized polysiloxanes P1 and P2 were analyzed by gel permeation chromatography (GPC), showing that P1 has a number average molecular weight (Mn) of 3200 g mol−1 and a polydispersity index (PDI) of 2.5. For P2, the GPC analysis showed that Mn = 4200 g mol−1 and PDI = 3.1. The GPC-measured molecular weights of P1 and P2 are moderately greater than that of the starting material PMHS (ca. 1700–3500 g mol−1), which indicates a lower degree of functionalization than that determined by the 1H NMR and FTIR studies (vide infra). It is likely that eugenol-functionalized PMHS has very different sizes and shapes than those of unmodified PMHS, owing to the addition of polar eugenol groups.46 As such, the GPC-determined molecular weights of eugenol-functionalized PMHS are somewhat underestimated.
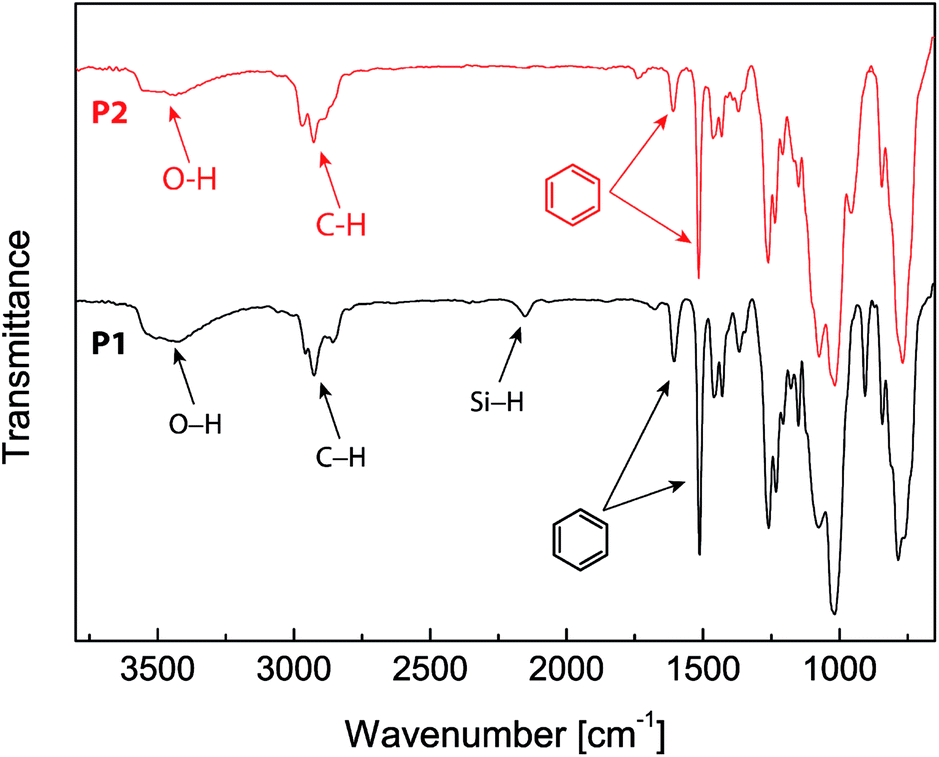 | ||
| Fig. 2 Infrared spectra of the eugenol-modified polysiloxanes P1 and P2. | ||
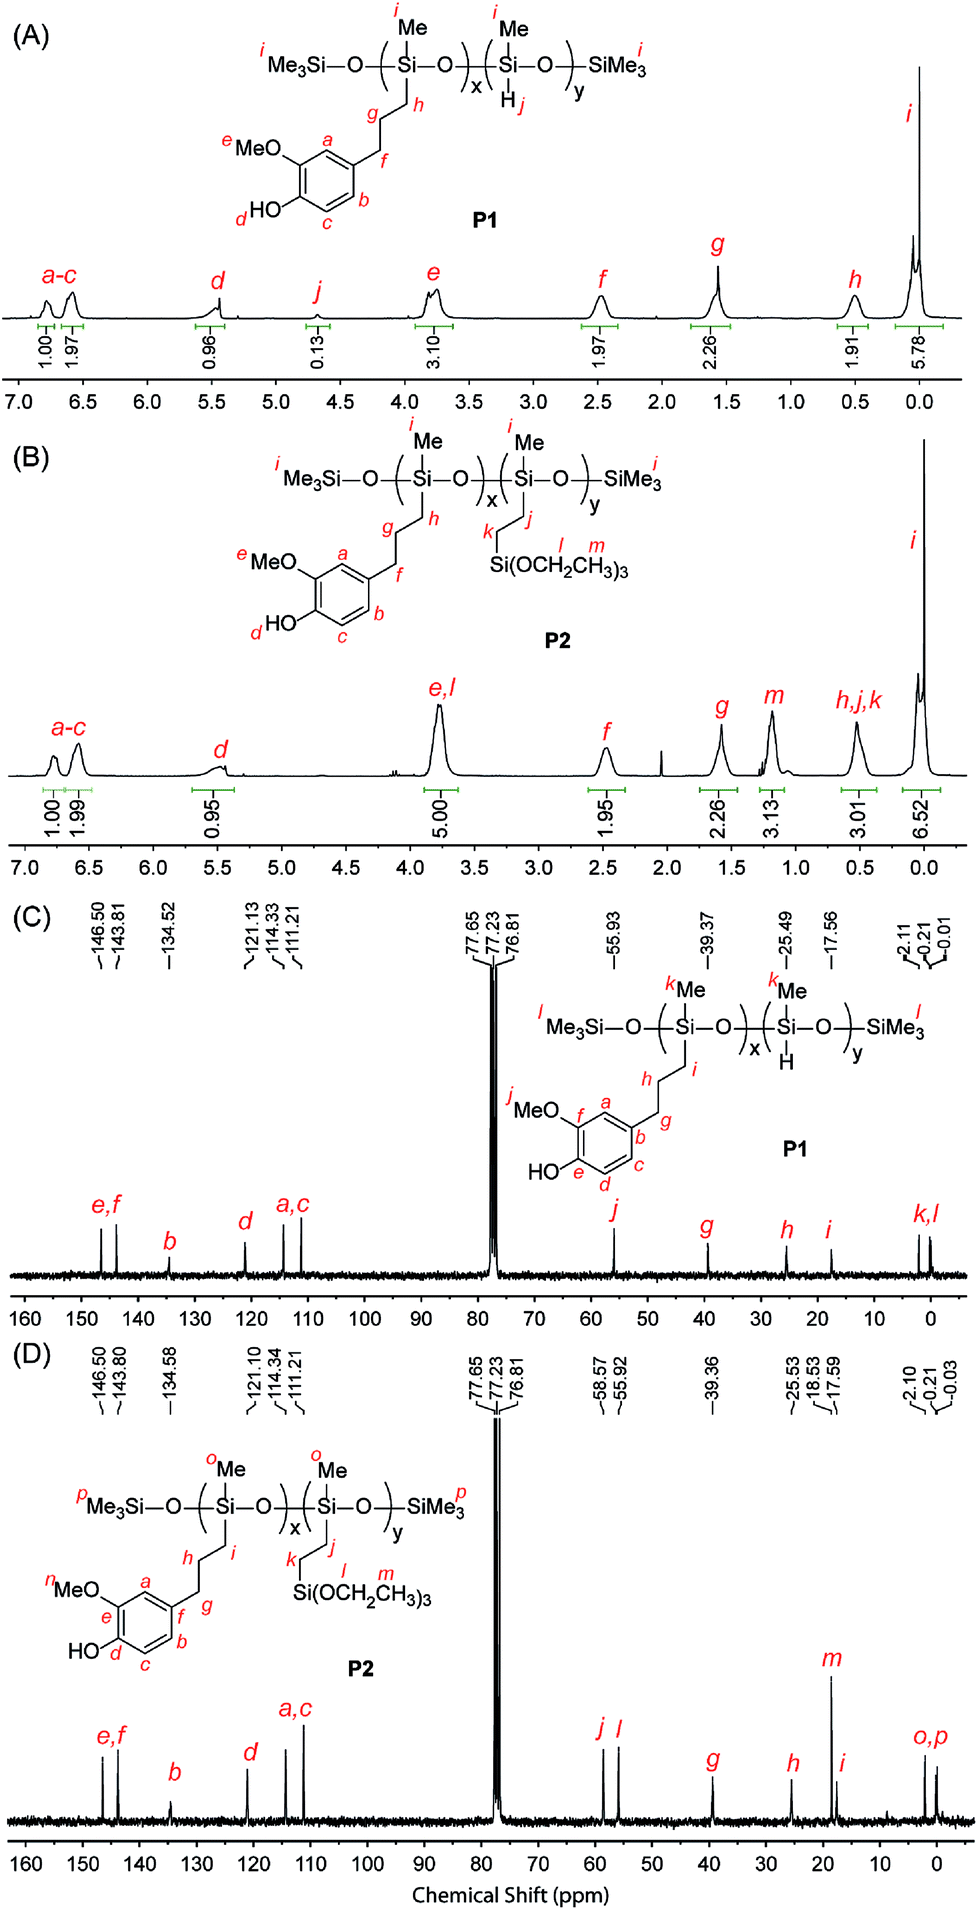 | ||
| Fig. 3 1H NMR (500 MHz, CDCl3) and 13C NMR (75 MHz, CDCl3) spectra of the eugenol-modified polysiloxanes P1 and P2 with proton and carbon signals assigned. | ||
3.2 Properties of epoxy resins blended with P1 and P2
Epoxy resins blended with 2.5 wt% of the eugenol-modified polysiloxanes P1 or P2 were brush-coated on test steel plates and cured. The chemical structural properties of the coatings were characterized by FTIR spectroscopy. Fig. 4 shows the IR profiles of the epoxy coatings blended with P1 and P2 respectively. For comparison purposes, the IR spectrum of the epoxy resins without any additives was also measured. All three spectra in Fig. 4 show similar vibrational patterns in the spectral region below 3000 cm−1, indicating that there are no significant changes to the chemical bonds and structures in the epoxy resins after mixing with a small percent of polysiloxane additives. It is also worth noting that the characteristic vibrational band of the epoxide ring at 917 cm−1 disappears completely in the three IR spectra, confirming that all of the epoxy coatings have been fully cured. For coatings containing P1 or P2 (Fig. 4B and C), the vibrational band at 1512 cm−1 (highlighted in blue) can be seen to show a noticeable enhancement in intensity relative to that of the unmodified epoxy resin (Fig. 4A). The most notable difference among the three IR spectra in Fig. 4 is the O–H stretching mode in the spectral region of ca. 3600–3200 cm−1. The unmodified epoxy resins give an O–H stretching band at 3301 cm−1, and such a low vibrational frequency indicates that the O–H groups in the coating layer form very significant hydrogen bonds. For the epoxy coatings with P1 or P2, the O–H bands move up to 3393 cm−1 and 3436 cm−1 respectively. Concomitant with the shift to high frequency, the relative intensity of the O–H stretching band is also observed to increase slightly for the epoxy coatings blended with P1 or P2. Such spectral patterns suggest that the O–H hydrogen bonding interactions within the epoxy coatings is greatly attenuated after the addition of P1 or P2 even at a small loading percent. The hydrophobic nature of the polysiloxane backbone of P1 and P2 is believed to give rise to such effects, and the results suggest that blending P1 or P2 into epoxy coatings can lead to significantly improved water/moisture repellency (i.e. hydrophobicity), which is in turn conducive to enhancing the anticorrosion performance of epoxy coatings.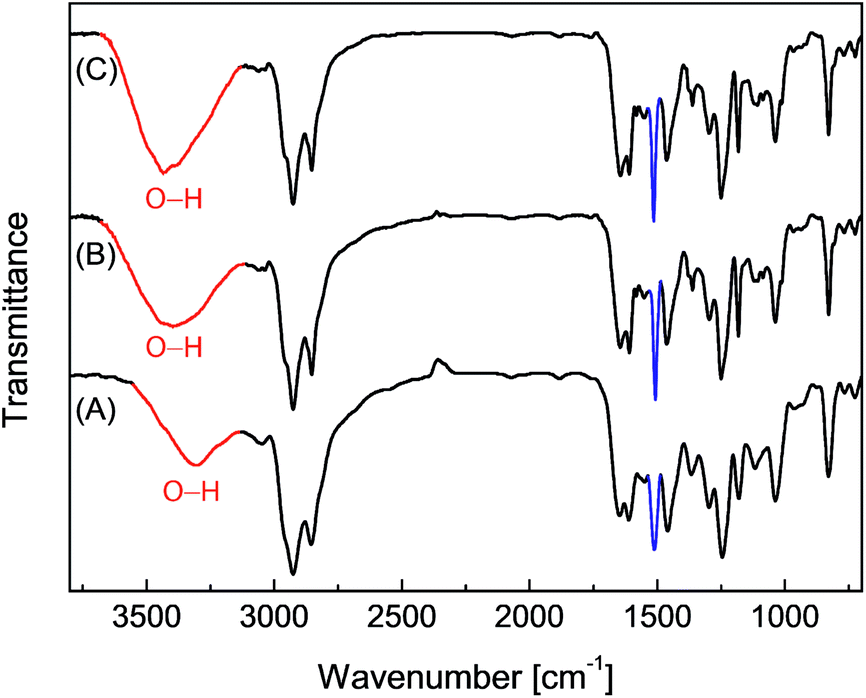 | ||
| Fig. 4 Infrared spectra of the epoxy resins coated on steel plates. (A) Epoxy resin only, (B) epoxy resin blended with P1 (2.5% wt) and (C) epoxy resin blended with P2 (2.5 wt%). | ||
The epoxy coatings blended with polysiloxanes P1 and P2 (2.5 wt%) were then subjected to thermogravimetric analysis (TGA) in order to characterize their thermal stability. Fig. 5 shows the detailed TGA traces and derivatives of the unmodified epoxy coatings in comparison with those of the epoxy coatings blended with P1 and P2 as additives. The TGA profiles, especially the derivative traces, reveal that the initial 5% weight loss occurs at around 305 °C for all three epoxy coatings, indicating that the addition of P1 or P2 has very little effect on the initial decomposition temperature of the epoxy coatings. The maximum decomposition temperature for the unmodified epoxy resin is 385 °C. After blending with P1 and P2, the maximum decomposition temperature is increased to 401 °C and 407 °C respectively. The TGA results show that the eugenol-modified polysiloxanes P1 and P2 can enhance the thermal stability of epoxy coatings to a significant extent.
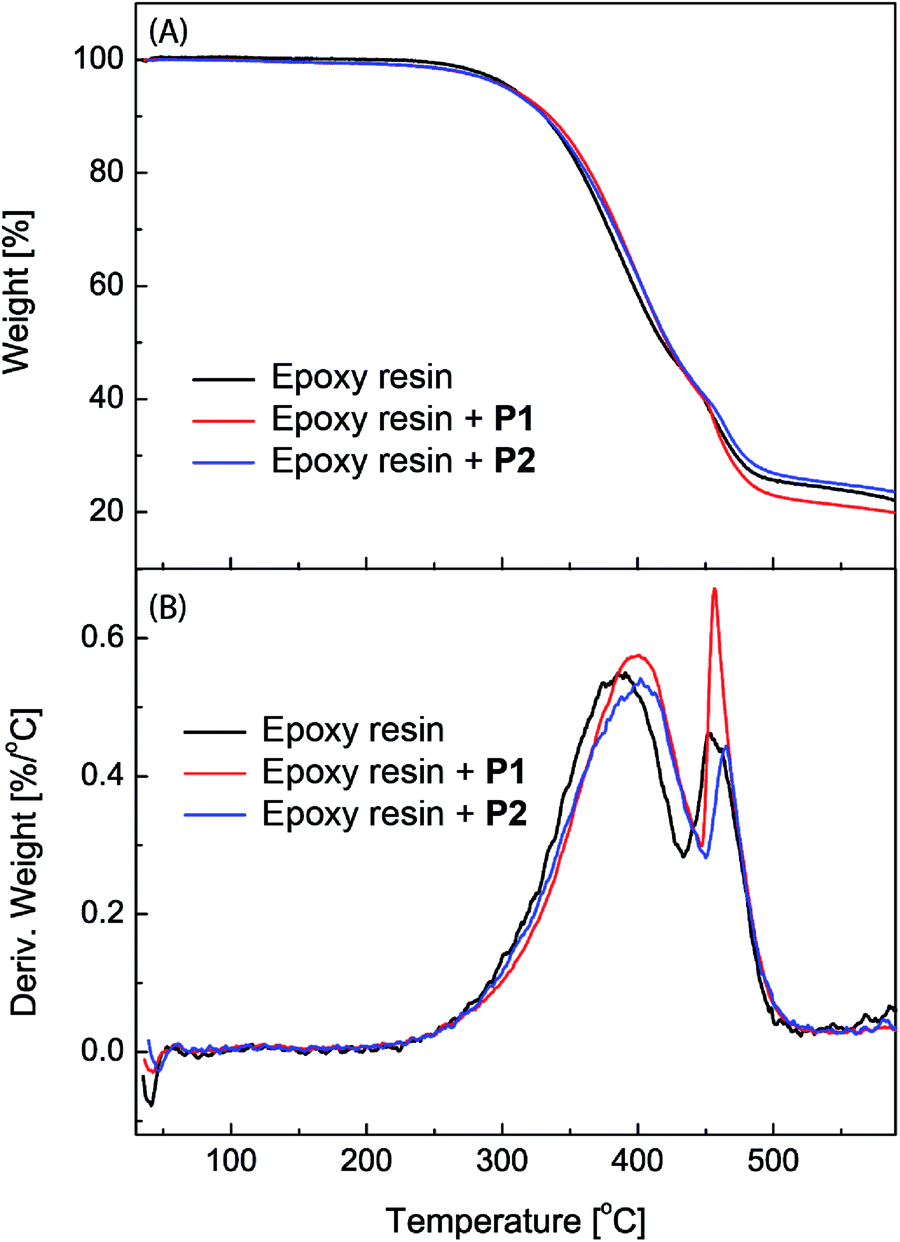 | ||
| Fig. 5 (A) TGA traces and (B) derivatives of the unmodified epoxy resin and epoxy coatings blended with polysiloxanes P1 and P2 (2.5 wt%) respectively. | ||
3.3 Surface morphology and hydrophobicity of the epoxy resin coatings
The surface morphological features of the epoxy coatings with and without eugenol-polysiloxane additives were examined by atomic force microscopy (AFM) and scanning electron microscopy (SEM). Fig. 6A–C shows the AFM images of the surfaces of the modified and unmodified epoxy coatings. The surface of the unmodified epoxy coating (Fig. 6A) is quite smooth and does not bear any particularly ordered patterns on the micron scale. In sharp contrast, the coatings blended with P1 or P2 give an ordered morphological pattern featuring evenly dispersed tiny dimples across the surface area examined (Fig. 6B and C). For the epoxy coating with P1, the dimensions of those dimples are 90 to 180 nm in diameter and 5 to 10 nm in depth as revealed by AFM analysis. For the epoxy coating with P2, the sizes of the dimples are a bit larger, 110 to 300 nm in diameter and 10 to 25 nm in depth.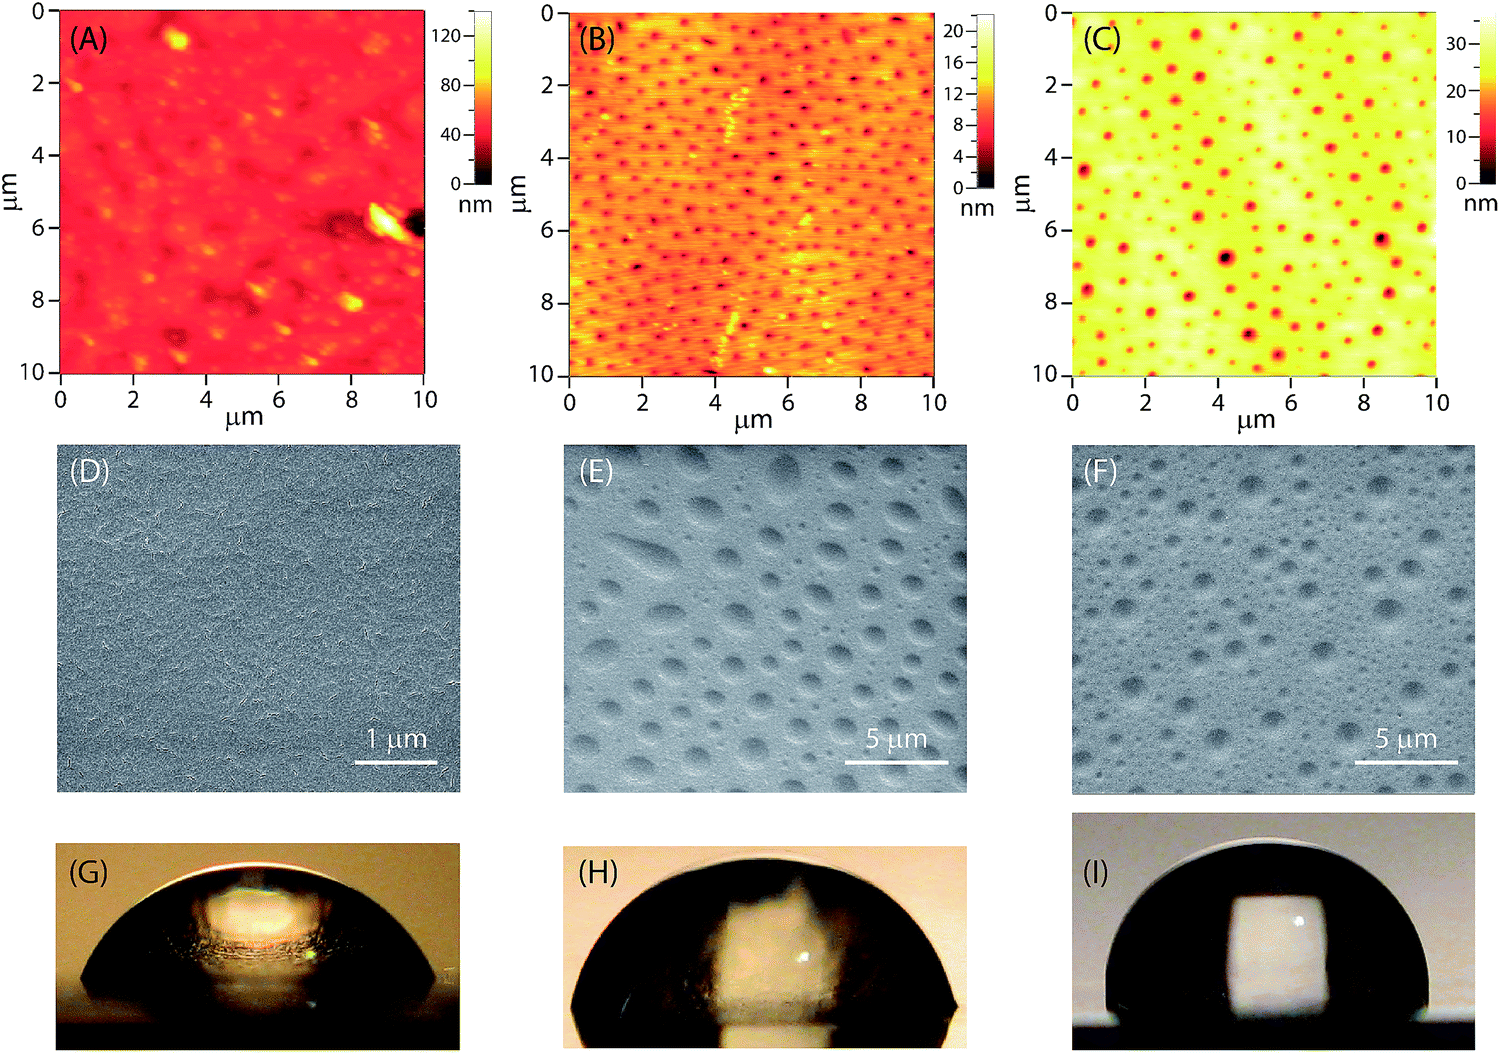 | ||
| Fig. 6 AFM images of (A) epoxy coatings, (B) epoxy coatings blended with P1 (2.5 wt%) and (C) epoxy coatings blended with P2 (2.5 wt%) measured in the tapping mode. SEM images of (D) epoxy coatings, (E) epoxy coatings blended with P1 (2.5 wt%) and (F) epoxy coatings blended with P2 (2.5 wt%). Photographic images of drops of deionized water (50 μL each) on the surfaces of (G) epoxy coatings, (H) epoxy coatings blended with P1 (2.5 wt%) and (I) epoxy blended with P2 (2.5 wt%). | ||
Fig. 6C–E shows SEM images of the surfaces of the modified and unmodified epoxy coatings, which agree very well with the AFM analysis; that is, the epoxy coatings blended with P1 or P2 give an ordered pattern of tiny dimples across the surface. The dimensions of the dimples observed by SEM imaging, however, are significantly larger than those recorded from AFM analysis. Since the preparation of the AFM and SEM samples was not rigorously controlled, variations in the experimental conditions, such as the coating thickness, concentration, curing time and temperature, may all have significant impact on the sizes of the dimples.
The hydrophobicity and wetting properties of the epoxy coating surfaces were characterized by water contact angle (θ) measurements. Fig. 6G–I shows photographic images of water beads on the surfaces of the epoxy coatings with and without the eugenol-modified polysiloxane additives. Generally speaking, the wettability of a surface depends on both the roughness and the chemical composition of the surface. The unmodified epoxy coating gives a water contact angle θ = 60° (Fig. 6G), which is indicative of a hydrophilic nature. When polysiloxane P1 or P2 is added, the value of θ increases to 78° and 90° respectively. It is obvious that the addition of P1 and P2 at a small loading percent (2.5 wt%) is sufficient to cause a considerable increase in hydrophobicity. In particular, in the case of the epoxy resin with P2 (Fig. 6I), the nature of the epoxy coating surface is altered from hydrophilic (θ < 90°) to hydrophobic (θ ≥ 90°) in the presence of additive P2. The increased water-repellency of the epoxy coatings doped with P1 or P2 can be attributed to the patterned surface morphology induced by the eugenol-polysiloxane additives.47,48
3.4 Electrochemical impedance spectroscopic analysis
The anticorrosion performances of the epoxy coatings with or without eugenol-modified polysiloxane additives were investigated by electrochemical impedance spectroscopic (EIS) measurements done at open circuit potentials.Fig. 7 shows the Nyquist plots for the epoxy coatings with or without polysiloxane additives. The plots that were measured immediately after immersion in NaCl aqueous solution (Fig. 7A) all exhibit a partial capacitive loop, indicating that all epoxy coatings provide good initial corrosion protection with impedance values higher than 107 ohm at 0.1 Hz and minimum phase angles around −86°. It can be clearly seen that the epoxy coatings blended with P1 and P2 respectively show greatly changed initial corrosion resistance. The coating containing P2 as an additive gives the largest semicircle diameter in the Nyquist plot, representing a greatly improved performance in terms of enhanced corrosion resistance compared to the other two coatings. After 20 days of immersion in NaCl aqueous solution, all of the epoxy coatings show decreased corrosion resistance. At this stage, the Nyquist plots for the epoxy coatings containing P1 or P2 still show one loop. The Nyquist plot for the epoxy coating without polysiloxane additives, on the other hand, changes into a very different pattern (see the inset of Fig. 7B). Associated with this is the observation of corrosion pitting on the plate, providing evidence that the corrosion processes take place on the steel surface at this stage.
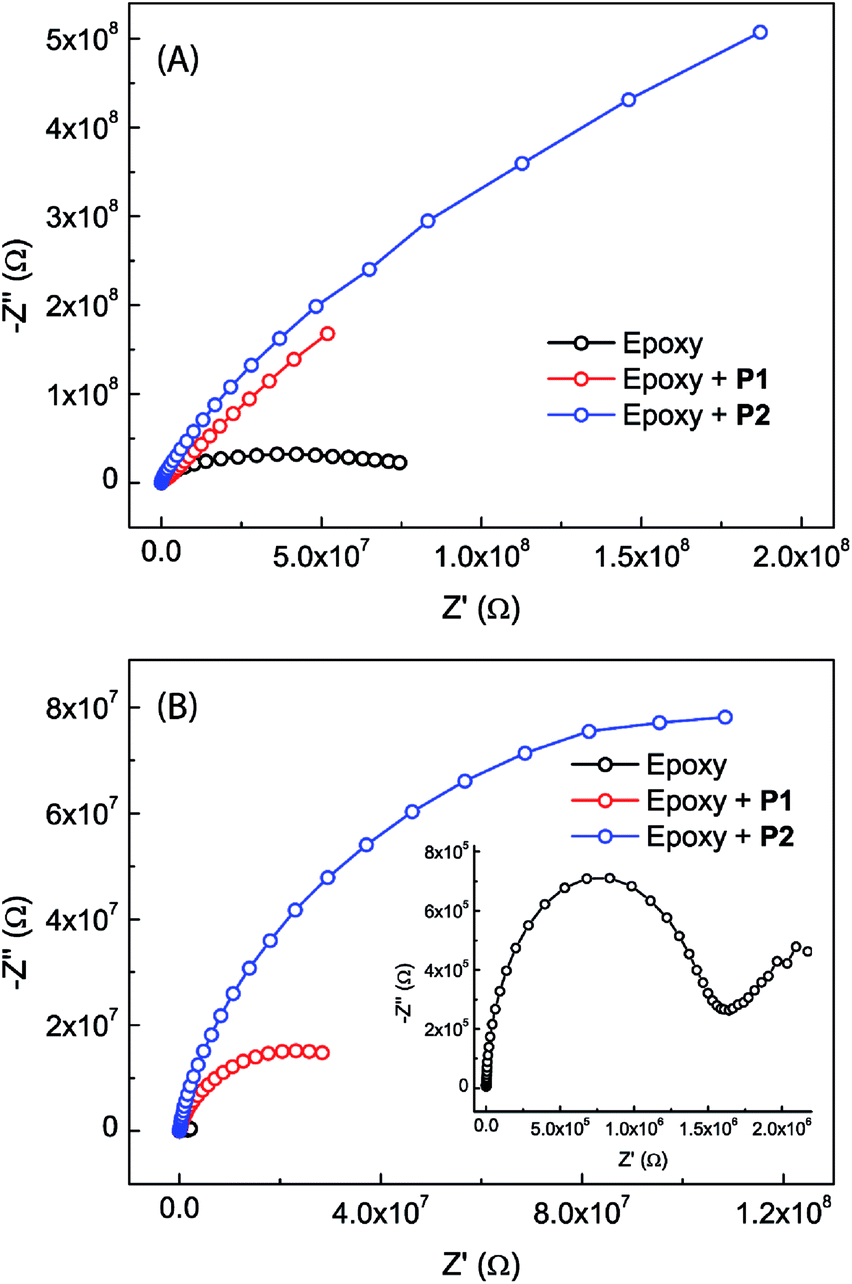 | ||
| Fig. 7 Nyquist plots for the epoxy coatings with (2.5 wt%) or without polysiloxane additives, (A) measured immediately after immersion in 3.5% NaCl aqueous solution and (B) measured after immersion in 3.5% NaCl aqueous solution for 20 days. Inset: expansion of the Nyquist plot for the epoxy coating without polysiloxane additives. | ||
Bode plots for the different epoxy coatings are given in Fig. 8. The unmodified epoxy coating shows the behavior of typical organic coatings (see Fig. 8A and D). The initial impedance value of the unmodified epoxy coating is as high as 7.8 × 10⁷ ohm at 0.1 Hz, but drops sharply to 3.8 × 10⁷ ohm after immersion for one day. At this stage, water and electrolyte have penetrated into the coating layer, but the amount of water and electrolyte that reached the metal surface might be insignificant. The increased water and electrolyte uptake in the coating layer leads to an increase in the capacitance and a decrease in the resistance of the epoxy coating.49–51 The Bode phase plot shows only one time constant in the very beginning. After immersion for longer than one day, a second time constant can be seen in the moderate frequency region. Such a result is rare but not unprecedented, since intact coatings can still give two time constants. It is known that a coating could possess two time constants simply due to the different properties of the water-saturated part and the deeper unaffected part of the coating. The second time constant disappears after immersion in NaCl solution for a few days. This is likely because the epoxy coating layer has been fully saturated with water and electrolyte, hence becoming homogeneous at this stage.49,52 After 6 days of immersion, the impedance value at 0.1 Hz drops to 2.6 × 10⁶ ohm (Fig. 8A). In addition, a small peak appears in the Bode phase plot at frequencies between 0.1 Hz to 1 Hz (Fig. 8D). The observation of a new time constant indicates that the corrosion process has progressed from water penetration to another stage, in which electrolyte ions begin to reach the metal surface to induce electrochemical reactions.49,53 After 20 days of immersion, the impedance value further drops to 2.2 × 10⁶ ohm as the electrochemical corrosion underneath the coating continues. At this stage, tiny pits on the coated sample surface become observable.
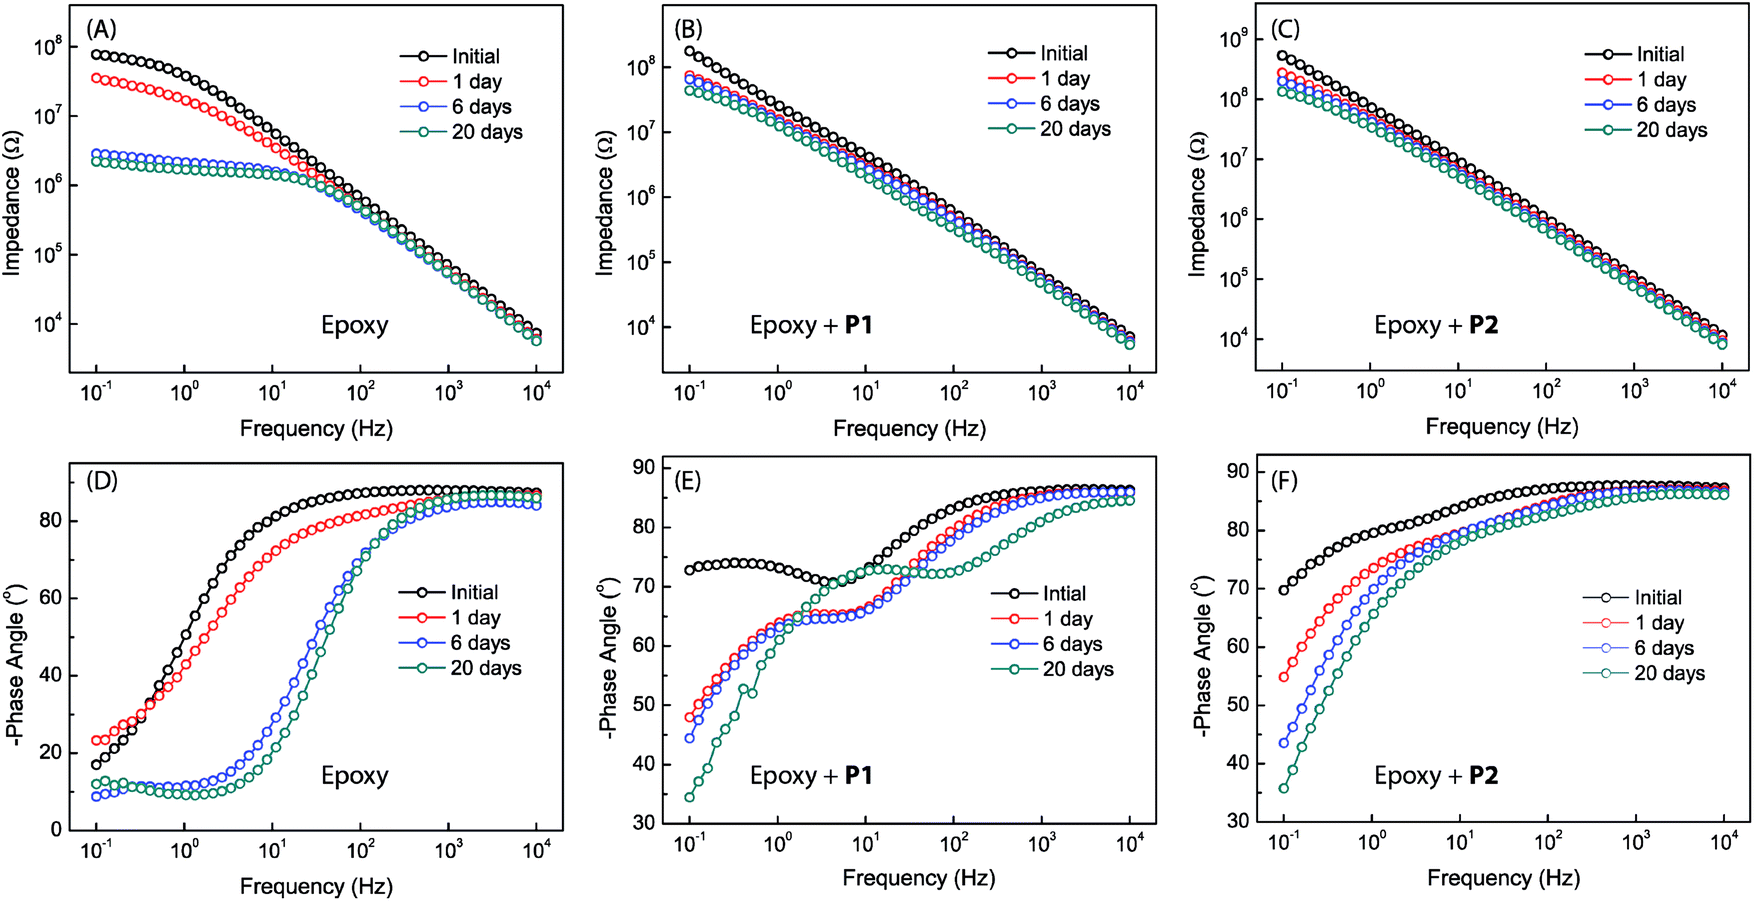 | ||
| Fig. 8 Bode plots for the different epoxy coatings without and with P1 or P2 as additives (2.5 wt%). Measurements were done at varied immersion times in 3.5% NaCl aqueous solution. | ||
The Bode plots for the epoxy coatings blended with P1 (2.5 wt%) also give a high impedance value of 1.8 × 10⁸ ohm at 0.1 Hz in the initial stage (Fig. 8B). The impedance drops to 7.4 × 10⁷ ohm after 1 day of immersion, and the value continues to decrease as the immersion time prolongs. However, the degree of change in impedance is not as large as that for the unmodified epoxy coating. After 20 days of immersion, the impedance value is still retained at a relatively high value of 4.4 × 10⁷ ohm, indicating a good coating durability. In contrast to the unmodified epoxy coating, the coating containing P1 gives two time constants at the beginning of immersion (see Fig. 8E) and this feature remains unchanged within the experiment time frame (up to 20 days of immersion). Unlike the unmodified epoxy coating, there was no visual observation of corrosion pits in the epoxy coating blended with P1 after 20 days of immersion. It is therefore evident that the addition of P1 to the epoxy coating can significantly improve corrosion protection. At this juncture, the origin of the second time constant observed at the low frequency region of the Bode plots is not quite clear. Two possible scenarios can be conceived: (1) if the second time constant is related to metal corrosion, the barrier effect of the coating blended with P1 may not be as good as that of the unmodified epoxy coating, but the corrosion rate should be much slower than that in the case of the unmodified epoxy coating. If so, the improved anticorrosion performance can be ascribed to the corrosion inhibiting effect exerted by polysiloxane additive P1. (2) The second time constant may result from the heterogeneity of the coating layer. If this is the case, the large difference in the two time constants may suggest that more complex factors are involved in the corrosion process in addition to water penetration. Within the epoxy coating blended with P1, two different domains may exist, epoxy resins and additive particles (P1) encapsulated by epoxy resins. During the curing stage, the particles of P1 together with the encapsulated layers of the epoxy resins associated with them might migrate to the surface region of the coating, driven by the hydrophobic nature of P1. As such, the P1 additives are assumed to take occupancy primarily within the surface region of the coating, which explains the observed patterns of tiny dimples in the microscopic analyses. In the meantime, the metal surface may also be enriched with P1 particles due to the strong phenol–metal or silanol–metal interactions. With this kind of heterogeneous coating architecture, water penetration can occur through multiple different pathways rather than the relatively simple case in the unmodified epoxy coating, leading to the observation of two time constants. It is also worth noting that in penetrating the coating layer containing P1, water molecules may have chances to encounter residual silanol groups of the polysiloxane additives, which in turn trigger silanol condensation reactions54 to thwart their further penetration. As seen in Fig. 8E, the Bode plots barely change from day 1 to day 6, and the phase angles after 20 days of immersion do not follow the same decreasing trend as the others. These results hint at water penetration into the coating layer of the epoxy resin blended with P1, resulting in complex changes rather than simple structural deterioration over varied periods of time. Quite possibly, the coating is capable of self-healing as a result of the condensation reactions between water molecules and the silanol groups of the polysiloxane additives in the coating layer.
The epoxy coating blended with P2 was found to show EIS properties similar to the one with P1. As can be seen in Fig. 8C, the impedance value of the coating at 0.1 Hz is 5.4 × 10⁸ ohm at the beginning of immersion test, and it remains as high as 1.3 × 10⁸ ohm after 20 days of immersion. The phase angle remains below −70° over a wide frequency range after 20 days of immersion. Not surprisingly, the epoxy coating blended with P2 additive also shows two time constants in the Bode plot. Compared to the coating with P1, the impedance value of the epoxy coating with P2 varies to a much lesser degree during the immersion period from day 6 and day 20. This observation suggests that the epoxy coating with P2 additive is more durable and resistant to water immersion. It is believed that the triethoxysilyl groups present in P2 make an important contribution to enhancing the barrier effect of the epoxy coating, most likely by increasing the cross-linking density and furnishing more silanol residues to inhibit or delay water penetration through the coating layer.
To further understand the electrochemical properties of the epoxy coatings blended with polysiloxane additives P1 and P2, their EIS data were fitted to give appropriate equivalent electric circuits (EEC). For comparison, the EIS data of the unmodified epoxy coating were also fitted into EEC. At the beginning of the immersion with one time constant, a simple EEC model typical of many organic coatings is established for the unmodified epoxy coating, which consists of the solvent resistance, Rs, in series with a parallel combination of the coating resistance, Rc, and coating capacitance, Cc (Fig. 9A). For the data with two time constants in the intact coatings, several common EEC models have also been tried, but they all failed to give good fitting outcomes. It was eventually found that the simple addition of a parallel combination of the coating resistance, R, and a constant phase element (CPE) in series to the first coating resistance afforded very good fitting (such as the model described in Fig. 8E). Another typical EEC model fits well for the later stage (days 6–13) when corrosion begins on the metal surface (see Fig. 9B). In this model, the CPE is substituted with a double layer capacitance (Cdl) and the resistance in parallel is related to the charge transfer resistance (Rct). As the immersion continued (around day 20), the coating failed to protect the metal surface, and it is at this time that corrosion pits emerged visually. In such a case, a typical EEC model including a Warburg element (W) as shown in Fig. 9C gives very good fitting outcomes.
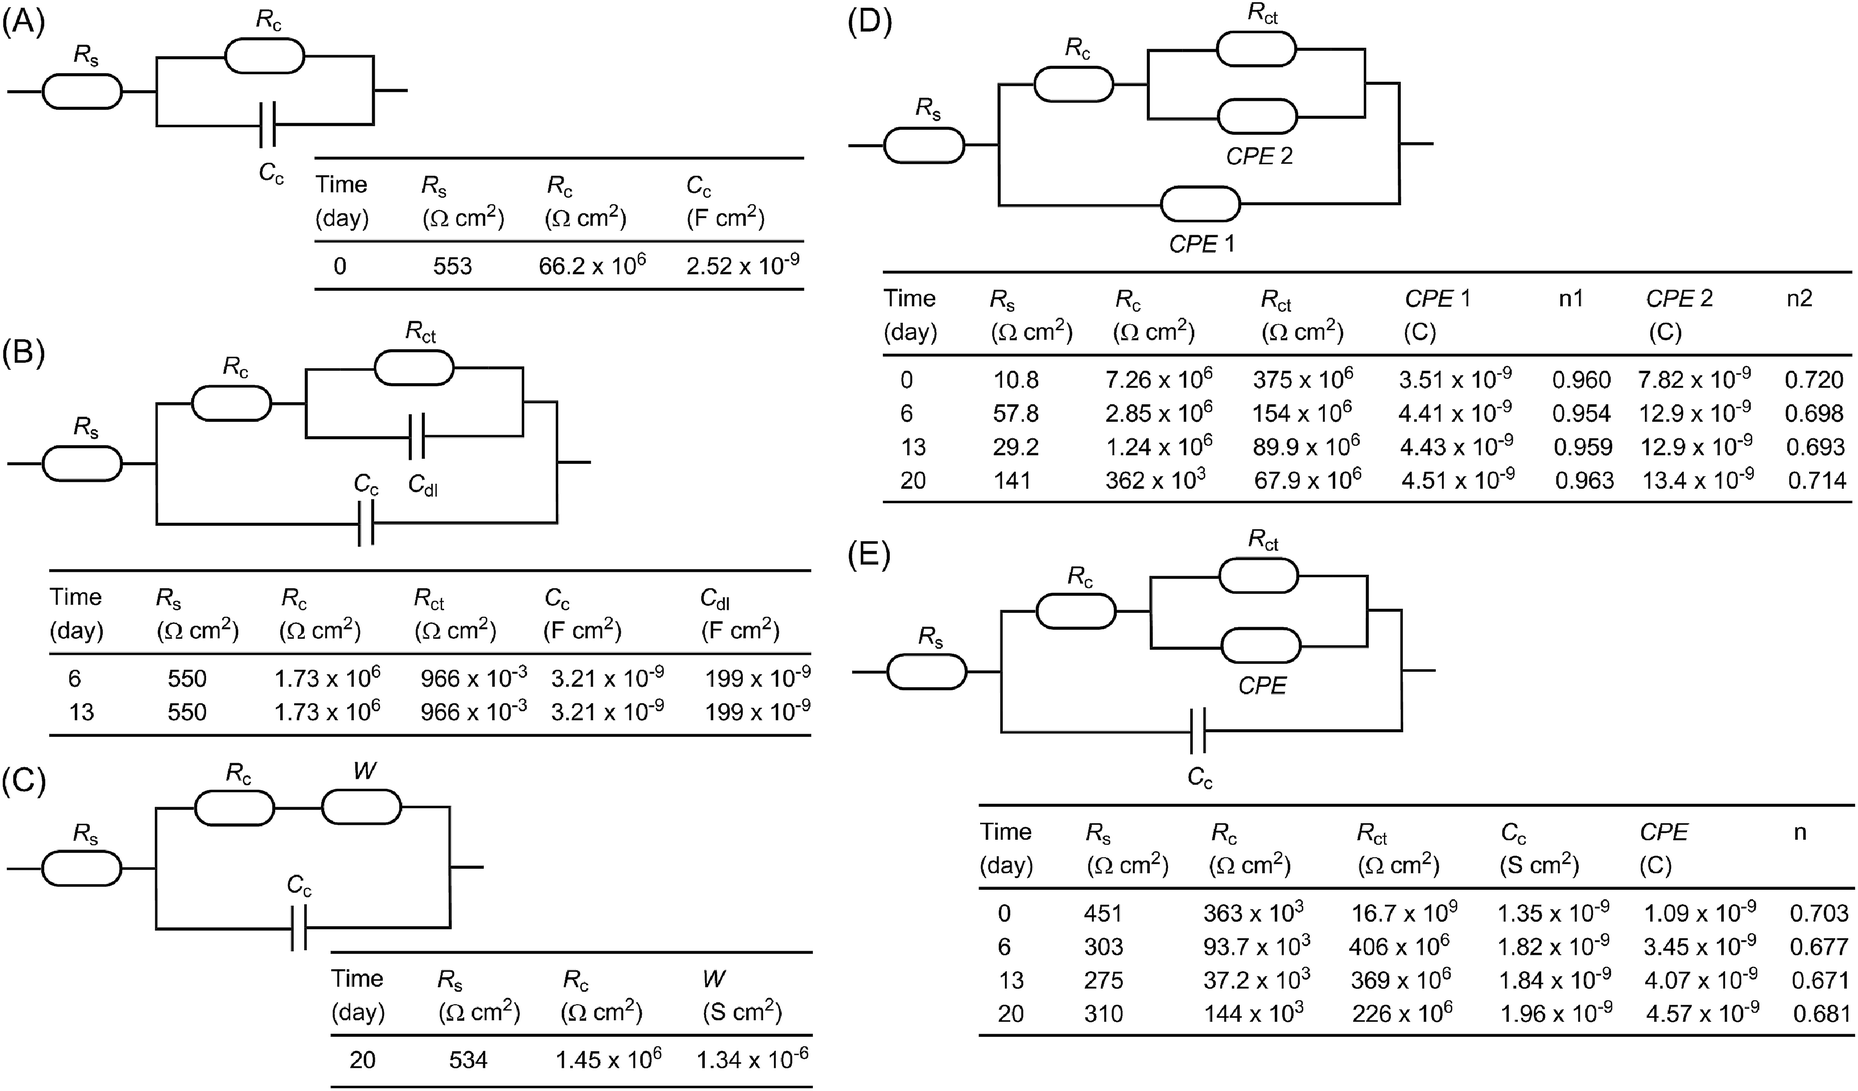 | ||
| Fig. 9 Equivalent electrical circuits (EEC) applied to fit the EIS data for epoxy coatings immersed in NaCl aqueous solution for varied periods. (A)–(C) Unmodified epoxy coating, (D) epoxy coating with P1 as an additive and (E) epoxy coating with P2 as an additive. | ||
For the epoxy coating blended with P1, the EEC used for the unmodified epoxy coating in the second stage when both capacitances are substituted with the phase constant element (CPE) (as shown in Fig. 8D) gives excellent fitting for most data during the whole immersion test period. However, based on the CPE values obtained by fitting, the calculated values for the double layer capacitances are much smaller than the typical ones. They are in fact very close to those of common organic coatings in value. These results somehow support the argument that the second time constant does not originate from corrosion on the metal surface. In this light, the second CPE in the model is tentatively assigned to the inner part of the coating that remains intact during the immersion test. Interestingly, the same model does not comply with the EIS data for the epoxy coating loaded with P2. Instead, the EIS data of the coating with P2 fits nicely with the model shown in Fig. 8E, where the first CPE is substituted with a capacitor.
4 Conclusions
Two eugenol-functionalized polysiloxanes, P1 and P2, were synthesized via Pt-catalyzed hydrosilylation reactions, and they have been tested as anticorrosion additives for commercial epoxy coatings. The cured epoxy coatings blended with the eugenol-modified polysiloxanes exhibit improved thermal stability and water resistance (hydrophobicity). On the microscopic scale, the surfaces of these polysiloxane–epoxy resin coatings possess ordered dimple-like patterned structures, which contribute to the enhanced hydrophobicity of the epoxy coating surfaces. The anticorrosion performance of commercial epoxy resin coatings was found to be greatly increased when polysiloxanes P1 and P2 were blended in the epoxy coatings even at a low loading percent (2.5 wt%). The enhanced anticorrosion properties can be primarily attributed to the effect of polysiloxane additives on delaying the water penetration processes, although the chemical reactivity of the residual silanol groups in the polysiloxane additives toward water molecules could deliver some beneficial effects as well. In summary, the eugenol-functionalized polysiloxanes reported in this work open a promising way to develop practically useful anticorrosion additives, since they not only give rise to satisfactory anticorrosion performance at low percent loading, but also are quite inexpensive and easy to produce in large quantities. Continued efforts to develop and optimize anticorrosion coating methods based upon this type of functionalized polysiloxane are therefore warranted.Conflicts of interest
The authors declare no conflicts.Acknowledgements
The authors acknowledge the funding support from the Natural Sciences and Engineering Research Council of Canada (NSERC), Canada Foundation for Innovation (CFI) and Memorial University.References
- P. P. A. Schweitzer, Paint and Coatings: Applications and Corrosion Resistance, CRC Press, 2005 Search PubMed.
- P. Sørensen, S. Kiil, K. Dam-Johansen and C. Weinell, J. Coat. Technol. Res., 2009, 6, 135–176 CrossRef.
- H. Leidheiser Jr, Corrosion, 1982, 38, 374–383 CrossRef.
- C. May, Epoxy Resins: Chemistry and Technology, Marcel Dekker, New York, 2nd edn, 1988 Search PubMed.
- B. Ellis, Chemistry and Technology of Epoxy Resins, Springer, Dordrecht, 1993 Search PubMed.
- B. De’Nève and M. Shanahan, Polymer, 1993, 34, 5099–5105 CrossRef.
- G. Z. Xiao and M. E. R. Shanahan, J. Polym. Sci., Part B: Polym. Phys., 1997, 35, 2659–2670 CrossRef CAS.
- J. Zhou and J. P. Lucas, Polymer, 1999, 40, 5505–5512 CrossRef CAS.
- C. Maggana and P. Pissis, J. Polym. Sci., Part B: Polym. Phys., 1999, 37, 1165–1182 CrossRef CAS.
- X. Shi, T. A. Nguyen, Z. Suo, Y. Liu and R. Avci, Surf. Coat. Technol., 2009, 204, 237–245 CrossRef CAS.
- W. Huang, Y. Zhang, Y. Yu and Y. Yuan, J. Appl. Polym. Sci., 2007, 104, 3954–3959 CrossRef CAS.
- J.-M. Yeh, H.-Y. Huang, C.-L. Chen, W.-F. Su and Y.-H. Yu, Surf. Coat. Technol., 2006, 200, 2753–2763 CrossRef CAS.
- S. A. Kumar, T. Balakrishnan, M. Alagar and Z. Denchev, Prog. Org. Coat., 2006, 55, 207–217 CrossRef.
- O. Becker, R. J. Varley and G. P. Simon, Eur. Polym. J., 2004, 40, 187–195 CrossRef CAS.
- E. Sharmin, L. Imo, S. Ashraf and S. Ahmad, Prog. Org. Coat., 2004, 50, 47–54 CrossRef CAS.
- J. Tong, R. Bai, Y. Zou, C. Pan and S. Ichimura, J. Appl. Polym. Sci., 1994, 52, 1373–1381 CrossRef CAS.
- P.-H. Sung and C.-Y. Lin, Eur. Polym. J., 1997, 33, 903–906 CrossRef CAS.
- L. Herczynska, L. Lestel, S. Boileau, J. Chojnowski and S. Polowinski, Eur. Polym. J., 1999, 35, 1115–1122 CrossRef CAS.
- J. M. Mabry and W. P. Weber, J. Polym. Sci., Part A: Polym. Chem., 2004, 42, 5514–5522 CrossRef CAS.
- C. Racles, M. Alexandru, A. Bele, V. E. Musteata, M. Cazacu and D. M. Opris, RSC Adv., 2014, 4, 37620–37628 RSC.
- M. Rutnakornpituk, Eur. Polym. J., 2005, 41, 1043–1052 CrossRef CAS.
- T. Ganicz, A. Kowalewska, W. A. Stańczyk, M. Butts, S. A. Nye and S. Rubinsztajn, J. Mater. Chem., 2005, 15, 611–619 RSC.
- Q. Ma and S. Feng, Carbohydr. Polym., 2006, 65, 321–326 CrossRef CAS.
- A. A. Khalil, U. ur Rahman, M. R. Khan, A. Sahar, T. Mehmood and M. Khan, RSC Adv., 2017, 7, 32669–32681 RSC.
- S. Burt, Int. J. Food Microbiol., 2004, 94, 223–253 CrossRef CAS PubMed.
- B. Prakash, A. Kedia, P. K. Mishra and N. Dubey, Food Control, 2015, 47, 381–391 CrossRef CAS.
- N. Didry, L. Dubreuil and M. Pinkas, Pharm. Acta Helv., 1994, 69, 25–28 CrossRef CAS PubMed.
- P. Prakash and N. Gupta, Indian J. Physiol. Pharmacol., 2005, 49, 125 CAS.
- C. F. Cox, C. L. Keall, H. J. Keall, E. Ostro and G. Bergenholtz, J. Prosth. Dent., 1987, 57, 1–8 CrossRef CAS.
- T. Woody and R. Davis, Operat. Dent., 1992, 17, 175–180 CAS.
- L. Rojo, B. Vázquez, J. San Roman and S. Deb, Dent. Mater., 2008, 24, 1709–1716 CrossRef CAS PubMed.
- L. Rojo, B. Vázquez, S. Deb and J. San Román, Acta Biomater., 2009, 5, 1616–1625 CrossRef CAS PubMed.
- J. Heo, T. Kang, S. G. Jang, D. S. Hwang, J. M. Spruell, K. L. Killops, J. H. Waite and C. J. Hawker, J. Am. Chem. Soc., 2012, 134, 20139–20145 CrossRef CAS PubMed.
- T. Yoshimura, T. Shimasaki, N. Teramoto and M. Shibata, Eur. Polym. J., 2015, 67, 397–408 CrossRef CAS.
- B. G. Harvey, A. J. Guenthner, G. R. Yandek, L. R. Cambrea, H. A. Meylemans, L. C. Baldwin and J. T. Reams, Polymer, 2014, 55, 5073–5079 CrossRef CAS.
- B. G. Harvey, C. M. Sahagun, A. J. Guenthner, T. J. Groshens, L. R. Cambrea, J. T. Reams and J. M. Mabry, ChemSusChem, 2014, 7, 1964–1969 CrossRef CAS PubMed.
- T. Modjinou, D.-L. Versace, S. Abbad-Andallousi, N. Bousserrhine, P. Dubot, V. Langlois and E. Renard, React. Funct. Polym., 2016, 101, 47–53 CrossRef CAS.
- J. Wan, B. Gan, C. Li, J. Molina-Aldareguia, E. N. Kalali, X. Wang and D.-Y. Wang, Chem. Eng. J., 2016, 284, 1080–1093 CrossRef CAS.
- L. Parisi, D. Scheibel, S. Lin, E. Bennett, J. Lodge and M. Miri, Polymer, 2017, 114, 319–328 CrossRef CAS.
- J. Deng, B. Yang, C. Chen and J. Liang, ACS Sustainable Chem. Eng., 2015, 3, 599–605 CrossRef CAS.
- Y. Zhang, Y. Li, L. Wang, Z. Gao and M. R. Kessler, ACS Sustainable Chem. Eng., 2017, 5, 8876–8883 CrossRef CAS.
- S. E. Laengert, A. F. Schneider, E. Lovinger, Y. Chen and M. A. Brook, Chem.–Asian J., 2017, 12, 1208–1212 CrossRef CAS PubMed.
- J. L. Speier, Adv. Organomet. Chem., 1979, 17, 407–447 CrossRef CAS.
- G. Lamour, A. Hamraoui, A. Buvailo, Y. Xing, S. Keuleyan, V. Prakash, A. Eftekhari-Bafrooei and E. Borguet, J. Chem. Edu., 2010, 87, 1403–1407 CrossRef CAS.
- M. Huang, H. Zhang and J. Yang, Corros. Sci., 2012, 65, 561–566 CrossRef CAS.
- J. Villegas, R. Olayo and J. Cervantes, J. Inorg. Organomet. Polym., 2003, 13, 205–222 CrossRef CAS.
- D. Wang, Z. Zhang, Y. Li and C. Xu, ACS Appl. Mater. Interfaces, 2014, 6, 10014–10021 CAS.
- M. Sangermano, R. Bongiovanni, G. Malucelli, I. Roppolo and A. Priola, Prog. Org. Coat., 2006, 57, 44–49 CrossRef CAS.
- M. Dornbusch, S. Kirsch, C. Henzel, C. Deschamps, S. Overmeyer, K. Cox, M. Wiedow, U. Tromsdorf, M. Dargatz and U. Meisenburg, Prog. Org. Coat., 2015, 89, 332–343 CrossRef CAS.
- A. Castela and A. S. Oes, Corros. Sci., 2003, 45, 1631–1646 CrossRef CAS.
- V. Misković-stanković, D. Drazić and M. Teodorović, Corros. Sci., 1995, 37, 241–252 CrossRef.
- S. González, F. Cáceres, V. Fox and R. Souto, Prog. Org. Coat., 2003, 46, 317–323 CrossRef.
- G. Grundmeier, W. Schmidt and M. Stratmann, Electrochim. Acta, 2000, 45, 2515–2533 CrossRef CAS.
- G. L. Witucki, J. Coat. Technol., 1993, 65, 57 CAS.
| This journal is © The Royal Society of Chemistry 2017 |