 Open Access Article
Creative Commons Attribution 3.0 Unported Licence
Highly luminescent silver nanocluster-doped fluorophosphate glasses for microfabrication of 3D waveguides
H. Fares *a,
S. N. C. Santosb,
M. V. Santosb,
D. F. Francoa,
A. E. Souzaa,
D. Manzanic,
C. R. Mendonçab and
M. Nalina
aInstitute of Chemistry, São Paulo State University, UNESP, Araraquara, SP, Brazil. E-mail: fares.hssen@gmail.com
bSão Carlos Institute of Physics, University of São Paulo, IFSC-USP, São Carlos, SP, Brazil
cInstitute of Chemistry of São Carlos, University of São Paulo, 13566-590, São Carlos, SP, Brazil
First published on 11th December 2017
Abstract
Highly photoluminescent glasses were prepared by embedding silver nanoclusters (Ag NCs) in a fluorophosphate matrix using a melt-quenching method. The NCs sizes were varied through silver concentration and thermal annealing. Depending on the NC size and excitation wavelength, different colors can be generated ranging from blue to yellow. The tunable photoluminescence and the excellent stability of Ag NCs even after heat treatment are attractive features for photonic applications. In this sense, we demonstrated the fabrication of luminescent tridimensional waveguides in as-prepared glasses by femtosecond laser micromachining. The waveguides were found to emit and guide white light when excited at 325 nm. We foresee that this study presents promising results for the development of new photonic devices and data storage.
1. Introduction
Glasses are of great importance on the development of photonic devices and optical components owing to their relatively easy manipulation and their versatility to be obtained in different shapes and sizes.1 In addition, they provide many unique characteristics, including excellent transparency, low cost, high optical damage threshold, and last but not least, the easiness of doping with active ions.2 Numerous applications of active glasses have been proposed for new technologies in optics and photonics such as fiber optics, fiber amplifiers, solid-state lighting, solar cells technology, light emitting diodes (LEDs) and other photonic devices.3–7 Among these numerous applications, significant attention has been drawn recently on the microfabrication of three-dimensional (3D) waveguides for femtosecond laser direct writing (FLDW).8–10 FLDW has been explored as an attractive processing tool for spatially controlled structural modification in transparent materials.11 The irradiation with tightly focused femtosecond laser pulses inside materials, makes 3D microfabrication possible due to the confinement of the nonlinear interactions within the focal volume. In addition, as a consequence of the nonlinear interaction during micromachining, the optical properties can be locally changed, resulting in changes in the refractive index. Depending on the experimental conditions, fs-laser micromachining can lead to waveguides with the refractive index changing from 10−4 to 10−2, allowing propagation of fundamental or higher-order modes.12 Recent research on the microfabrication of waveguides focused on glasses doped with Ag NCs due to their superior photosensitivity to the high repetition rate of the femtosecond laser.9 The combination of their tunable photoluminescence properties with the high photosensitivity could open the opportunities for the fabrication of different photonic devices, including 3D data storage and luminescent waveguides.In this direction, we demonstrate for the first time the feasibility of Ag NCs doped fluorophosphate glasses for the realization of luminescent 3D waveguides. The mechanism of formation of the metallic particles within the glass and the influence of the particle size on the emission properties of Ag NCs were also systematically investigated.
2. Experimental details
2.1. Glass synthesis and characterization
Fluorophosphate glasses with chemical composition (50 − x) NaPO3– 20PbF2–20BaF2–10YF3-xAgNO3 (mol%) were prepared by conventional melt-quenching method using high purity commercial materials (99.9%, Sigma-Aldrich). Silver nitrate (AgNO3) was added in different molar concentrations with x = 0, 1, 2, 3, and 5 mol% and labeled as Ag0, Ag1, Ag2, Ag3 and Ag5, respectively. A Pt/Au crucible containing approximately 10 g of mixed batches was heated at 1000 °C for 1 h under air atmosphere. Afterward, the melts were casted into a stainless steel mold preheated near to the glass transition temperature (Tg), at 350 °C. To avoid the accumulated mechanical constraints, the obtained samples were left at such temperature during 3 h before being cooled down to room temperature. Further, the sample Ag5 was cut and optically polished with a thickness of 2 mm, and each piece was heat-treated at 400 °C (slightly above the glass transition temperature) for periods of 2, 4 and 6 h. At this temperature, the glass viscosity decreases, allowing ion diffusion into the glass structure and providing aggregation and growth of silver NCs. The heat-treated samples are denoted as Ry, where y represents the annealing time (in hours) at 400 °C.Differential scanning calorimetry (DSC) measurements for prepared glasses were carried out at temperatures ranging from 200 to 800 °C using a Netzsch DSC Pegasus 404F3. In such conditions, The DSC scans were recorded using 10 mg as-cast glass specimens, which were powdered and heated in a platinum crucible under a flowing nitrogen atmosphere. The measurements were performed at a scan rate of 10 °C min−1 for heating and cooling.
Transmission electron microscopy (TEM) investigations were carried out using a Philips CM200 operating at 200 kV, equipped with X-ray energy dispersive spectroscopy (EDS) Bruker model XFlash 6TI30. UV-vis absorption spectra and transmission spectra were recorded using a Varian Cary 500 double beam spectrophotometer. Excitation and emission spectra were obtained using a Fluorolog (Horiba Jobin Yvon) fluorimeter equipped with a double monochromator and a photomultiplier tube sensitive from 250 to 825 nm. Slits were adjusted to lead to a resolution of 1 nm for both excitation and emission. All measurements were obtained from glass pieces at room temperature and corrected by the instrument response.
2.2. Microfabrication of optical waveguides
Waveguides were fabricated inside the glass bulk sample by femtosecond laser micromachining using 50 fs pulses from a Ti:Sapphire laser oscillator operating at 800 nm with a repetition rate of 5 MHz. The laser pulses with 32 nJ were focused through a microscope objective (NA = 0.65) inside the glass volume, while the sample was freely moved with a speed of 90 μm s−1 perpendicularly to the laser beam using a xyz translational stage. Two different light-coupling systems based on He–Ne (632.8 nm) and He–Cd lasers were used to characterize the guiding properties of the fabricated waveguide. In both coupling systems, a 20× objective lens was used to couple the laser and a CCD camera was used to observe the propagation mode. Total losses were determined by measuring the input and output power on the waveguide at 632.8 nm. The spectrum of guiding light was obtained using a fiber-based spectrometer. Details about our experimental setup for laser writing and optical coupling system are available in ref. 10.3. Results and discussion
3.1. Optical properties and nanostructure analysis
Fig. 1 shows the photography of prepared glass samples under daylight (Fig. 1(a)) and UV light (Fig. 1(b)). One can see that the as-prepared glasses doped with Ag NCs are homogeneous, free of strains and presenting yellowish color for samples containing high concentration of AgNO3. Under UV excitation, the un-doped sample does not show any appreciable luminescence, while the doped ones result in a yellow emission, increasing in intensity according to Ag concentration.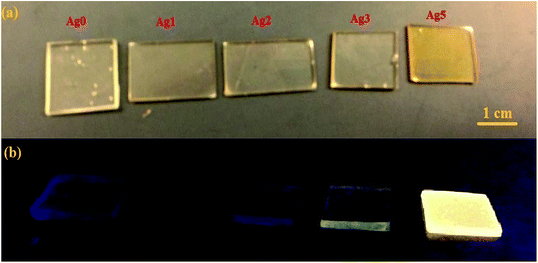 | ||
| Fig. 1 (a) Daylight pictures, (b) luminescence images excited by a UV lamp at 365 nm for all prepared glasses. | ||
Fig. 2(a) reveals the transmission spectra of the as-prepared glasses. The glasses show a good transmittance (>80%) which decrease at higher silver concentration. In addition, a weak absorption band located at about 430 nm is detected in all glass samples except for the undoped glass, as shown in Fig. 2(b). This band is attributed to the surface plasmon resonance (SPR) absorption of Ag NCs consisted of a tiny number of Ag.13 In addition, the SPR band becomes more intense as a function of AgNO3 concentration, indicating an increase on the Ag NCs size. The evolution of Ag species under different doping conditions can also be viewed from the pictures in the inset of Fig. 2.
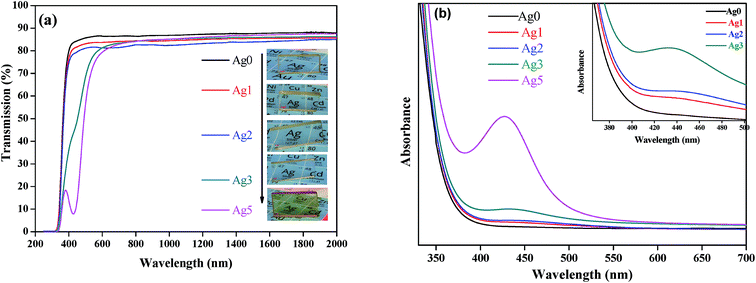 | ||
| Fig. 2 (a) Transmission spectra of glass samples as a function of AgNO3 concentration with their corresponding photograph presented in inset. (b) Absorption spectra of Ag NCs doped prepared glasses. | ||
In order to study the evolution of silver NCs sizes as a function of Ag doping, transmission electron microscopy (TEM) analysis were carried out for samples Ag2 and Ag5. TEM images, selected area electron diffraction pattern (SAED) and the particle diameter distribution are shown in Fig. 3 for Ag2 sample, and in Fig. 4 for Ag5 sample. The size distributions of Ag NCs of Ag2 and Ag5 samples were obtained by the analysis of 200 to 250 particles. As shown in TEM images (Fig. 3 and 4), the metallic Ag species are visible as dark spots distributed across the glass matrix. Additionally, the amorphous character of Ag NCs is evidenced by SAED pattern (Fig. 3(d) and 4(d)), which contains only diffuse diffraction rings typical for an amorphous phase. More importantly, the quantitative analysis of the size distribution histograms reveals that the average size does increase with the Ag doping. In particular, the number of NCs with diameter higher than 3 nm increases with the increase of AgNO3 concentration.
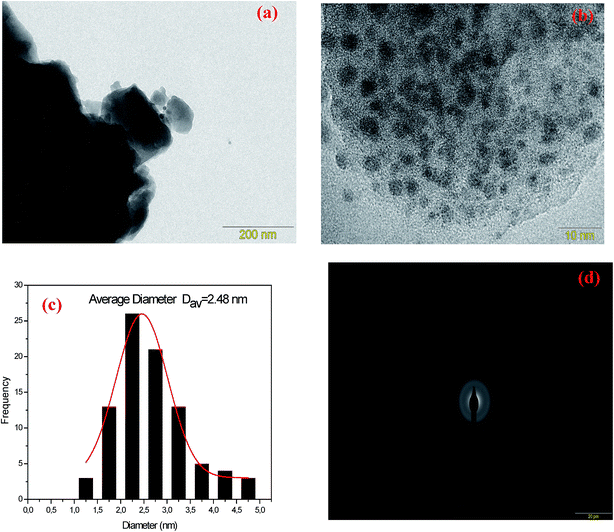 | ||
| Fig. 3 (a) TEM images (b) at 10 nm scale, (c) particle size distribution curve and (d) selected area electron diffraction pattern (SAED) of Ag3 glass samples. | ||
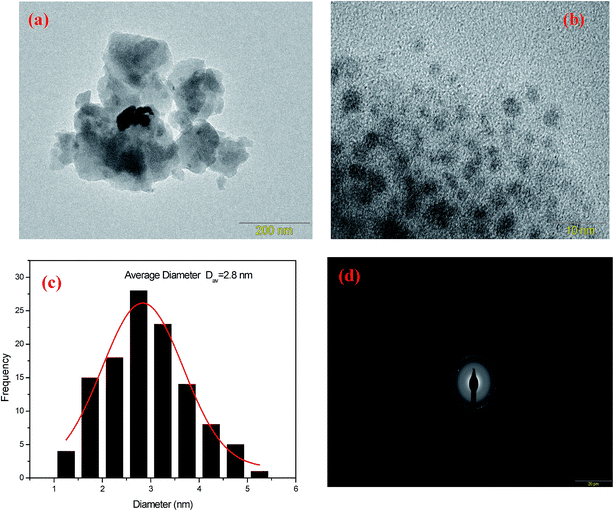 | ||
| Fig. 4 (a) TEM images (b) at 10 nm scale, (c) particle size distribution curve and (d) selected area electron diffraction pattern (SAED) of Ag5 glass samples. | ||
It is worthy to say that the formation and growth of Ag NCs occur without any heat treatment, and can be described by a three-step mechanism as follow: (i) the procedure starts with the formation of neutral Ag0 particle due to the electrons extracted directly from deffects that are intrinsic to the glass, namely F− vacancies residing within fluorophosphate glasses.;14,15 (ii) the increase of Ag amount decreases the distances among Ag+ ions, which interacts to form Ag22+ NCs. Then, (iii) due to the high mobility of the Ag particles through the fluorophosphate network, the neutral Ag particle, Ag22+ NCs and Ag+ particles intrinsically condense, result in the formation of other silver NCs, consisting of a few Ag atoms, defined as Agmx+ clusters, where m is the number of atoms and x is the formal charge.15 When the concentration of AgNO3 is high enough, the reduction rate increases resulting in the enlargement of the size and the concentration of Ag NCs.
3.2. Photoluminescence dynamics of Ag NCs doped fluorophosphate glasses
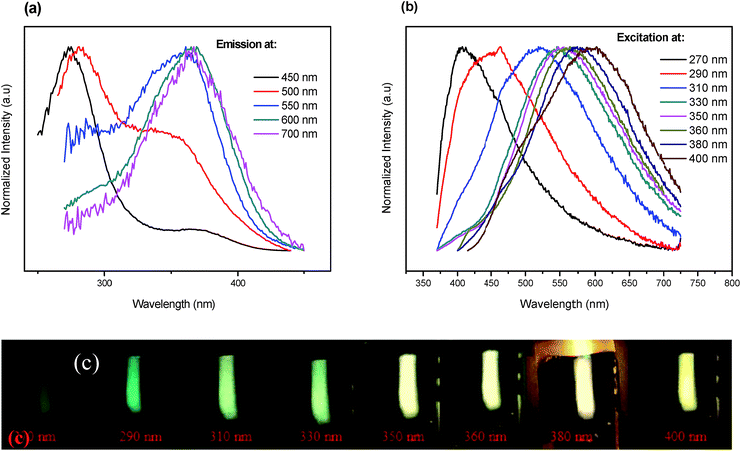
Fig. 5(a) depicts the normalized excitation (PLE) spectra of the basic glass doped with 5 mol% of AgNO3. The obtained spectra exhibit broad bands consisting of two individual peaks centered at 270 and 360 nm, respectively. The peak around 270 nm is related to electronic transition of small NCs (Ag single atom),16,17 while we suspect that the broad band centered at 360 nm and spanning the range from 300 to 410 nm is related to Ag NCs comprising different numbers of Ag atoms.16,18The emission spectra of the indicated sample, presented in Fig. 5(b), exhibit a broad luminescence band covering the whole visible range from 350 to 750 nm when the excitation wavelength is changed from 270 to 400 nm. The position and shape of the emission and excitation spectra match well with the earlier reported respective spectra of Ag NCs dispersed in zeolites, as well as in glass matrix.5,19 As it is seen from the pictures in Fig. 5(c), different colors can be generated when the wavelength is changed from 270 nm to 400 nm. Excitation at wavelengths shorter than 330 nm results in blueish colors, while excitation at longer wavelengths (>330 nm) results in warmer (yellowish) whites, due to the higher contributions of the yellow and the red to the total emission spectrum. Furthermore, an evolution in the relative intensity of those bands versus the detection wavelength is observed. Essentially, the band centered at 360 nm becomes more prominent with increasing the detection wavelength at the expense of the band related to the small NCs at 270 nm. More importantly, the fluorescent profiles revealed a red shift with excitation wavelength. An analogous dependence was observed for the luminescence profile of semiconductor quantum dots (QD's).7,20 Tikhomirov et al. explained this behavior by the presence of a variety of Ag NCs with different sizes and geometries, particularly emitting in the blue, green and red region.5,7,21 This is in fact supported by TEM micrographs and histogram for such nanocomposite as shown in Fig. 4(a and c). It can be clearly seen that the Ag particles have a quite large variation in diameter, d, from 1.2 to 5.3 nm. These results are consistent with previous experimental findings for Ag NCs dispersed in other media.22,23 We suspect that isolated Ag+ ions, Ag22+ and Agmx+ NCs are responsible for the observed tunable emission band.
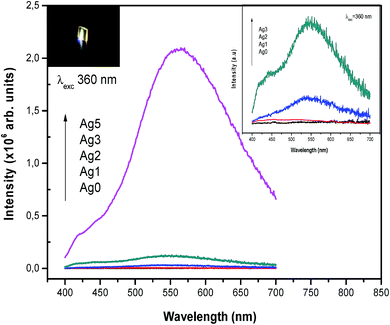
Excitation and emission spectra dependences on Ag NCs concentrations were also investigated. It seems that, the strongest emission occurs in the green-yellow part of the spectrum at 550 nm and it is most efficient under excitation at 360 nm. On the basis of the above observations, excitation (λem = 550 nm) and emission spectra (λex = 360 nm) were carried out for different concentrations of AgNO3. The results are shown in Fig. 6 and 7, respectively.
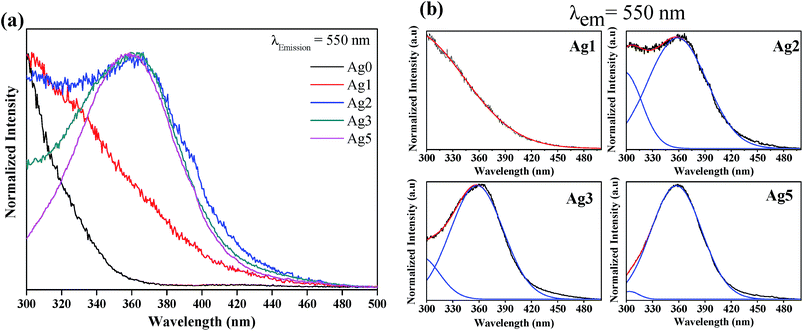 | ||
| Fig. 6 (a) Normalized and (b) de-convoluted excitation spectra of glass samples as a function of AgNO3 concentration. The emission was fixed at 550 nm. | ||
It is clear that these spectra are not affected by the change in oxides/fluorides ratios through varying AgNO3 doping level. In fact, no shifting of the respective excitation and emission spectra of Ag NCs was observed with varying doping level. This invariance indicates that the site of the Ag NCs does not depend on the proportion fluorides/oxide. In contrast, the de-convolution of excitation spectra presented in Fig. 6(b) shows a difference in the relative intensity of the two bands centered at 300 and 360 nm with the increase of AgNO3 concentration. In fact, the band at higher wavelength (centered at 360 nm) is more prominent in Ag5 glass samples at the expense of the band related to the small NCs (centered at 300 nm). On the other hand, the emission band related to Agmx+ NCs (occurs in the green-yellow part of the spectrum at 550 nm), increases drastically with the increase of AgNO3 concentration (Fig. 7). Both results can be explained by an increasing in the silver NCs concentration and/or size with the increase of Ag doping level.16 In fact at lower concentration of AgNO3, the glass contains predominantly silver ions (Ag+). As the concentration of silver increases, the reduction rate also increases, resulting in increases in the concentration of Ag NCs. Furthermore, the TEM images show that the volume fraction of large NCs increases with the increases of Ag doping level which support our point of view.
3.3. Heat-treatment dependence of the Ag NCs luminescence
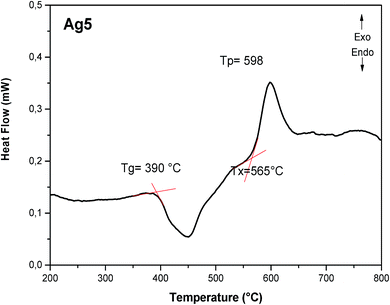
In order to select the most suitable glass sample with highly luminescence for the target application, we have applied the heat-treated technique for different periods, according to the DSC curve of Ag5 sample displayed in Fig. 8. The glass transition Tg and onset crystallization temperature Tx are estimated at 390 °C and 565 °C, respectively. In such condition, the sample Ag5 was heat-treated above the glass transition temperature (at 400 °C = Tg + 10 °C), for different periods (2, 4, and 6 h), in which the viscosity of glass is reduced for diffusion, aggregation and growth of Ag NCs. The heat-treated samples of Ag5 glass were labeled as R0, R2, R4 and R6, according to the heat-treatment time.The detailed nanostructure of the Ag particles within heat treated glasses was analyzed by means of TEM and SAED. The results are shown in Fig. 9. Following this annealing, the TEM micrographs of the sample heat treated for 4 h (R4) show the presence of discrete diffraction rings, striking different from the diffuse halos observed in the as-prepared glass (Fig. 9(a and b)). The quantitative analysis of the size distribution histograms (Fig. 9(c)) reveals that with the heat treatment, the average size of the silver NCs increases from 2.8 nm, for the as-prepared glass (Ag5 denoted in this section R0), to 3.73 nm after 4 hours of heat treatment. In addition, analysis of high resolution TEM image shows that the spherical particles are consistent with crystal lattice with d-spacing of 0.25 nm, which corresponds to (111) plane of Ag NPs.24 Moreover, the selected area electron diffraction (SAED) pattern obtained for the sample annealed for 4 h also indicates the presence of crystallographic planes, confirming the crystalline character.
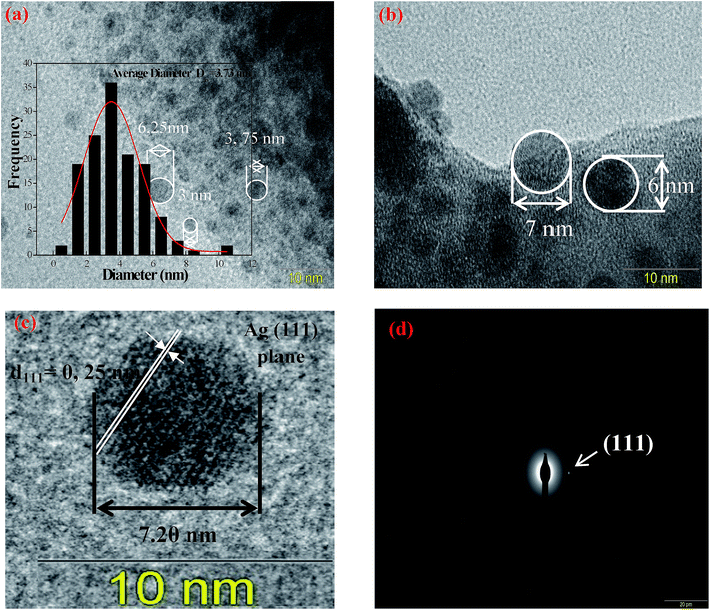 | ||
| Fig. 9 TEM images, particle size distribution curve and SAED pattern of silver NCs doped fluorophosphate glass after annealing at 400 °C for 4 h. | ||
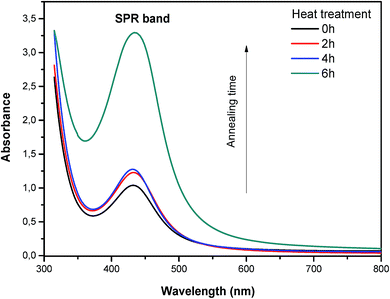
The absorption spectra of the corresponding glasses support this point of view (Fig. 10). In fact, the heat-treated glasses show a pronounced plasmon absorption band with a FWHM of 80 nm in the visible part of the spectrum. This plasmon absorption band increases in intensity and red-shifts with heat treatment time, indicating an increase in the silver NCs size. Taking into account this result, we focus now on the effect of heat treatment on the luminescence properties of silver NCs doped fluorophosphate glasses, with the aim of understanding the relation between the size of Ag particles, responsible for surface Plasmon effects, and luminescence properties.
The emission spectra of the as-prepared (R0) and heat-treated glasses obtained under 360 nm excitation are shown in Fig. 11. As it can be seen, the emission intensity of Ag NCs doped fluorophosphate glasses decreases after heat treatment. A further heat treatment results in further decrease of the emission, as well as a red shift of the emission band. Combining the TEM results and emission spectra of heat-treated glasses, we believe that the quenching of Ag luminescence with heat treatment is mostly related to the evolution of the amount of Ag NCs as a function of heat treatment, as indicated by the TEM and emission spectra results. During the heat treatment the luminescent particles aggregates in larger Ag NPs which probably cease to emit as for normal non-luminescent silver metal.14
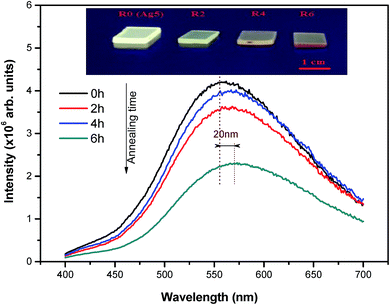 | ||
| Fig. 11 Emission spectra of the as-prepared and heat treated Ag NCs doped glasses upon 360 nm excitation. The inset shows pictures of luminescent Ag NCs doped glasses excited by a UV lamp at 365 nm. | ||
In general, plasmonic NPs are known to strongly absorb light, which is related to the collective oscillation of conduction electrons, but they are not luminescent.14 In contrast, when the particle size becomes comparable to the Fermi wavelength the optical properties of Ag NCs differ from such regime (Ag nanoparticles).25 In this case, metal NCs become molecular species and discrete energy levels arise at the band edges, making it possible to tune strong fluorescence through a wide spectral window.25 These two size-dependent effects are summarized schematically in Fig. 12.
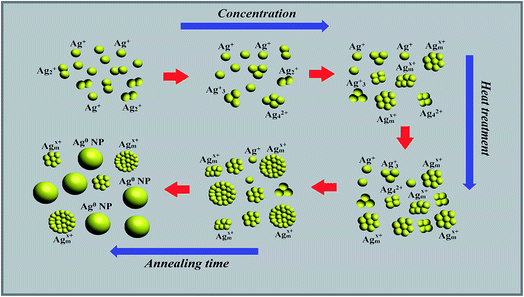 | ||
| Fig. 12 Schematic illustration of the initial steps of Ag NCs formation, growth and the precipitation of Ag NPs after heat treatment. | ||
The NCS sizes were varied through silver concentration and thermal annealing. After the first synthetic step, the glass contains predominantly silver ions (Ag+) and few NCs consisting of a few neutral or charged Ag particles defined as Agmx+ NCs. As the concentration of silver increases, the reduction rate also increases, resulting in the enlargement of the size and the concentration of Ag NCs. Presumably, over tens of atoms, Ag NCs aggregates tend to adopt a metallic behavior, evidenced by the SPR in the absorption spectra. From our fluorescence measurements, it was found that the PL intensity, of the samples with low Ag doping (Ag1, Ag2), is weak and increases when further Ag NCs are formed (Ag3, Ag5) and that different colors can be generated when the excitation wavelength is changed from 270 nm to 400 nm. This behavior, similar to the luminescence proprieties of quantum dots, suggests a distribution of Ag NCs with different sizes.7,10 Thermal treatment above the glass transition temperature leads to the growth of silver NCs in larger Ag NPs. The findings for annealing are the following: (i) the characteristic silver plasmon band evolves in the absorption spectra, (ii) the silver NCs grow into larger NPs, and hence, the number of NCs decreases; (iii) beyond this change in the structure of Ag particles (Ag NCs aggregates into Ag NPs), the PL intensity decreases.
3.4. Microfabrication and characterization of optical waveguides
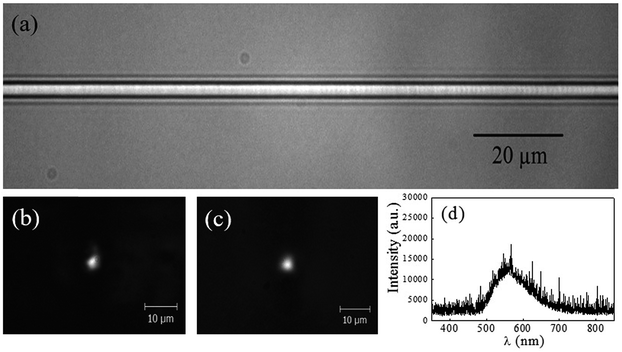
Fig. 13(a) shows an optical microscope image (top view) of the waveguide produced by fs-laser micromachining approximately 200 μm below the sample surface. As it can be seen, a continuous and homogeneous waveguide with a diameter of about 5 μm was obtained. Fig. 13(b) shows the near-field output profile of the light guided at 632.8 nm, which corresponds to a monomode distribution. Such result indicates a positive change in the refractive index of the material, i.e., the refractive index is larger at the irradiated region than in its surroundness, which allows light confinement. We note that, the difference between the refractive index of the fabricated waveguide and its surrounding is on the order of 2 × 10⁻³. This value was obtained by fitting the intensity profile of the guided mode at 632.8 nm using a well-known analytical solution. Moreover, the determined total loss, including coupling and propagation losses, is in the order of 15 dB for the whole length waveguide (10 mm).In addition, when laser light at 325 nm was coupled to the waveguide, it was possible to observe a guided white light in the near-field output profile, as shown in Fig. 13(c). The spectrum of such guided white light is displayed in Fig. 13(d). A redshift in the emission band in comparison with the emission spectrum after laser irradiation is observed (Fig. 5(b)). This behavior can be a consequence of the decrease of Ag+ ions concentration in the waveguide core since local heating generated due to the cumulative effect during irradiation might promote aggregation of the reduced Ag+ ions into larger Ag NCs.10
4. Conclusion
In summary, fluorescent silver nanoclusters (Ag NCs) doped fluorophosphate glasses have been prepared using melt-quenching method. The shape and the spectral properties were evaluated using transmission electron microscopy (TEM) and photoluminescence measurements. First of all, we show that careful adjustment of the silver concentration and heat treatment lead to glasses with interesting emissive properties that may find several applications such as, for instance, light emitting diodes (LEDs) and other active photonic devices. Lastly, the prepared glass system has been tested as a material for microfabrication of luminescent waveguides. Using the femtosecond laser, homogenous and continuous waveguides were successfully fabricated whose distribution corresponds to a monomode guidance. The main issue for the prepared waveguides is the higher optical loss compared to other waveguides written in other glass system. Considering the fact that the thickness of the waveguide is only ∼5 μm, the results reported herein are still interesting and there is a great potential to reduce the loss by optimizing the concentration of silver NCs and the fabrication conditions including laser spot size, exposure time, energy density and wavelength of laser writing.Conflicts of interest
There are no conflicts to declare.Acknowledgements
The authors acknowledge Brazilian agency FAPESP (grants numbers #2016/16343-2, #2016/11591-8 and #2013/07793-6) for financial support.References
- M. Yamane and Y. Asahara, Glasses for Photonics, Cambridge University Press, Port Chester, NY, 2000, ISBN 0521580536 Search PubMed.
- G. C. Righini and A. Chiappini, Opt. Eng., 2014, 53, 071819–071832 CrossRef.
- H. Fares, H. Elhouichet, B. Gelloz and M. Férid, J. Appl. Phys., 2014, 116, 123504–123513 CrossRef.
- H. Fares, W. Stambouli, H. Elhouichet, B. Gelloz and M. Férid, RSC Adv., 2016, 6, 31136–31145 RSC.
- V. K. Tikhomirov, T. Vosch, E. Fron, V. D. Rodríguez, J. J. Velázquez, D. Kirilenko, G. Van Tendeloo, J. Hofkens, M. Van der Auweraer and V. V. Moshchalkov, RSC Adv., 2012, 2, 1496–1501 RSC.
- Y. Ledemi, A.-A. Trudel, V. Rivera, S. Chenu, E. Veron, L. A. O. Nunes, M. Allix and Y. Messaddeq, J. Mater. Chem. C, 2014, 2, 5046–5056 RSC.
- A. S. Kuznetsov, V. K. Tikhomirov, M. V. Shestakov and V. V. Moshchalkov, Nanoscale, 2013, 5, 10065–10075 RSC.
- J. W. Chan, T. R. Huser, S. H. Risbud, J. S. Hayden and D. M. Krol, Appl. Phys. Lett., 2003, 82, 2371–2373 CrossRef CAS.
- N. Marquestaut, Y. Petit, A. Royon, T. Cardinal and L. Canioni, Adv. Funct. Mater., 2014, 24, 5824–5832 CrossRef CAS.
- J. M. P. Almeida, P. H. D. Ferreira, D. Manzani, M. Napoli, S. J. L. Ribeiro and C. R. Mendonca, J. Appl. Phys., 2014, 115, 193507–193512 CrossRef.
- C. B. Schaffer, A. Brodeur and E. Mazur, Meas. Sci. Technol., 2001, 12, 1784–1794 CrossRef CAS.
- D. M. Krol, J. Non-Cryst. Solids, 2008, 354, 416–424 CrossRef CAS.
- M. Eichelbaum and K. Rademann, Adv. Funct. Mater., 2009, 19, 2045–2052 CrossRef CAS.
- V. K. Tikhomirov, V. D. Rodríguez, A. Kuznetsov, D. Kirilenko, G. Van Tendeloo and V. V. Moshchalkov, Opt. Express, 2010, 18, 22032–22040 CrossRef CAS PubMed.
- X. Y. Liu, H. Guo, S. Ye, M. Y. Peng and Q. Y. Zhang, J. Mater. Chem. C, 2015, 3, 5183–5191 RSC.
- H. Fares, T. Castro, J. R. Orives, D. F. Franco and M. Nalin, RSC Adv., 2017, 7, 44356–44365 RSC.
- H. Lin, D. Chen, Y. Yu, R. Zhang and Y. Wang, Appl. Phys. Lett., 2013, 103, 091902–091905 CrossRef.
- H. X. Xu and K. S. Suslick, ACS Nano, 2010, 4, 3209–3214 CrossRef CAS PubMed.
- G. De Cremer, E. Coutiño-Gonzalez, M. B. J. Roeffaers, B. Moens, J. Ollevier, M. Van der Auweraer, R. Schoonheydt, P. A. Jacobs, F. C. De Schryver, J. Hofkens, D. E. De Vos, B. F. Sels and T. Vosch, J. Am. Chem. Soc., 2009, 131, 3049–3056 CrossRef CAS PubMed.
- I. Díez and R. H. A. Ras, Nanoscale, 2011, 3, 1963–1970 RSC.
- M. V. Shestakov, X. Chen, W. Baekelant, A. S. Kuznetsov, V. K. Tikhomirov, J. Hofkens and V. V. Moshchalkov, RSC Adv., 2014, 4, 20699–20703 RSC.
- R. Ma, J. Zhao, X. Chen, X. Qiao, X. Fan, J. Du and X. Zhang, Phys. Chem. Chem. Phys., 2017, 19, 22638–22645 RSC.
- A. S. Kuznetsov, V. K. Tikhomirov and V. V. Moshchalkov, Mater. Lett., 2013, 92, 4–6 CrossRef CAS.
- S. Sareen, V. Mutreja, S. Singh and B. Pal, RSC Adv., 2015, 5, 184–190 RSC.
- P. Kunwar, J. Hassinen, G. Bautista, R. H. A. Ras and J. Toivonen, ACS Nano, 2014, 8, 11165–11171 CrossRef CAS PubMed.
| This journal is © The Royal Society of Chemistry 2017 |

