 Open Access Article
Creative Commons Attribution 3.0 Unported Licence
Sequential solvent fractionation of lignin for selective production of monoaromatics by Ru catalyzed ethanolysis†
Jae-Young Kima,
Shin Young Parka,
Jae Hoon Leea,
In-Gyu Choiab and
Joon Weon Choi *c
*c
aDepartment of Forest Sciences, Research Institute for Agriculture and Life Science, Seoul National University, 599 Gwanak-ro, Gwanak-gu, Seoul, 151-921, Republic of Korea
bResearch Institute of Agriculture and Life Sciences, Seoul National University, Seoul 151-742, Republic of Korea
cGraduate School of International Agricultural Technology, Institute of Green-Bio Science and Technology, Seoul National University, Pyeongchang 232-916, Republic of Korea. E-mail: cjw@snu.ac.kr; Fax: +82-33-339-5689; Tel: +82-33-339-5840
First published on 17th November 2017
Abstract
The purpose of this study was to investigate the impact of lignin structure, especially its average molecular weight (Mw) on the distribution of catalytically depolymerized products. Soda lignin (SL) was sequentially fractionated by organic solvents (ethyl acetate: F1, methanol: F2, acetone: F3, dioxane/water: F4, and insoluble fraction: F5). The Mw of SL, F1, F2, F3, and F4 were 2800, 1120, 2860, 5850, and 7200 Da, while that of F5 could not be determined due to its low solubility in GPC solvent. 2D-HSQC-NMR analysis revealed that the relative abundance of the β-O-4 linkage increased upon increasing the Mw of the lignin fraction. Each fraction was efficiently depolymerized into lignin-oil under the combination of supercritical ethanol (350 °C) and Ru/C (5 wt%). The yield of lignin-oil, mixture of monoaromatic compounds, as well as high molecular phenolics, ranged from 62.5 to 81.4 wt%. The yield of total monoaromatic compounds in lignin-oil varied from ca. 3.4 to 10 wt% depending on the lignin fraction. The selectivity of monoaromatic compounds produced from the lignin depolymerization process was clearly affected by the Mw value of lignin. Specifically, F1 and F2 yielded higher amounts of non-alkylated phenols, methylated-, and ethylated phenols compared to the other lignin fractions.
1. Introduction
Lignin, the second most abundant polymeric material in nature next to cellulose, consists of three kinds of lignin monomer including p-coumaryl, coniferyl, and sinapyl alcohol with various C–O (β-O-4, α-O-4, and 4-O-5) and C–C bonds (β-β, biphenyl, and β-5). Interest in lignin valorization has increased in recent years, because only 2% of the 50 million tons of lignin produced from US pulping industries (2010) was used for high value products, whereas the rest was burned for power generation.1 This underutilization of lignin evokes the desire to develop methodologies that enable depolymerization of lignin into bio-based chemicals.2 However, given its structural complexity as a polymer and poor solubility in commonly used solvents, lignin was irregularly degraded into small molecular fragments during the depolymerization process, causing the formation of heterogeneous mixtures of alkylated and oxygenated phenols.3–5 For this reason, selective conversion of lignin into specific chemicals and fuels is still challenge in industrial biorefineries.Due to this need, the development of a catalytic conversion process that can selectively degrade C–O and C–C bonds for the production of a manageably uniform product has been mainly studied. Deuss et al. reported an acid-catalyzed depolymerization process that can effectively degrade the β-O-4 linkage in lignin by suppressing undesired side reactions.6 A solvent-free approach was developed by Kumar et al. for the depolymerization of kraft lignin to aromatic monomers using bimetallic sulfided NiMo and CoMo catalysts.7 Efficient hydrogenolysis of lignin under subcritical water was reported by Onwudili and Williams using Pd/C, resulting in the high conversion of lignin into an oil phase mainly composed of monoaromatic compounds.8 Supercritical alcohol has been also considered as a promising way for efficient lignin depolymerization.9–13 Recently, Huang developed one-step valorization of lignin to high yield monoaromatic compounds (23 wt%) without char formation under the combination of supercritical ethanol and CuMgAlOx catalyst.14
In addition to process approaches, recent developments in this field have highlighted the need to investigate the structural impact of lignin. Ye et al. reported that lignin species played an important role in yield of monoaromatic compounds.15 Also in our prior study, three kinds of technical lignins were depolymerized into alkylated phenols under supercritical t-butanol condition, which revealed that the yield, as well as type of monoaromatic compounds, was clearly affected by the lignin source.11 More recently, Bouxin et al., performed catalytic conversion of four lignins with different contents of β-O-4 linkages at 300 °C with methanol/water and Pt/Al2O3 catalyst.16 They described that the proportion of β-O-4 linkages is the critical factor for both the yield and type of the monoaromatic compounds produced. Although some attempts to investigate structural impact of lignin on depolymerization process have been explored, there have been few reports discussing the effect of lignin molecular weight (Mw) on this process. The Mw of lignin is one of the crucial factors determining the quality of valorized products (e.g. antioxidant, plastic, and carbon fiber).17–20 There exists only one prior study by Toledano et al. who investigated the effect of lignin Mw on the distribution of catalytically depolymerized products.21 They used ultrafiltration to separate lignin fractions with different Mw and each fraction was depolymerized by a hydrogen-free, mild, hydrogenolytic, heterogeneously catalyzed methodology assisted by microwave.
The objective of this study was to understand the yield and distribution of monoaromatic compounds in relation to lignin structure, especially the Mw of lignin. In the current study, lignin was sequentially fractionated by four kinds of organic solvents to obtain five lignin fractions with different molecular distributions. Separated fractions were structurally characterized by several analyses, and these were efficiently depolymerized into low molecular lignin-oil under the combination of supercritical ethanol (350 °C) and Ru/C catalyst. Lignin-oil from each fraction subjected to several analyses to characterize its physicochemical properties. Based on these results, the impact of lignin Mw on its suitability for conversion to fine chemicals was evaluated.
2. Materials and methods
2.1 Sequential solvent fractionation
Soda lignin (SL) produced from a mixture of wheat straw and sarkanda grass via the soda pulping process was purchased from Granit Research and Development SA. This lignin was sequentially fractionated by ethyl acetate, methanol, acetone, and dioxane/water (95 vol%), as modified from the method outlined in previous literature.22 10 g of lignin was dissolved in 100 ml of the first solvent (ethyl acetate), and then this mixture was agitated at room temperature for 2 h. The undissolved solid fraction was filtered using a funnel glass filter (2G4) under vacuum. The filtrate was subsequently evaporated under reduced pressure to remove most of the solvent, followed by suspension in water, and then freezing-drying to recover the lignin fraction (F1, ethyl acetate soluble). The undissolved lignin fractions were further extracted with methanol, acetone, and dioxane/water (95 vol%), and the recovered lignin fractions were noted as F2, F3, F4, and F5 (final insoluble fraction), respectively.2.2 Lignin characterization
The yield of each lignin fraction was determined gravimetrically. The weight percentages of carbon, hydrogen, and oxygen of the lignin fractions were determined using an elemental analyzer CHNS-932 from LECO Corp. The content of methoxyl (OMe) moieties was measured using a gas chromatographic method.23 To quantify the hydroxyl group (OH) content in the lignin fraction, 31P-NMR spectroscopy was performed.24 During sample preparation, 25 mg of each lignin fraction and its derived lignin-oil was phosphorylated by 70 μl of 2-chloro-4,4,5,5-tetramethyl-1,3,2-dioxaphospholane (TMDP). Cyclohexanol was used as an internal standard. This mixture was analyzed by a Bruker AVANCE 600 MHz instrument with an inverse-gated decoupling pulse sequence using a 45 degree pulse angle and 5.0 s relaxation delay. The resulting 31P-NMR spectra were integrated using the Bruker TopSpin 3.5 software.2D-HSQC-NMR were acquired with a Bruker AVANCE 600 spectrometer (Bruker, Germany) using 20 mg of lignin fraction dissolved in 0.75 ml DMSO-D6 employing a standard Bruker pulse sequence “hsqcetgpsisp2.2” with a 90° pulse, 0.08 s acquisition time, 2.0 s pulse delay, 1JC-H of 150 Hz, 48 scans, and an acquisition of 1024 data points (for 1H) over 512 increments (for 13C). The 1H and 13C pulse widths observed were p1 = 11.43 μs and p2 = 10.00 μs, respectively. HSQC data processing and plots were carried out using the MestReNova v10.0 software's default processing template with automatic phase and baseline correction. Two regions of interest were considered: (1) aliphatic oxygenated side chain region (δC/δH 50–90/2.5–5.9) and (2) aromatic/unsaturated region (δC/δH 100–140/5.5–8.0). The number of inter-unit linkages was quantified by using the signal intensity from from selected syringyl and guaiacyl peaks.25 We choose C2,6–H2,6 in H units (δC/δH 127.9/7.19), C2–H2 in G units (110.9/6.98), and C2,6–H2,6 in S units (103.8/6.71) signals as an internal standard. The amount of linkages, expressed as a number per 100 aromatic units, was calculated on the basis of correspond to each signal (β-O-4: δC/δH 71.9/4.9, β-5: δC/δH 87.7/5.5, and β-β: δC/δH 85.5/4.6).
The chemical compositions of lignin fractions were estimated according to the National Renewable Energy Laboratory (NREL) standard biomass analytical protocol.26
2.3 Lignin depolymerization in supercritical ethanol state
Each fractionated lignin was introduced into catalytic depolymerization process under supercritical ethanol according to the procedure of our earlier study.9 5 wt% ruthenium catalyst supported on activated carbon (Ru/C) catalyst was purchased from Sigma-Aldrich and used without further treatment. Briefly, 0.50 g of lignin sample and 20 ml of EtOH (ACS grade, ≥99.5%, Sigma-Aldrich) were loaded into the reactor with 0.025 g of Ru/C catalyst. Before reaction, sufficient nitrogen gas (99.9%) was flowed, and then 3 MPa of hydrogen gas (99.9%) was pressurized. The reactor was heated to 350 °C with an average heating rate of 13.2 °C min−1 and maintained at this temperature for 40 min. The maximum pressure in the reactor was approximately 17 MPa. After reaction, the reactor was rapidly quenched by ice-water with an average cooling rate of −32.2 °C min−1. Three lignin depolymerized products (lignin-oil, char, and gas) were recovered and the yield of them was calculated according to following equation:| Gas yield (wt%) = 100 − (lignin oil yield + char yield) |
2.4 Chemical properties of lignin-oil
![[thin space (1/6-em)]](https://www.rsc.org/images/entities/char_2009.gif) :
:![[thin space (1/6-em)]](https://www.rsc.org/images/entities/char_2009.gif) 15. In this system, the separated products were split equally (1
15. In this system, the separated products were split equally (1![[thin space (1/6-em)]](https://www.rsc.org/images/entities/char_2009.gif) :
:![[thin space (1/6-em)]](https://www.rsc.org/images/entities/char_2009.gif) 1) to (1) FID and (2) MS system. The initial oven temperature was set to 50 °C for 5 min, and then increased to 300 °C with a rate of 3 °C min−1. The final temperature was held for ten min. The injector and detector temperatures were 220 °C and 300 °C, respectively, and He (99.9% purity) was used as the carrier gas. The mass spectra of each compound were identified using NIST MS Search 2.0 (NIST/EPA/NIH Mass Spectral Library; NIST 02). 16 standard compounds were injected into the GC-FID to investigate a response factor (RF) between each standard compound and the internal standard.9 The yield of monoaromatic compounds was calculated by following equation:
1) to (1) FID and (2) MS system. The initial oven temperature was set to 50 °C for 5 min, and then increased to 300 °C with a rate of 3 °C min−1. The final temperature was held for ten min. The injector and detector temperatures were 220 °C and 300 °C, respectively, and He (99.9% purity) was used as the carrier gas. The mass spectra of each compound were identified using NIST MS Search 2.0 (NIST/EPA/NIH Mass Spectral Library; NIST 02). 16 standard compounds were injected into the GC-FID to investigate a response factor (RF) between each standard compound and the internal standard.9 The yield of monoaromatic compounds was calculated by following equation:![[thin space (1/6-em)]](https://www.rsc.org/images/entities/char_2009.gif) :
:![[thin space (1/6-em)]](https://www.rsc.org/images/entities/char_2009.gif) 1 v/v) at 105 °C for 2 h before GPC analysis. Approximately 2 mg of acetylated lignin and lignin-oil dissolved in tetrahydrofuran (1 mg ml−1) was introduced into a GPC max instrument (Viscotek RImax, Viscotek, UK) equipped with PLgel 3 μm MIXED-D columns (300 × 7.5 mm, VARIAN, Inc.), a PLgel 3 μm MIXED-E column (300 × 7.5 mm, VARIAN, Inc.), and a PLgel 5 μm guard column (50 × 7.5 mm, VARIAN, Inc.), while the effluent (0.7 ml min−1) was detected by UV-Vis detection (VE3210, Viscotek). 12 types of polystyrenes with different molecular weights ranging from 266 (styrene) to 66
1 v/v) at 105 °C for 2 h before GPC analysis. Approximately 2 mg of acetylated lignin and lignin-oil dissolved in tetrahydrofuran (1 mg ml−1) was introduced into a GPC max instrument (Viscotek RImax, Viscotek, UK) equipped with PLgel 3 μm MIXED-D columns (300 × 7.5 mm, VARIAN, Inc.), a PLgel 3 μm MIXED-E column (300 × 7.5 mm, VARIAN, Inc.), and a PLgel 5 μm guard column (50 × 7.5 mm, VARIAN, Inc.), while the effluent (0.7 ml min−1) was detected by UV-Vis detection (VE3210, Viscotek). 12 types of polystyrenes with different molecular weights ranging from 266 (styrene) to 66![[thin space (1/6-em)]](https://www.rsc.org/images/entities/char_2009.gif) 000 Da were used to calculate the average molecular weight (Mw) and the number average molecular weight (Mn) of analytes in the effluent. The depolymerization degree (%) of lignin-oil was calculated using the following equation:
000 Da were used to calculate the average molecular weight (Mw) and the number average molecular weight (Mn) of analytes in the effluent. The depolymerization degree (%) of lignin-oil was calculated using the following equation:3. Results and discussion
3.1 Chemical and structural characteristics of lignin fractions
SL was sequentially fractionated with four kinds of organic solvent with different solvation capacity. This approach is based on the solvation power of solvent, which is varied by both the cohesive energy and the hydrogen-bonding capacity of the solvent molecule.27 The yields of the five fractions were 22.0, 52.5, 4.6, 14.9, and 6.1 wt%, respectively (Table 1). The Mw as well as Mn of fractionated lignin was investigated by GPC, and the resulted curves are described in Fig. 1. SL had a multimodal molecular distribution with an overall Mw of 2800 Da and PDI of 2.8. After fractionation, each fraction had a relatively narrow PDI compared to SL. The Mw value and PDI of the lignin fraction increased from 1120 (F1) to 7200 Da (F4) and 1.8 (F1) to 2.3 (F4), respectively, as sequential extraction progressed, which was in agreement with previous works.22,28–30 Meanwhile, F5 was not totally dissolved in THF due to the presence of carbohydrate (30 wt%) and ash content (7.5 wt%). This is similar to the results from Wang et al. who reported that the purity of lignin determined by klason method decreased as fractionation step was progressed.29| Lignin | Yield (wt%) | Elemental composition (wt%) | OMe (mmol g−1) | OHb (mmol g−1) | ||||||
|---|---|---|---|---|---|---|---|---|---|---|
| C | H | N | Oa | Aliphatic | p-Hydroxyl (H) | Guaiacyl (G) | Syringyl (S) | |||
| a Calculated by difference.b Determined by 31P-NMR analysis. | ||||||||||
| SL | — | 62.7 | 5.8 | 0.4 | 31.1 | 3.77 | 1.13 | 0.28 | 0.75 | 0.74 |
| F1 | 22.0 ± 1.3 | 64.4 | 6.5 | — | 29.1 | 3.19 | 0.61 | 0.52 | 1.23 | 1.15 |
| F2 | 52.5 ± 1.6 | 63.0 | 5.8 | 0.5 | 30.7 | 3.55 | 1.27 | 0.40 | 0.98 | 0.88 |
| F3 | 4.6 ± 0.6 | 64.6 | 6.2 | 0.3 | 29.0 | 2.35 | 0.96 | 0.20 | 0.47 | 0.51 |
| F4 | 14.9 ± 1.8 | 59.0 | 5.6 | 1.0 | 34.4 | 2.58 | 0.81 | 0.12 | 0.32 | 0.39 |
| F5 | 6.1 ± 0.5 | 52.0 | 6.5 | 0.5 | 41.1 | 1.52 | — | — | — | — |
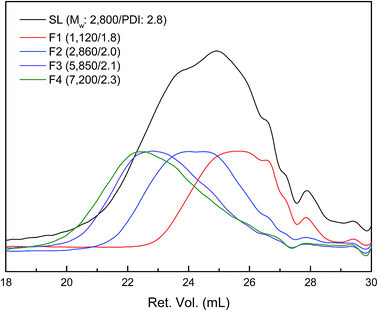 | ||
| Fig. 1 GPC curves of lignin fractions (the peak maxima were normalized to same value except for SL). | ||
Elemental composition and functional group content (OMe and OH) of the lignin fraction were quantitatively determined and shown in Table 1. As confirmed in Table 1, the carbon content of F5 was relatively lower than that of others (59.0 to 64.4 wt%) because F5 contained high carbohydrate (30 wt%) and ash content (7.5 wt%). With respect to functional groups in the lignin fraction, the content of phenolic OH including H, G, and S showed a decreasing trend with increasing Mw of the lignin fraction. However, the OMe content of the lignin fraction did not show a notable trend as a function of the Mw value. It is well known that a higher phenolic OH content in lignin resulted from more serious degradation of aryl-ether bond cleavage during the soda pulping process. Meanwhile, the content of aliphatic OH was the highest in F2, followed by F3, F4, and F1. The reason for this trend was unclear, but it might be related to the polarity index of solvents used in the extraction step (ethyl acetate: 4.4, methanol: 5.1, acetone: 5.1, and dioxane: 4.8).31
3.2 2D-HSQC-NMR analysis of lignin fractions
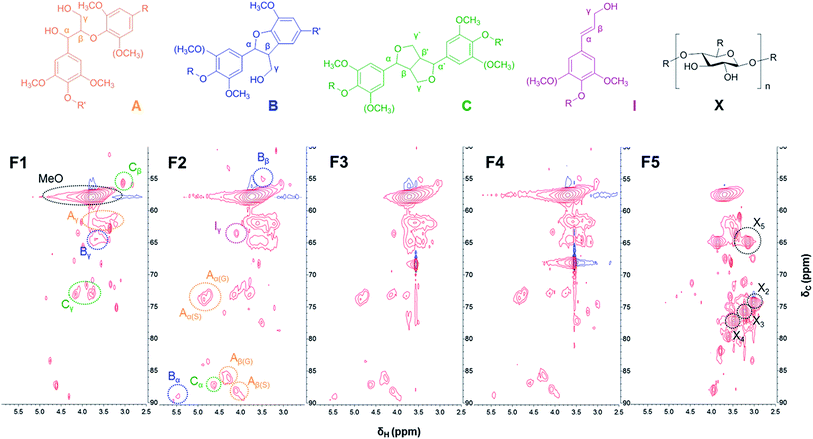
Further insight into the structural difference between lignin fractions was investigated by 2D-HSQC-NMR. Fig. 2 and 3 show the HSQC spectra of lignin fractions with the substructures corresponding to the assigned 13C–1H correlations.32,33 Recorded spectra in this study displayed representative interunit linkages such as the β-aryl-ether (A: β-O-4), phenylcoumaran (B: β-5), and resinol (C: β-β) structure in lignin fractions. In addition, not only H, G, and S units, but also ferulates and p-coumarates were detected because SL was extracted from herbaceous crops (wheat straw and sarkanda grass). As shown in Fig. 2, the correlation of the β-O-4 structure (A) in the spectra of F1 is much less intense than other samples, which indicates F1 had the highest condensed structure. Interestingly, the relatively high xylan content in F5 was confirmed at δC/δH 3.1/74.1, 3.3/75.9, and 3.5/77.2 ppm (black spot). This result is consistent with the result of above section.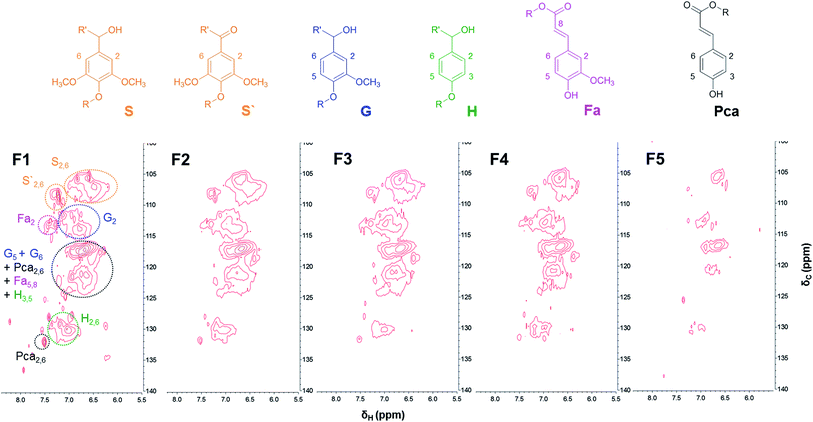 | ||
| Fig. 3 Aromatic/unsaturated (δC/δH 100–140/5.5–8.0) regions in the 2D-HSQC-NMR spectra of lignin fractions. | ||
The amount of interunit linkages in lignin fractions was quantified by integration of HSQC spectra with an aromatic unit as an internal standard; the result is given in Table 2.25 The relative abundance of β-O-4, β-5, and β-β of SL (per 100 aromatic units) was 6.1, 0.8, and 1.5, which were reasonable levels as compared with previous studies.32,33 2D-HSQC-NMR analysis was also used in previous work by Li et al. who reported that F2 (methanol soluble fraction) had the highest proportion of β-O-4 linkages. However, in this study, the amount of β-O-4 linkage gradually increased from 0 to 18.9 upon increasing the Mw of the lignin fraction as shown in Table 2, except for F5. This result correlated with those observations of phenolic OH content, as discussed above.
3.3 Yield of lignin depolymerized products
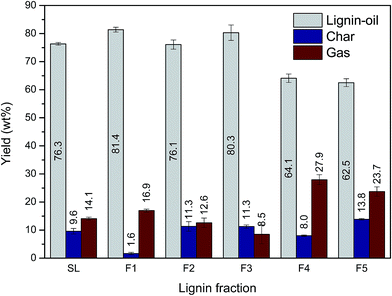
Each lignin fraction was depolymerized into low molecular lignin-oil under the combination of supercritical ethanol (350 °C) and 5 wt% Ru/C catalyst for 40 min. Before this reaction, 3 MPa hydrogen gas was pressurized into the reactor to stabilize or quench radicals, and unstable intermediates formed during the lignin depolymerization process.34 The yield of lignin-oil, mixture of monoaromatic compounds, as well as di-, tri- or higher molecular phenolics, ranged from 62.5 to 81.4 wt% (Fig. 4). Char and gas, mainly composed of H2, CH4, CO, and CO2, were produced as byproducts resulting from various side reactions, including carbonization, recondensation, and further decomposition of low molecular weight fragments in lignin-oil.9,11 Our experiment revealed that the distribution of depolymerized lignin products varied depending on the lignin fraction. In this study, the maximum lignin-oil yield (81.4 wt%) was achieved in F1 with the smallest amount of char (1.6 wt%). F3 gave rise to the second highest lignin-oil yield in spite of its relative high Mw. This meant that not only Mw but also other structural characteristics of lignin have influence on the distribution of depolymerized lignin products. Meanwhile, according to a previous study, char formation during lignin depolymerization has a negative effect on catalyst activity, because char deposits on catalyst surfaces give rise to catalyst deactivation.35 These results suggested that a lignin fraction having low Mw was advantageous for catalytic liquefaction processes.3.4 Chemical properties of lignin-oils
The yields of total and classified monoaromatic compounds in lignin-oil are presented in Fig. 6. As shown in Fig. 6(f), the yield of total monoaromatic compounds (mg g−1 of lignin) decreased from 100.3 (F1) to 69.6 (F4) upon increasing the Mw of the lignin fraction. These values were relatively higher than the results from Toledano et al. who reported that 2.00 to 6.58 (mg g−1 of lignin) of monoaromatic compounds could be obtained from different Mw of lignin fractions via nickel catalyzed hydrogen-free microwave irradiation at 150 °C.21 Meanwhile, F5 showed the lowest yield of total monoaromatic compounds, as well as lignin-oil, because it contained some contaminant as mentioned above. Several compounds derived from carbohydrate were observed in F5 lignin-oil, which is well in line with high carbohydrate content typically observed in F5 (Fig. S1†).
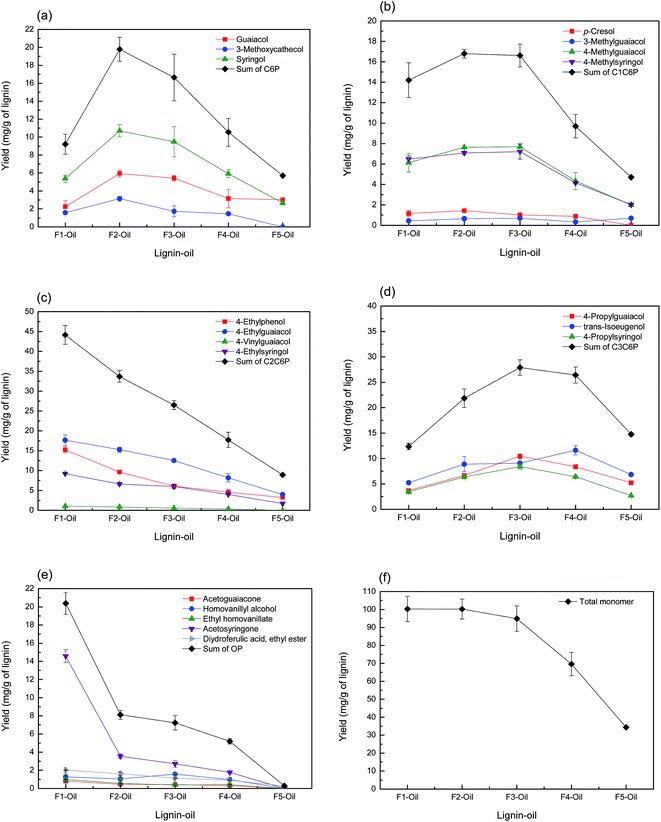 | ||
| Fig. 6 Yield of monoaromatic compounds ((a) C6P, (b) C1C6P, (c) C2C6P, (d) C3C6P, (e) OP and (f) total monomer) in lignin-oils as a function of lignin molecular weight. | ||
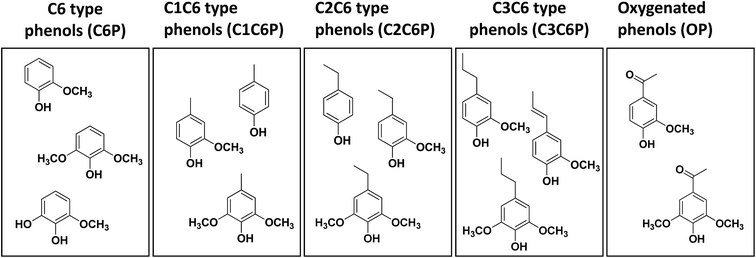
Fig. 6(a) and (b) display the yield of C6P and C1C6P compounds as a function of the Mw value of the lignin fraction. Guaiacol, methylated guaiacol, 3-methoxycatechol, syringol, and methylated syringol, mainly used as a precursor to chemical feedstocks and various flavorants were produced as main C6P and C1C6P compounds.36 The sum of C6P and C1C6P showed the highest yields in F2 (19.8 and 16.8 mg g−1 of lignin, respectively) followed by F3. On the other hand, the yield of C2C6P showed a different tendency (Fig. 6(c)). These C2C6P compounds, such as 4-ethylphenol, 4-ethylguaiacol, and 4-ethylsyringol, were potential chemical intermediates for the production of phenol, flavors, resins, polymers, medicines, and so on.37 Many prior studies reported that such compounds were mainly obtained from the thermochemical conversion process of native or technical lignin (e.g. hydrogenolysis, solvolysis, and pyrolysis).11,15,33,38–40 C2C6P compounds were possibly transformed from 4-vinylphenols, primary thermal degradation products from lignin, by selective hydrogenolysis of vinyl function.15,34,41 As confirmed in Fig. 6(c), the sum of C2C6P was the highest at F1 (44.2 mg g−1 of lignin) and decreased with increment of lignin fraction Mw. It was previously reported that non-alkylated phenols, methylated-, and ethylated phenols can result from the condensed fraction of lignin.16 The results of the current study are partially consistent with previous results. F1 and F2 with lower amounts of β-O-4 linkages yielded these compounds (C6P, C1C6P, and C2C6P) more than other lignin fractions.
The yield of C3C6P compounds is illustrated in Fig. 6(d). It has been previously revealed that C3C6P compounds from lignin such as 4-propylguaiacol, 4-propylsyringol, and trans-isoeugenol obtained was directly related to the amount of β-O-4 linkages in the starting lignin material.16,42 As mentioned above (2D-HSQC-NMR), the relative amount of β-O-4 linkages was the highest at F4 (18.9) followed by F3 (16.5) and F2 (7.9). However, the sum of C3C6P did not fully match as a function of the amount of β-O-4 linkages. This suggested that the yield of C3C6P compound from lignin depolymerization process was affected not only by the amount of β-O-4 linkages, but also other structural characteristics of lignin such as functional group contents and the Mw.
Meanwhile, as observed in Fig. 6(e), acetosyringone was the major product among OP compounds, and others, including acetoguaiacone, homovanillyl alcohol, and ethyl homovanillate, showed a low yield (<2 mg g−1 of lignin). Acetosyringone is specialized for the production of medicines such as non-steroidal anti-inflammatory drugs, anti-asthmatic, and non-narcotic analgesic.43 The yield of this compound was the highest at F1 (14.6 mg g−1 of lignin) and gradually decreased with increasing the Mw of lignin fraction. Sum of OP had a similar pattern of acetosyringone. This trend suggested that the lignin fraction with lower Mw value contained more OP-type monoaromatic compounds than higher Mw lignin fraction.
Our previous studies revealed that whole lignin (SL) had a low selectivity of each compound in lignin-oil due to its structural complexity,9,11 but the result of the current study suggested that the selectivity of monoaromatic compounds could be partly controlled by sequential fractionation of lignin before lignin depolymerization process.
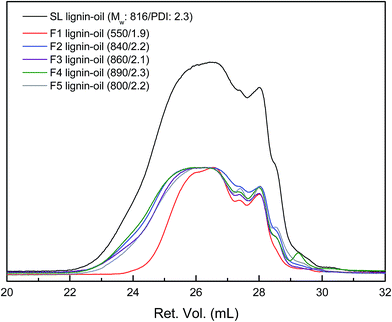 | ||
| Fig. 7 GPC curves of lignin-oils produced from each lignin fraction (the peak maxima were normalized to same value except for SL lignin-oil). | ||
| Lignin-oil | The Mw (Da)/PDI | The average Mw (Da)/PDI | Depolymerization degree (%) | |
|---|---|---|---|---|
| Before 28 ml | Near 28 ml | |||
| SL | 870/1.3 | 150/1.1 | 820/2.3 | 71 |
| F1 | 690/1.2 | 160/1.1 | 550/1.9 | 51 |
| F2 | 880/1.3 | 150/1.1 | 840/2.2 | 71 |
| F3 | 1120/1.3 | 150/1.1 | 860/2.1 | 85 |
| F4 | 1040/1.3 | 150/1.1 | 890/2.3 | 88 |
| F5 | 890/1.2 | 150/1.1 | 800/2.2 | — |
4. Conclusions
The lignin structure, especially the Mw, had a crucial impact on the yield and distribution of monoaromatic compounds produced after the catalytic depolymerization process. Lignin fractions with a relatively lower Mw value had lower amounts of β-O-4 linkages. These fractions yielded a relatively higher concentration of C6P, C1C6P, and C2C6P than other lignin fractions. In contrast, C3C6Ps were mainly produced in high Mw lignin fractions (F3 and F4). It can be envisioned from these results that pre-solvent fractionation of lignin will help in the selective production of specific monoaromatic compounds after the lignin depolymerization process. This study also investigated the chemical properties of lignin-oils from different lignin fractions, providing basic information for design of further application strategies.Conflicts of interest
There are no conflicts to declare.Acknowledgements
This study was supported by Korea Forest Service (Korea Forestry Promotion Institute) through ‘R&D Program for Forest Science Technology (Project No. 2017052A00-1720-BB02)’.References
- D. Stewart, Ind. Crop. Prod., 2008, 27, 202–207 CrossRef CAS.
- X. Sun, C. Huang, Z. Xue, C. Yan and T. Mu, Energy Fuels, 2015, 29, 2564–2570 CrossRef CAS.
- J. Zakzeski, P. C. Bruijnincx, A. L. Jongerius and B. M. Weckhuysen, Chem. Rev., 2010, 110, 3552–3599 CrossRef CAS PubMed.
- A. J. Ragauskas, G. T. Beckham, M. J. Biddy, R. Chandra, F. Chen, M. F. Davis, B. H. Davison, R. A. Dixon, P. Gilna and M. Keller, Science, 2014, 344, 1246843 CrossRef PubMed.
- Z. Xue, X. Zhao, R.-c. Sun and T. Mu, ACS Sustainable Chem. Eng., 2016, 4, 3864–3870 CrossRef CAS.
- P. J. Deuss, M. Scott, F. Tran, N. J. Westwood, J. G. de Vries and K. Barta, J. Am. Chem. Soc., 2015, 137, 7456–7467 CrossRef CAS PubMed.
- C. R. Kumar, N. Anand, A. Kloekhorst, C. Cannilla, G. Bonura, F. Frusteri, K. Barta and H. J. Heeres, Green Chem., 2015, 17, 4921–4930 RSC.
- J. A. Onwudili and P. T. Williams, Green Chem., 2014, 16, 4740–4748 RSC.
- J.-Y. Kim, J. Park, U.-J. Kim and J. W. Choi, Energy Fuels, 2015, 29, 5154–5163 CrossRef CAS.
- J.-Y. Kim, S. Oh, H. Hwang, T.-s. Cho, I.-G. Choi and J. W. Choi, Chemosphere, 2013, 93, 1755–1764 CrossRef CAS PubMed.
- J.-Y. Kim, J. Park, H. Hwang, J. K. Kim, I. K. Song and J. W. Choi, J. Anal. Appl. Pyrolysis, 2015, 113, 99–106 CrossRef CAS.
- K. Barta, T. D. Matson, M. L. Fettig, S. L. Scott, A. V. Iretskii and P. C. Ford, Green Chem., 2010, 12, 1640–1647 RSC.
- A. Narani, R. K. Chowdari, C. Cannilla, G. Bonura, F. Frusteri, H. J. Heeres and K. Barta, Green Chem., 2015, 17, 5046–5057 RSC.
- X. Huang, T. I. Korányi, M. D. Boot and E. J. Hensen, ChemSusChem, 2014, 7, 2276–2288 CrossRef CAS PubMed.
- Y. Ye, Y. Zhang, J. Fan and J. Chang, Bioresour. Technol., 2012, 118, 648–651 CrossRef CAS PubMed.
- F. P. Bouxin, A. McVeigh, F. Tran, N. J. Westwood, M. C. Jarvis and S. D. Jackson, Green Chem., 2015, 17, 1235–1242 RSC.
- X. Pan, J. F. Kadla, K. Ehara, N. Gilkes and J. N. Saddler, J. Agric. Food Chem., 2006, 54, 5806–5813 CrossRef CAS PubMed.
- X. Dong, M. Dong, Y. Lu, A. Turley, T. Jin and C. Wu, Ind. Crops Prod., 2011, 34, 1629–1634 CrossRef CAS.
- H. Yoshida, R. Mörck, K. P. Kringstad and H. Hatakeyama, J. Appl. Polym. Sci., 1990, 40, 1819–1832 CrossRef CAS.
- K. Sudo and K. Shimizu, J. Appl. Polym. Sci., 1992, 44, 127–134 CrossRef CAS.
- A. Toledano, L. Serrano, A. M. Balu, R. Luque, A. Pineda and J. Labidi, ChemSusChem, 2013, 6, 529–536 CrossRef CAS PubMed.
- M.-F. Li, S.-N. Sun, F. Xu and R.-C. Sun, Separ. Purif. Technol., 2012, 101, 18–25 CrossRef CAS.
- S. Baker, Holzforschung, 1996, 50, 573–574 CAS.
- Y. Pu, S. Cao and A. J. Ragauskas, Energy Environ. Sci., 2011, 4, 3154–3166 CAS.
- J.-L. Wen, S.-L. Sun, B.-L. Xue and R.-C. Sun, Materials, 2013, 6, 359–391 CrossRef CAS PubMed.
- A. Sluiter, B. Hames, R. Ruiz, C. Scarlata, J. Sluiter, D. Templeton and D. Crocker, Laboratory Analytical Procedure, 2008 Search PubMed.
- C. Schuerch, J. Am. Chem. Soc., 1952, 74, 5061–5067 CrossRef CAS.
- A. Arshanitsa, J. Ponomarenko, T. Dizhbite, A. Andersone, R. J. Gosselink, J. van der Putten, M. Lauberts and G. Telysheva, J. Anal. Appl. Pyrolysis, 2013, 103, 78–85 CrossRef CAS.
- G. Wang and H. Chen, Sep. Purif. Technol., 2013, 120, 402–409 CrossRef CAS.
- T.-Q. Yuan, J. He, F. Xu and R.-C. Sun, Polym. Degrad. Stab., 2009, 94, 1142–1150 CrossRef CAS.
- M. N. Gupta, R. Batra, R. Tyagi and A. Sharma, Biotechnol. Prog., 1997, 13, 284–288 CrossRef CAS.
- Z. Strassberger, P. Prinsen, F. van der Klis, D. S. van Es, S. Tanase and G. Rothenberg, Green Chem., 2015, 17, 325–334 RSC.
- S. Constant, H. L. Wienk, A. E. Frissen, P. de Peinder, R. Boelens, D. S. Van Es, R. J. Grisel, B. M. Weckhuysen, W. J. Huijgen and R. J. Gosselink, Green Chem., 2016, 18, 2651–2665 RSC.
- K. H. Kim, R. C. Brown, M. Kieffer and X. Bai, Energy Fuels, 2014, 28, 6429–6437 CrossRef CAS.
- M. Saidi, F. Samimi, D. Karimipourfard, T. Nimmanwudipong, B. C. Gates and M. R. Rahimpour, Energy Environ. Sci., 2014, 7, 103–129 CAS.
- J. N. Murwanashyaka, H. Pakdel and C. Roy, Sep. Purif. Technol., 2001, 24, 155–165 CrossRef CAS.
- J. Das and A. B. Halgeri, Appl. Catal., A, 2000, 194, 359–363 CrossRef.
- Z. Jiang, T. He, J. Li and C. Hu, Green Chem., 2014, 16, 4257–4265 RSC.
- W. Xu, S. J. Miller, P. K. Agrawal and C. W. Jones, ChemSusChem, 2012, 5, 667–675 CrossRef CAS PubMed.
- B. Loubinoux, M. Heitz, G. Coudert and G. Guillaumet, Tetrahedron Lett., 1980, 21, 4991–4994 CrossRef CAS.
- P. R. Patwardhan, R. C. Brown and B. H. Shanks, ChemSusChem, 2011, 4, 1629–1636 CrossRef CAS PubMed.
- Q. Song, F. Wang, J. Cai, Y. Wang, J. Zhang, W. Yu and J. Xu, Energy Environ. Sci., 2013, 6, 994–1007 CAS.
- http://www.ebi.ac.uk/chebi/searchId.do?chebiId=CHEBI:2404.
- S. Cheng, C. Wilks, Z. Yuan, M. Leitch and C. C. Xu, Polym. Degrad. Stab., 2012, 97, 839–848 CrossRef CAS.
- Y. Jin, X. Ruan, X. Cheng and Q. Lü, Bioresour. Technol., 2011, 102, 3581–3583 CrossRef CAS PubMed.
- G. S. Macala, T. D. Matson, C. L. Johnson, R. S. Lewis, A. V. Iretskii and P. C. Ford, ChemSusChem, 2009, 2, 215–217 CrossRef CAS PubMed.
- M. Kleinert, J. R. Gasson and T. Barth, J. Anal. Appl. Pyrolysis, 2009, 85, 108–117 CrossRef CAS.
Footnote |
| † Electronic supplementary information (ESI) available. See DOI: 10.1039/c7ra11541e |
| This journal is © The Royal Society of Chemistry 2017 |


