 Open Access Article
An economic analysis of rice straw microwave pyrolysis for hydrogen-rich fuel gas
Xuhui Li a,
Kunquan Lia,
Chunlei Genga,
Hamed El Mashadb,
Hua Li*a and
Wenqing Yin*a
aCollege of Engineering, Nanjing Agricultural University, Nanjing, 210031 China. E-mail: lihua@njau.edu.cn; yinwq@njau.edu.cn
bDepartment of Biological and Agricultural Engineering, University of California, One Shields Avenue, Davis, CA 95616, USA
First published on 21st November 2017
Abstract
Rice straw is an abundant biomass resource, and it can produce hydrogen-rich fuel gas through microwave pyrolysis, so it has many potential applications. In this research, the combustion heat of gas per kilogram per kilowatt hour was used as one index to explore the influence of microwave power, moisture content and the length of feedstock. A multi-factor experiment was designed by using a Central Composite Design on Design-Expert 8.0 software. The results show that the gas calorific value increases with moisture content. However, the gas calorific value first increases and then decreases with an increase in microwave power and length. Ignoring the energy consumed during the preparation of the material, the most economic conditions for the production of gas are explored in this paper.
Introduction
As society develops, energy demand increases year by year, and the excessive use of fossil fuels is creating a series of problems such as global warming, sea level rises, acid rain, haze and the increased frequency of extreme weather events.1 Thus, it is inevitable that new clean energy sources are increasingly being sought. Because carbon emissions of biomass are considered to be zero, biomass energy is recognized as an environmentally-friendly energy.2,3 The global crop straw production yield is above 8 × 10⁹ tons per year, and in China this value is about 7 × 10⁸ tons per year. Furthermore, this value is continuing to rise.4 So, crop straw provides one form of renewable energy with wide distribution and excellent production of biomass. However, generally, the bulk density of biomass is quite low (800–900 kg m−3 for bitumite, 30–40 kg m−3 for rice straw, 110 kg m−3 for maize straw), and transportation costs are high for direct use, so conversion processes are needed to promote the biomass utilization value.5,6 Current research is focused on the use of pyrolysis methods to obtain more valuable products: biogas and bio-oil.7,8 Furthermore, biogas is a high value gas because it is hydrogen-rich. Biogas can be used for gas turbines, fuel cells, etc., and it can be burned to get heat. The combustion process of biogas is easy to control with low carbon emissions, and it does not produce particulate matter.In recent years, more and more scholars have paid attention to biomass microwave pyrolysis.9–11 Compared to traditional pyrolysis, microwave pyrolysis does not need an external heat source. Instead of heat conduction moving from the surface to the inside, microwave pyrolysis transfers heat to biomass through the heater method. It generates rapid and uniform heating. As compared to traditional pyrolysis, microwave pyrolysis is more energy-efficient and it produces more hydrogen.12 According to Huang's research, microwave pyrolysis rice straw can produce hydrogen-rich gas, with hydrogen content reaching 57%.13 In Lin's research, two different microwave pyrolysis systems were compared, and, for the hydrogen-rich gas, the highest hydrogen content was 56%, while the conversion rate of hydrogen was found to be 67.45%,14 which shows that using microwave to obtain hydrogen-rich fuel gas from pyrolysis rice straw is feasible and efficient. Shang et al. added different additives to sawdust to explore their influence on the pyrolysis process of sawdust.15 The results show that additives improved the heating rate, and during the pyrolysis process, additives mainly acted as catalysts. Based on our previous research, adding ZnCl2 to rice straw could raise hydrogen content in microwave pyrolysis gas.16 So, in this research, ZnCl2 (5%) was added to raw materials as an additive in order to improve efficiency.
Although in recent years microwave pyrolysis biomass has rapidly developed, there has been little research focused on the economic analysis of microwave pyrolysis. Hence, rice straw was used as raw material in this research in order to analyze its microwave pyrolysis products. Design-Expert 8.0 software was adapted to design the CCD test to study the effects of microwave power, water content, and material size on the heating value of gas phase products. We aimed to identify the most economic conditions to achieve the most efficient microwave pyrolysis.
Experimental section
Materials
The rice straw used in this study was the late-season rice straw in Nanjing area, Jiangsu, China. After natural drying (the moisture content was 6%), the rice straw was treated to the required size by using a pulverizer and scissors. Different moisture content gradients were realized by adding distilled water to the straw. 5% ZnCl2 was added to all experimental materials as additive. The amount of the samples used in each run was 35 ± 3 g.Experimental conditions
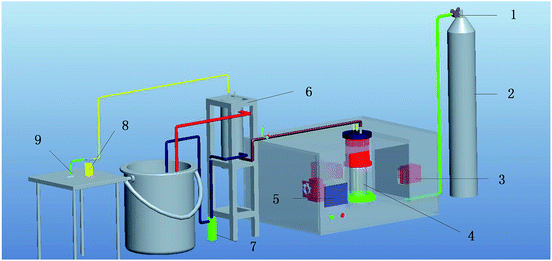
The microwave system used in this study was designed by our laboratory together with Nanjing Jinhaifeng Microwave Technology Ltd. The Agilent 7820A gas chromatography was adapted for real-time detection of produced gas (Fig. 1).Experimental method
High purity N2 (99.99%) was purged for over 10 minutes to completely expel the air in the microwave pyrolysis oven. The pyrolysis temperature was measured by thermocouple. Related parameters like pyrolysis temperature and microwave power were established according to the experimental design. Airtight syringes were used to transfer the microwave-assisted pyrolysis products into the gas chromatograph for gas analysis. As concentrations of hydrocarbons such as C2H4 and C2H6 are extremely low in the gaseous products of biomass pyrolysis,17 for the purpose of simplifying analysis, only CO, CO2, H2 and CH4 were focused on in this study and a value of 100% was assumed for their total volume percentage. Because gas production varied under different conditions, a new evaluation index, Q, was introduced in this study: the heat generated by the combustion of gas produced by one kilogram of raw materials which provided a kilowatt-hour of electricity during microwave pyrolysis. The formula is as follows:
 | (1) |
The determination method of microwave conversion efficiency: set the microwave pyrolysis system output power at 1 kW, 2 kW and 3 kW, set the run time as 30 minutes, then measure power consumption. The microwave conversion efficiency of this system was found to be 58%.
Because it is difficult to directly measure the gas yield, we calculated the gas yield by measuring solid and liquid products. The formula is as follows:
 | (2) |
Experimental results and conclusions
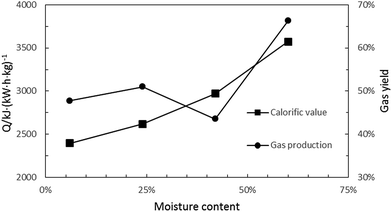
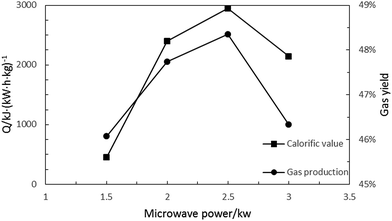
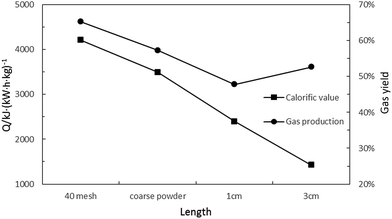
Single factor experiment analysis
Multi-factor experiment analysis
| Influence factor | −Alpha | +Alpha | Low | High |
|---|---|---|---|---|
| Microwave power A (kW) | 1.50 | 2.50 | 1.70 | 2.30 |
| Moisture content B (%) | 20.00 | 60.00 | 28.11 | 51.89 |
| Length C (cm) | 0.01 | 5.00 | 1.02 | 3.99 |
| Test number | Influence factor | Response | ||
|---|---|---|---|---|
| (A) Microwave power (kW) | (B) Moisture content (%) | (C) Length (cm) | Q (kJ (kW h kg)−1) | |
| 1 | 1.50 | 40.00 | 2.50 | 809.204 |
| 2 | 2.00 | 40.00 | 0.01 | 5409.45 |
| 3 | 2.50 | 40.00 | 2.50 | 2356.16 |
| 4 | 1.70 | 51.89 | 3.99 | 3492.5 |
| 5 | 2.30 | 28.11 | 3.99 | 3021.57 |
| 6 | 2.00 | 40.00 | 2.50 | 2524.23 |
| 7 | 2.00 | 40.00 | 2.50 | 3085.71 |
| 8 | 1.70 | 51.89 | 1.02 | 5722.98 |
| 9 | 2.30 | 51.89 | 3.99 | 5233.91 |
| 10 | 2.00 | 60.00 | 2.50 | 4616.8 |
| 11 | 2.00 | 40.00 | 2.50 | 3005.45 |
| 12 | 1.70 | 28.11 | 3.99 | 2195.54 |
| 13 | 2.00 | 40.00 | 2.50 | 3644.34 |
| 14 | 2.30 | 28.11 | 1.02 | 4254.16 |
| 15 | 2.00 | 20.00 | 2.50 | 2480.04 |
| 16 | 2.00 | 40.00 | 2.50 | 2826.78 |
| 17 | 2.00 | 40.00 | 5.00 | 2579.18 |
| 18 | 1.70 | 28.11 | 1.02 | 3675.73 |
| 19 | 2.00 | 40.00 | 2.50 | 2311.18 |
| 20 | 2.30 | 51.89 | 1.02 | 7026.31 |
| Q = 1198 + 7802A − 302B − 2079C + 58AB + 194AC − 9BC − 2218A2 + 3.5B2 + 298C2 | (3) |
| Q = 1200 + 8300A − 325B − 2100C + 58AB − 2300A2 + 3.5B2 + 300C2 | (4) |
The p-value of the fitting equation was 0.009, indicating the fit is good and the model is suitable (because the central composite design method tends to fit the central point, so it is quite normal to find distortions at some endpoints).
As can be seen in Fig. 5, microwave power and moisture content have beneficial effects on Q. With an increase in moisture content, the Q increased; but with an increase in microwave power, the Q decreased after rising, and the turning point was around 2.3 kW.
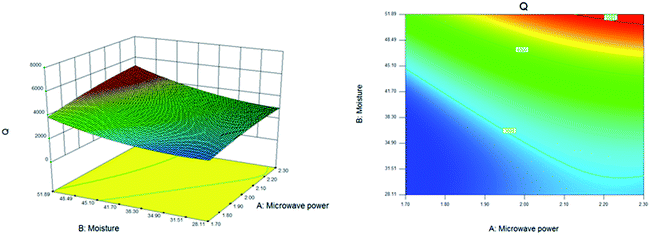 | ||
| Fig. 5 The response curves and contour lines of Q under different microwave power and moisture contents. | ||
As can be seen in Fig. 6, the moisture content showed an inhibitive and then a positive effect on Q. This is probably because when the moisture content increased, in addition to extending the residence time during the drying stage (85–105 °C), the content of combustibles in the gas product also increased, thus increasing the Q. With low moisture content, the increase of combustible content in the gas product was not obvious, but with high moisture content, a dramatic rise in combustible content could be observed; thus, the Q firstly decreased then increased as the moisture content increased. It is worth mentioning that the drop in gas calorific value was so little that, overall, it can be concluded that the Q increased as moisture content increased. This is consistent with the single factor experiment results and Fig. 5.
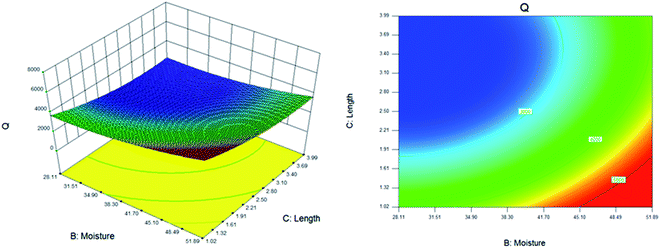 | ||
| Fig. 6 The response curves and contour lines of Q under different moisture contents and straw lengths. | ||
As can be seen in Fig. 6 and 7, the straw length showed an inhibitive and then a positive effect on Q. This is probably because the heating rates of small-size straw was higher than that of large-sized straw; thus, the small-sized straw had a higher efficiency than the large-sized straw. As the feed quantity of small-sized straw was higher than that of large-sized straw, the heating rate was lower for small-sized straw, thus reducing the pyrolysis efficiency. So the Q firstly decreased then increased as straw length increased.
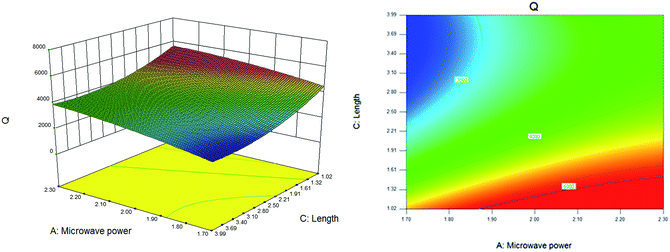 | ||
| Fig. 7 The response curves and contour lines of Q under different microwave power and straw lengths. | ||
Because of the limitations of experimental conditions, all materials were prepared by manual cutting, and the energy consumed during the preparation of materials could not be quantified, so the effect of straw length on energy consumption is not discussed in this study.
Model validation
By using the optimization function in Design-Expert 8, three factors were defined, with the goal being to maximize the gas calorific value. According to the results given by the software, the optimization parameters were microwave power A 2.04 kW, moisture content B 60%, straw length C 1.04 cm. Following these parameters, three repeated verification tests were done. The amount of the samples used in each run was 35 ± 0.01 g. The Experimental results are shown in Table 3.| Test no. | Q/kJ (kW h kg)−1 | AVG/kJ (kW h kg)−1 | SD/kJ (kW h kg) | Predicated value/kJ (kW h kg) |
|---|---|---|---|---|
| 1 | 6879.6 | 7394.1 | 365.3 | 6938.9 |
| 2 | 7720.8 | |||
| 3 | 7564 |
As can be seen in Table 3, the standard deviation (SD) was 365.3 kJ, which means the pyrolysis process was stable. The average was 7394.1 kJ, and, according to the model, the predicated value was 6938.9 kJ (error, 6.2%). The results suggest that the fit was good and the model was suitable.
Conclusions
The Q increased as moisture content increased; it first increased and then decreased with microwave power and length. Regarding microwave power, the maximum Q was reached at around 2.3 kW.The best data fit for Q as a function of microwave power, moisture content and straw length was:
| Q = 1200 + 8300A − 325B − 2100C + 58AB − 2300A2 + 3.5B2 + 300C2 |
Ignoring the energy consumed during the preparation of material, the most economic conditions to produce gas were as follows: microwave power 2.04 kW, moisture content B 60%, straw length C 1.04 cm, and the Q was 7394.1 kJ.
Conflicts of interest
There are no conflicts to declare.Acknowledgements
This study is financially supported by the Jiangsu Provincial Engineering Laboratory for Biomass Conversion and Process Integration Open Research Funded Projects (JPELBCPI2015002).References
- F. Motasemi and M. T. Afzal, Renewable Sustainable Energy Rev., 2013, 28, 317–330 CrossRef CAS.
- Y. Huang, P. Chiueh and S. Lo, Sustainable Environ. Res., 2016, 26, 103–109 CrossRef.
- Y. Fernández and J. A. Menéndez, J. Anal. Appl. Pyrolysis, 2011, 91, 316–322 CrossRef.
- M. Guangying, Z. Wenju, X. Qinghua and Z. Xinwei, China Herbivore Sci., 2014, 34, 24–27 Search PubMed.
- G. P. Maitan-Alfenas, E. M. Visser and V. M. Guimarães, Curr. Opin. Food Sci., 2015, 1, 44–49 CrossRef.
- M. Makela, V. Benavente and A. Fullana, Appl. Energy, 2015, 155, 576–584 CrossRef.
- D. Beneroso, J. M. Bermúdez, A. Arenillas and J. A. Menéndez, Bioresour. Technol., 2013, 144, 240–246 CrossRef CAS PubMed.
- J. E. Omoriyekomwan, A. Tahmasebi and J. Yu, Bioresour. Technol., 2016, 207, 188–196 CrossRef CAS PubMed.
- X. Zhao, W. Wang, H. Liu, C. Ma and Z. Song, Bioresour. Technol., 2014, 158, 278–285 CrossRef CAS PubMed.
- R. Zhou, H. Lei and J. Julson, J. Anal. Appl. Pyrolysis, 2013, 101, 172–176 CrossRef CAS.
- P. Shuttleworth, V. Budarin, M. Gronnow, J. H. Clark and R. Luque, J. Nat. Gas Chem., 2012, 21, 270–274 CrossRef CAS.
- Y. Huang, P. Chiueh, W. Kuan and S. Lo, Bioresour. Technol., 2013, 142, 620–624 CrossRef CAS PubMed.
- Y. F. Huang, W. H. Kuan, S. L. Lo and C. F. Lin, Bioresour. Technol., 2008, 99, 8252–8258 CrossRef CAS PubMed.
- Y. Lin, T. Wu, W. Liu and Y. Hsiao, Fuel, 2014, 119, 21–26 CrossRef CAS.
- H. Shang, R. Lu, L. Shang and W. Zhang, Fuel Process. Technol., 2015, 131, 167–174 CrossRef CAS.
- H. Li, X. Li, L. Liu, K. Li, X. Wang and H. Li, Int. J. Hydrogen Energy, 2016, 41, 2263–2267 CrossRef.
- Y. F. Huang, W. H. Kuan, S. L. Lo and C. F. Lin, Bioresour. Technol., 2010, 101, 1968–1973 CrossRef CAS PubMed.
| This journal is © The Royal Society of Chemistry 2017 |

