
 Open Access Article
 This Open Access Article is licensed under a
 Creative Commons Attribution 3.0 Unported Licence
Controllable growth of Na2CO3 fibers for mesoporous activated alumina ball modification towards the high-efficiency adsorption of HCl gas at low temperature
Shuoyang Lianga,
Zhengyun Fanb,
Weidong Zhangb,
Min Guoa,
Fangqin Chengc and
Mei Zhang *ac
*ac
aSchool of Metallurgical and Ecological Engineering, University of Science and Technology Beijing, Beijing 100083, China. E-mail: zhangmei@ustb.edu.cn; Fax: +86 10 62334926
bInstitute of Technology of Shougang Group, Beijing 100043, China
cShanxi Collaborative Innovation Center of High Value-added Utilization of Coal-related Wastes in Shanxi University, China
First published on 20th November 2017
Abstract
To fundamentally solve the problem of chlorine corrosion in blast furnace gas (BFG) systems, a supported adsorbent is used for HCl removal at low temperature. In this paper, three alkaline substances, Ca(OH)2, NaOH, and Na2CO3, were separately coated on the surface of activated alumina balls (AABs) by wetness impregnation method, using the as-active components. These materials were measured by XRF, XRD, SEM, TEM, and N2 adsorption to characterize textural properties. The modification experiments indicated that Na2CO3 fibers can be obtained on the surface of AABs by adjusting the loading amounts, impregnation time, and drying conditions. The fibers' structure contributes to the gas phase diffusion in the product layer, greatly improving the conversion of Na2CO3 (>0.98). The highest value of HCl adsorption capacity reaches 3.56 mmol g−1 when the Na2CO3 loading amount is 20 wt%, five times the adsorption capacity of pure AABs. The kinetics of HCl removal by the Na2CO3 fiber-modified AABs is controlled by the interfacial chemical reaction.
1. Introduction
It has been widely accepted that blast furnace gas (BFG) is a reusable derivative energy source due to the large heat and high pressure in the process of blast furnace production.1 In the process of recycling the blast furnace gas, the dry-dedusting process is adopted to make the gas purification efficient. However, serious corrosion has appeared in the BFG pipeline in the short term—a large amount of salt blocks the Blast Furnace Top Gas Recovery Turbine Unit (TRT), and even the refractory bricks in the hot blast stove have been partially broken.2 According to the reports, hydrogen chloride (HCl) in the gas stream is the only explanation for equipment corrosion.2,3 Normally, the temperature of BFG is in the range of 380–423 K. BFG steam consists of 23% CO, 20% CO2, 55% N2, and a small amount of methane; simultaneously, there is about 300 ppm hydrogen chloride (HCl). Although the content of HCl in the BFG is very small, the blast furnace still generates a heavy chlorine burden attributed to the large amount of blast furnace gas production. For example, a 2650 m3 BF produces 8 million m3 of BFG per day, containing about 3 tons of HCl, which is a huge threat to the gas pipeline and hot blast stove. Therefore, finding an effective adsorption material to remove HCl from the BFG is urgently necessary.At present, more studies have paid attention to the removal of acid gases from the hot flue gas (673–1073 K) of the coal industry.4–11 The reaction mechanism mainly depends on the neutralization of acid and alkali to capture acid gas in the process of gas stream cleaning. Duo et al.5,12 reported that the higher HCl capacity of sorbents correspond to the higher temperature from 573 to 873 K. Na sorbents showed optimal HCl sorption performance in the temperature range of 673–773 K. Dou et al.13,14 found that Na2CO3, Ca(OH)2, or CaO were suitable to achieving the tolerance limit of 1 ppmv HCl from hot gas. The experimental results showed that the HCl capacity of alkali materials at 473 K is less than 20% (3.5 mmol HCl g−1) of that at 773 K, suggesting that the chemical reaction of adsorbents is limited at low temperature.15 Besides, with poor structure, the conversion of the active materials is less than 50%,16 which undoubtedly increases the cost of dechlorination.
Mesoporous materials such as activated carbon (AC), activated alumina balls (AABs), molecular sieves, etc. have been developed as potential adsorbents or catalyst supports for the removal of acidic gases due to their large surface area and abundant porous structure.17–21 Taguchi et al.22–24 pointed out that the reaction mechanism of gas on the surface of these porous materials relies on physical adsorption, which contributes to regeneration and recycling. ZnO supported by 3-D structural mesoporous molecular sieves had been synthesized for H2S removal from gas stream, reported by Li,25 suggesting that the mesoporous structure benefited the dispersion of active phase. Among them, activated alumina balls (AABs) are well known as a potential carrier material for the adsorption of acid gases at low temperature due to their receptivity to modification with alkaline substances.26–29
For gases at room temperature, alkaline substances are usually used as active materials, supported by impregnation method, to remove acid gas for feeding molten carbonate fuel cells (MCFCs).30–33 Lee34 showed that the HCl capacity of NaOH/AC is about 6 times that of commercial alumina. However, Micoli et al.35,36 investigated the HCl adsorption performance of activated carbon impregnated with KOH, NaOH or Na2CO3, respectively. They suggested that the best adsorption performance for HCl adsorption was obtained by impregnating Na2CO3. Due to temperature limits, the chlorine capacity of the sorbent was lower than 0.4 mmol HCl g−1. Zhao et al.37–39 suggested that K2CO3/Al2O3 and Na2CO3/Al2O3 had the potential to be employed as excellent sorbents for CO2 uptake due to their rapid reaction rate and high CO2 capture capacities. Zhao40 investigated the effect of Na2CO3 loading on the adsorption capacity of the acid gases, which reached a maximum at the dispersion threshold. The paper of Dong41 showed that there was a change of surface structure after the modification of γ-Al2O3 with Na2CO3, unfortunately without any further analysis. It is worth mentioning that the change of HCl concentration in mixed gas has little effect on the adsorption capacity in the adsorption test.5,34 Therefore, many experiments to simulate the removal of HCl from gas tend to adopt an accelerated aging test with high HCl concentration.
In general, there is a lack of literature on HCl removal from BFG in the steel industry for its extreme conditions, namely, selective removal of HCl at the lower temperature of 380–423 K. For the purpose of environmental protection and energy recovery, the importance of HCl removal from blast furnace gas is self-evident. In this work, three modifiers, Na2CO3, Ca(OH)2 and NaOH, were coated on AABs by impregnation method. The structure properties of the initial, impregnated and exhausted materials have been characterized. The adsorption activity of the prepared materials had been measured using the accelerated aging test with a HCl concentration of 50% at the low temperature of 423 K; accordingly, the reaction mechanism of HCl and sorbents are also proposed.
2. Experimental
2.1 Materials
Commercial activated alumina balls (AABs) were purchased from Shandong province in China without further purification. Calcium hydroxide (Ca(OH)2), sodium carbonate anhydrous (Na2CO3), and sodium hydroxide (NaOH) were analytical grade and used as received without further purification. The basic physical properties of AABs are shown in Table 1.| Properties | Particle size (mm) | SBET (m2 g−1) | Pore volume (cm3 g−1) | Pore size (nm) |
|---|---|---|---|---|
| Parameter | 4–8 | 160 | 0.45 | 9.74 |
2.2 Preparation of modified sorbents
The modified sorbents in this study were prepared by the impregnation method. The preparation process consisted of two stages, namely, the selection of modifiers and optimization of impregnating conditions.| Modifier | Factors | Parameters |
|---|---|---|
| Na2CO3 | Loading amounts | 5%, 15%, 20% 25% |
| Impregnation time | 2 h, 10 h, 17 h, 24 h | |
| Drying time | 16 h, 20 h, 24 h, 28 h |
2.3 Activity test of HCl removal
After the preparation of modified sorbent loaded with Na2CO3, its HCl removal activity was subsequently tested in a fixed bed reactor with the reaction temperature of 423 K under normal atmosphere. The experimental apparatus is shown in Fig. 1. The sorbents were firstly treated at 423 K for 0.5 h in N2 flow (20 mL min−1) before the test. High-purity HCl and N2, whose flow rates were similarly controlled by mass flow meters at 20 mL min−1, were mixed to pass through the sorbents (about 23 g) in the heating furnace. Because the work temperature of BFG is in the range of 380–423 K, the experimental temperature for HCl adsorption was controlled at 423 K to simulate the real temperature of BFG. Afterwards, the escaped HCl was absorbed by 1 L deionized water in the adsorption bottle, and the concentration Ct of HCl in the outlet gas at that moment was ascertained synchronously by detecting the change of the pH value in the adsorption solution.35,36,42 Finally, the gas stream flowed through the treatment bottle, ensuring no pollution to the environment before the vent. | ||
| Fig. 1 Schematic diagram of the experimental apparatus: 1-N2 cylinder, 2-HCl cylinder, 3-sorbents, 4-adsorption bottle, 5-pH electrode, 6-pH meter, 7-computer, 8-treatment bottle. | ||
The test was stopped immediately when the pH value decreased sharply in the adsorption bottle; this moment was named the breakthrough time tb. The exhausted sorbents were taken out of the reactor and desorbed in the deionized water, and the concentration Ce of chloride ion in the desorption solution was determined by a chloride ion concentration meter.
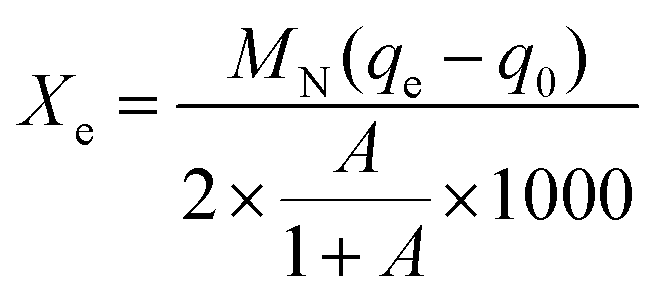
The HCl adsorption capacity qe (mmol g−1) of the exhausted sorbents can be calculated from the following eqn (1):
 | (1) |
The adsorption efficiency η of the sorbents at every moment can be calculated using the following eqn (2):
 | (2) |
2.4 Characterizations
The actual loading amounts of Na2CO3 supported on the sorbents were determined by X-ray fluorescence spectrometer (XRF-1800, Japan). The field emission scanning electron microscope (FESEM) (Zeiss supra 55), operated at 10 kV, coupled with energy dispersive X-ray analysis (EDS) was used to investigate the morphologies and element distribution of sorbent nanostructures. The X-ray diffraction (XRD) analysis, carried out on a powder X-ray diffractometer (Rigaku Dmax-2500 diffractometer using Cu Kα radiation), was used to determine the phase composition of the sorbents. Further structural characterization of the Na2CO3 fibers coated on the AABs substrate was performed by applying high-resolution transmission electron microscopy (HRTEM, Tecnai F20) operated at 200 kV. Surface area measurements were carried out by N2 adsorption at 77 K using a Micromeritics ASAP2020 instrument. The pH value of the adsorption solution was monitored by pH electrode 201T-M connected to the pH meter (MP520, Shanghai, San-Xin). The chloride ion concentration in the HCl desorption solution was measured by chloride ion – selective electrode CL502 connected concentration meter (MP523, Shanghai, San-Xin).3. Results and discussion
3.1 Preparation of the alkaline modified sorbents
| Samples | AAB | Ca(OH)2-AAB | 10NaOH-AAB | 10Na2CO3-AAB |
| Designed loading amount (wt%) | — | 0.34 | 10 | 10 |
| Loading amount (wt%) | — | 5 | 98 | 98 |
| SBET (m2 g−1) | 160 | 125 | 105 | 144 |
| Pore volume (cm3 g−1) | 0.45 | 0.51 | 0.40 | 0.51 |
| Pore diameter (nm) | 9.74 | 6.59 | 9.32 | 7.9 |
The XRD patterns of the modified samples are shown in Fig. 2. It depicts that sample Ca(OH)2-AAB shows corresponding characteristic peaks of the substrate, whereas sample 10NaOH-AAB shows trace peaks of NaAlO2 compared with the obvious peaks of Na2CO3 phase in sample 10Na2CO3-AAB besides the substrate, suggesting that a complex reaction between NaOH and the AAB substrate has occurred.
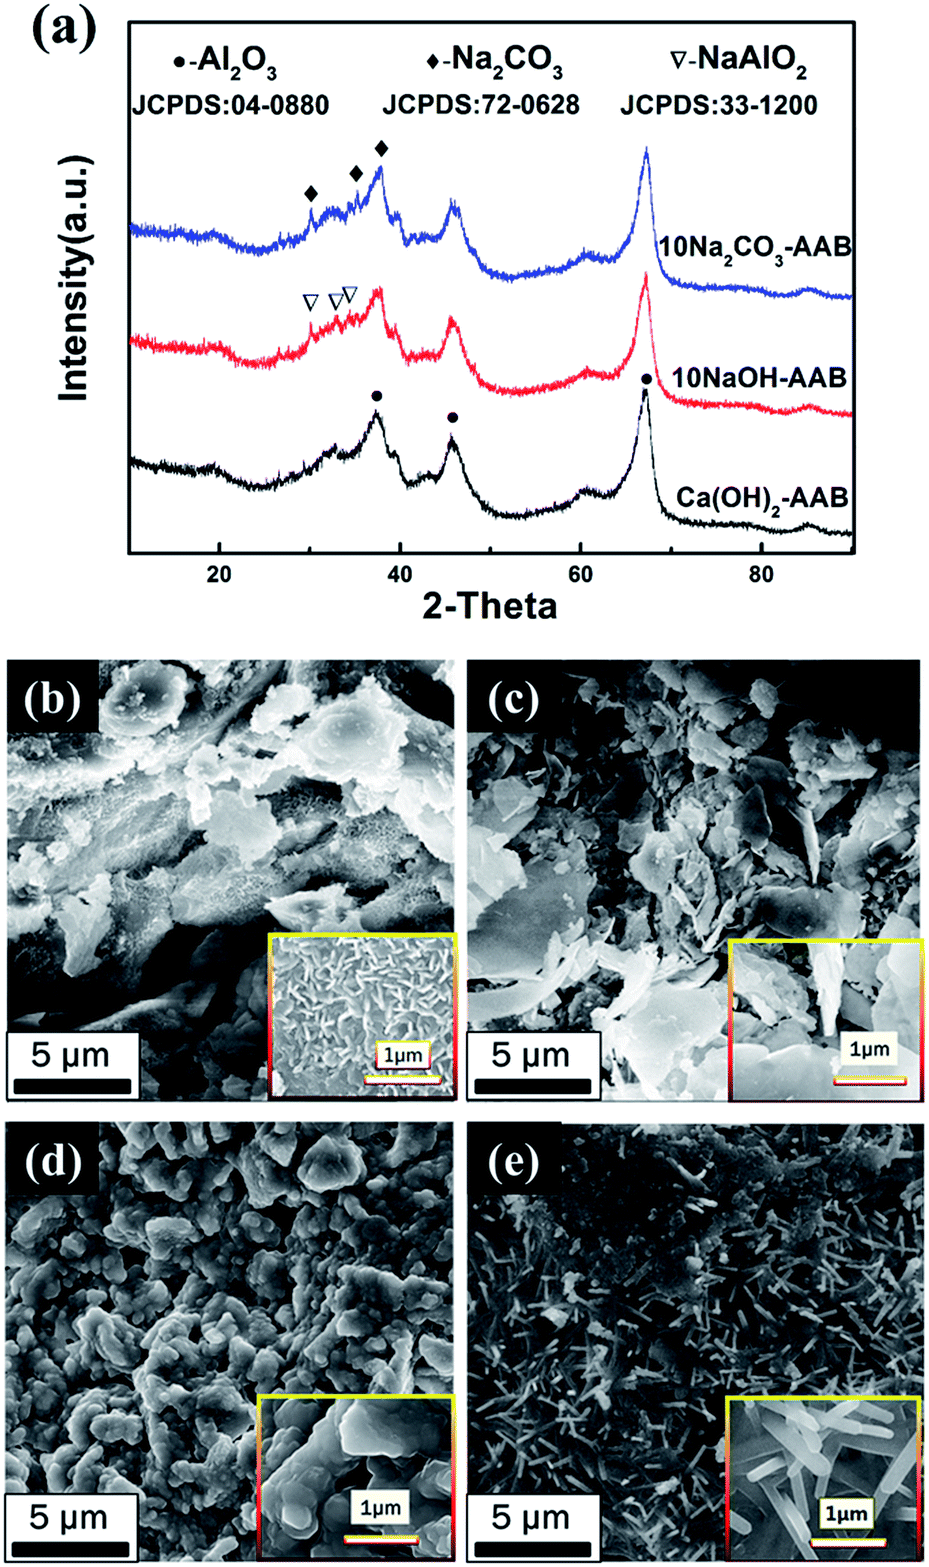 | ||
| Fig. 2 (a) XRD patterns of the modified sorbents with different alkaline substances. The SEM images of the untreated and modified sorbents: (b) AABs, (c) Ca(OH)2-AAB, (d) 10NaOH-AAB and (e) 10Na2CO3-AAB. | ||
The SEM images of the untreated and modified AABs with alkaline substances are shown in Fig. 2(b–e). From Fig. 2(b), it can be seen that there were a large number of fluffy structures on the surface of the original AABs, which makes its specific surface area large and benefits the alkaline adsorption. The modification of Ca(OH)2 as presented in Fig. 2(c) generates some lamellar structures in the AABs. However, the modification of NaOH deteriorates the surface morphology of alumina balls; namely, the pores in the AABs are almost blocked (Fig. 2(d)). The microscopic morphology of sorbent 10Na2CO3-AAB is shown in Fig. 2(e); a layer of fibrous network coats the surface of AABs, indicating that the Na2CO3 fibers on the support help to preserve its high surface area. Considering the surface morphology and physical properties of the sorbent after modification, Na2CO3 has been selected as the optimal modifier.
 | ||
| Fig. 3 (a) The curve of actual loading amount against the designed loading amount and (b) XRD patterns of the modified sorbents with different loading amounts: 0–25 wt%. | ||
Moreover, the actual loading capacities are almost accorded to the concentration of Na2CO3 solution when it is lower than 25 wt%, indicating that the loading amount of Na2CO3 in the sorbents reached saturation herein. Therefore, the loading amounts ranging from 5 wt% to 25 wt% is suitable for further investigation.
The XRD patterns of different loading amounts are shown in Fig. 3(b). When the loading amount reaches 10 wt%, the slight characteristic peaks of Na2CO3 can be detected in the XRD patterns. When the loading amount increases to 15 wt% and even higher, the characteristic peaks of Na2CO3 are obvious. There is no new phase formation in the entire process, indicating that no chemical reaction happened between Na2CO3 and AABs. The BET results of the samples with different loading amounts are listed in Table 4. It shows that the specific surface area of the sorbent decreases first and then increases with the increasing loading amounts, and reaches the highest value of 150 m2 g−1 when loading amount is 15 wt%. The specific surface area of the sorbent obviously reduces when the loading amount is further increased to 25 wt%, suggesting that there must be a great change in AAB microstructure.
| Loading amount (wt%) | Surface area (m2 g−1) | Pore volume (cm3 g−1) | Pore diameter (nm) |
|---|---|---|---|
| 5 | 125 | 0.48 | 7.6 |
| 10 | 144 | 0.51 | 7.9 |
| 15 | 150 | 0.45 | 5.65 |
| 20 | 145 | 0.45 | 7.8 |
| 25 | 134 | 0.42 | 6.6 |
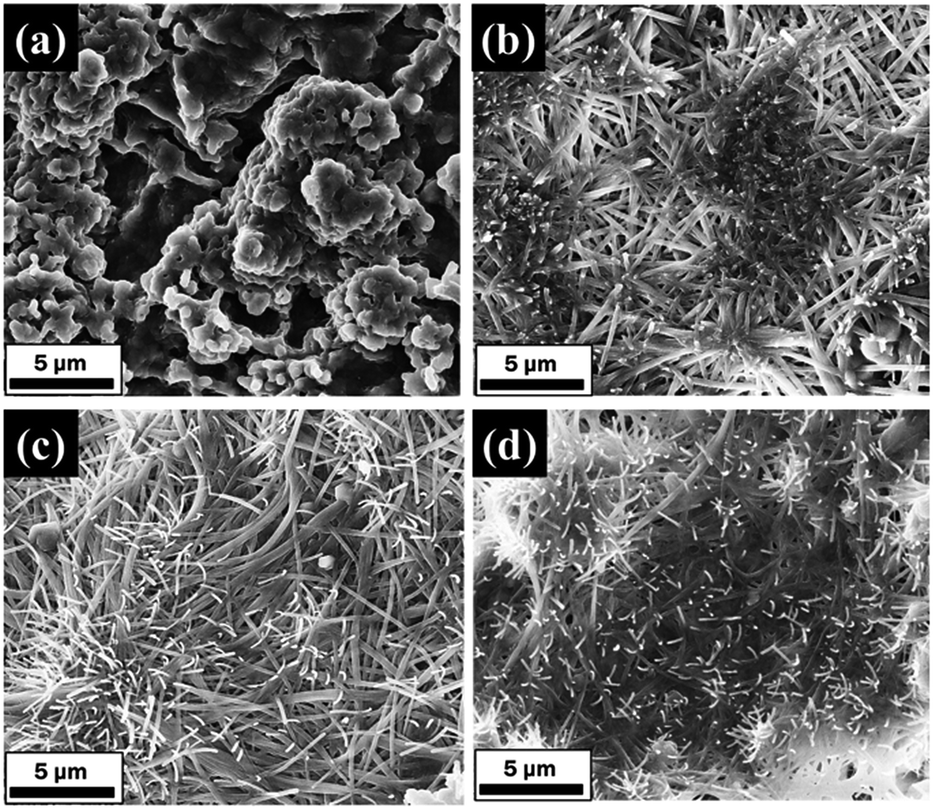
The FESEM images of modified AABs with different loading amounts of Na2CO3 are shown in Fig. 4(a–d). Clearly, the surface morphology of the samples changes greatly with different loading amounts. When the loading amount is 5 wt%, the surface of the sample shows a small number of fibers growing along the edge of AAB pores, meanwhile blocking most of the fluffy structures. Further enhancing the loading amount to 15–20 wt%, the fibers on the surface of the samples reach their longest; that is, the fibers have an average length longer than 20 μm, the average aspect ratio is more than 100, and they uniformly cover the surface of AABs, which greatly improves the active sites of sorbents. When the loading amount increased to 25 wt%, almost all the fibers disappeared, and the surface of AABs are covered completely by a thick layer of Na2CO3. The SEM results can explain the BET variation.
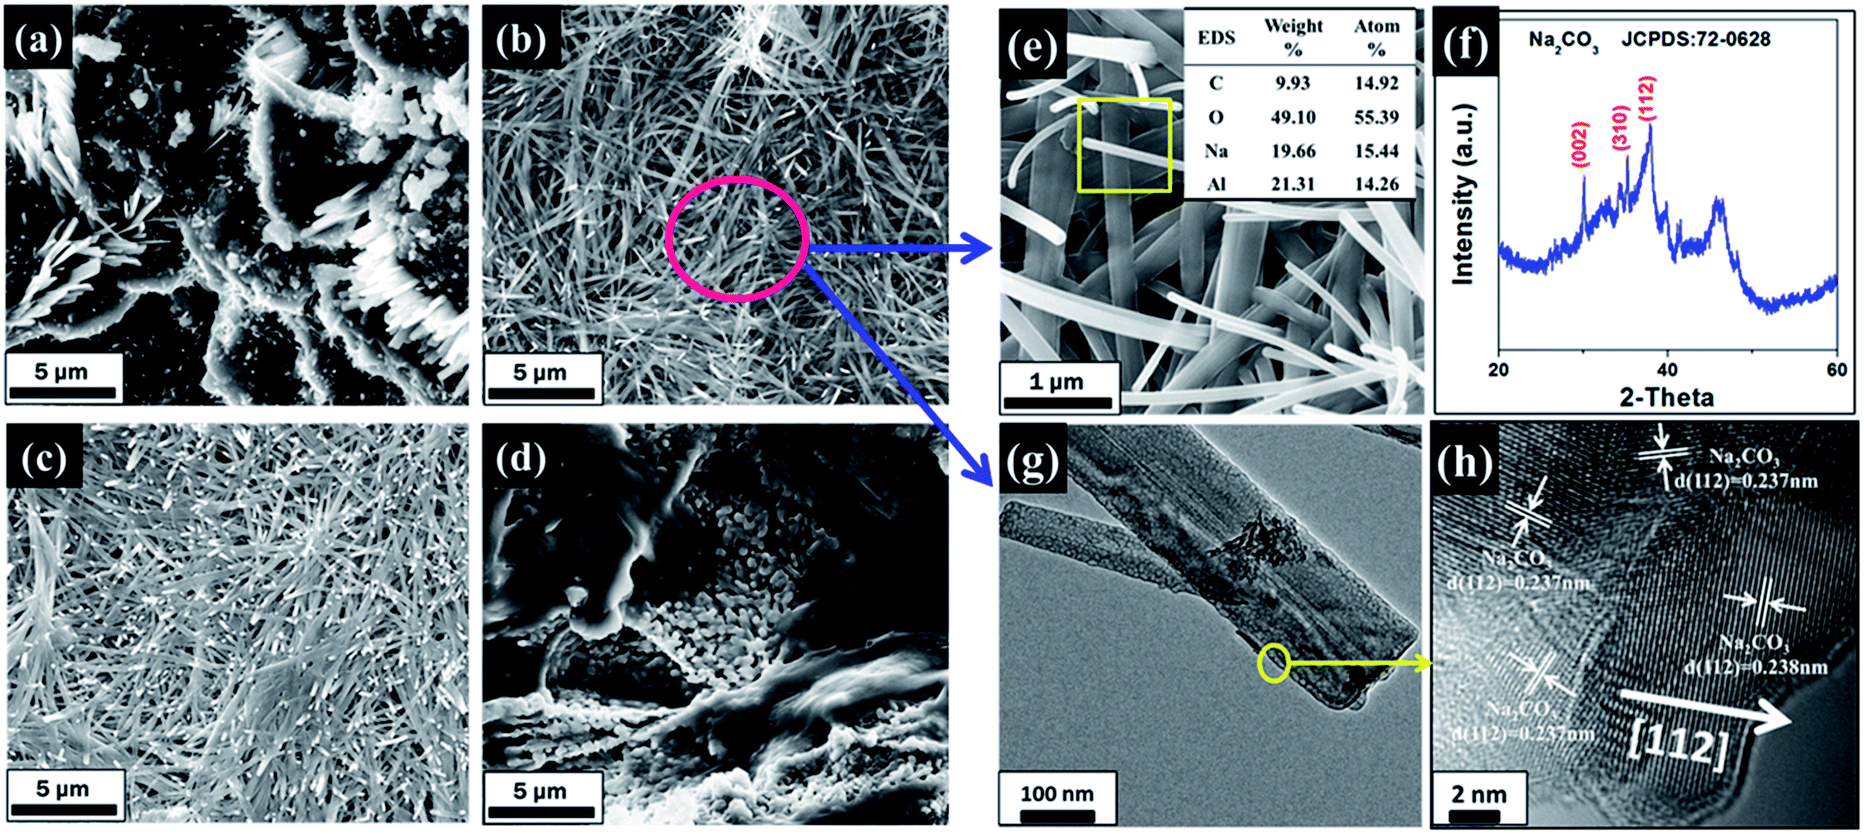 | ||
| Fig. 4 Representative FESEM images of modified AABs with different loading amounts of Na2CO3: (a) 5 wt%, (b) 15 wt%, (c) 20 wt%, (d) 25 wt%, and (e) typical SEM-EDS analysis of the fibers, (f) XRD pattern of the modified AABs (15 wt%), and (g) TEM and (h) HRTEM images of the fiber. | ||
In order to analyze and understand the cause of formation and the phase composition of fibers, XRD, SEM and TEM of modified AABs with 15 wt% loading were subsequently detected. The EDS result in Fig. 4(e) shows that fibers consist of elements Na and Al, suggesting that Na2CO3 may be adsorbed on the Al2O3 substrate. Furthermore, detection of Al illustrates that the surface of the Al2O3 substrate has not been completely enclosed, which benefits the effective utilization of the porous structure of the Al2O3 substrate. Fig. 4(g) shows a typical TEM image of the fibers. The crystal plane distance measured by the lattice fringe is 0.237 nm or 0.238 nm in Fig. 4(h), which is similar to the (112) lattice spacing of Na2CO3 (0.237 nm, PDF card no. 72-0628). Furthermore, it can be found that the Na2CO3 fiber shows a stronger diffraction peak of (112) in Fig. 4(f), suggesting that the growth of fibers is oriented along the [112] direction.
The pore volume distribution of the six samples is shown in Fig. 5. It can be seen that the pore volume distribution of modified samples concentrates in the range of 5–10 nm and that the samples exhibit almost uniform mesoporous structure, which agrees well with the result of SEM observation.
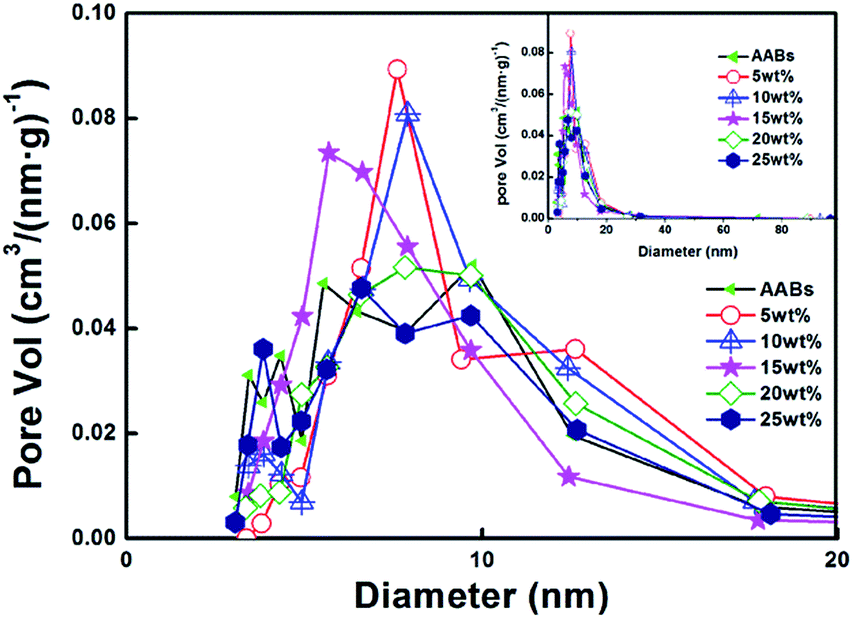 | ||
| Fig. 5 Pore volume distribution of the modified sorbents with different loading amounts: 0–25 wt%, inset image is the full view of the pore volume distribution. | ||
 | ||
| Fig. 6 FESEM images of modified AABs (20 wt%) with different impregnation time: (a) 2 h, (b) 10 h, (c) 17 h, (d) 24 h (impregnation conditions: drying for 24 h at 473 K). | ||
 | ||
| Fig. 7 FESEM images of modified AABs (20 wt%) at different drying time: (a) 16 h, (b) 20 h, (c) 24 h, (d) 28 h (impregnation conditions: impregnation time is 17 h, drying at 473 K). | ||
The wetness impregnation method was used to support Na2CO3 on AABs to obtain the modified sorbents. Na2CO3 fibers are controlled to grow on the AAB surface by adjusting the loading amount, the impregnation time and the drying time. The optimal conditions for fiber growth are a loading amount of 15–20 wt%, impregnation time of 17 h and drying at 473 K for 24 h.
3.2 HCl adsorption measurement
After the AABs were modified with the Na2CO3 fibers, the HCl removal experiments were carried out. In this study, the principle of HCl removal is an acid–base reaction, as shown in eqn (3).| Na2CO3 + 2HCl = 2NaCl + CO2 + H2O | (3) |
The capture of HCl involved firstly the physical selective adsorption on the surface of Na2CO3 fibers, followed by the acid–base reaction, forming NaCl crystals on the sorbent surface along with CO2, which escapes out.
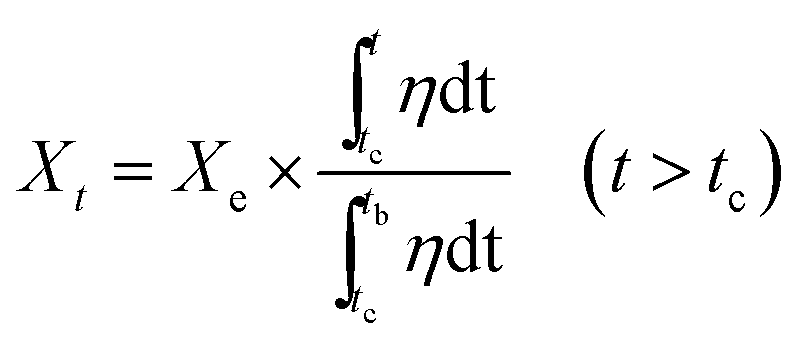
The total conversion rate Xe of Na2CO3 can be adopted to evaluate the reaction degree, which is depicted as eqn (4):
 | (4) |
 | ||
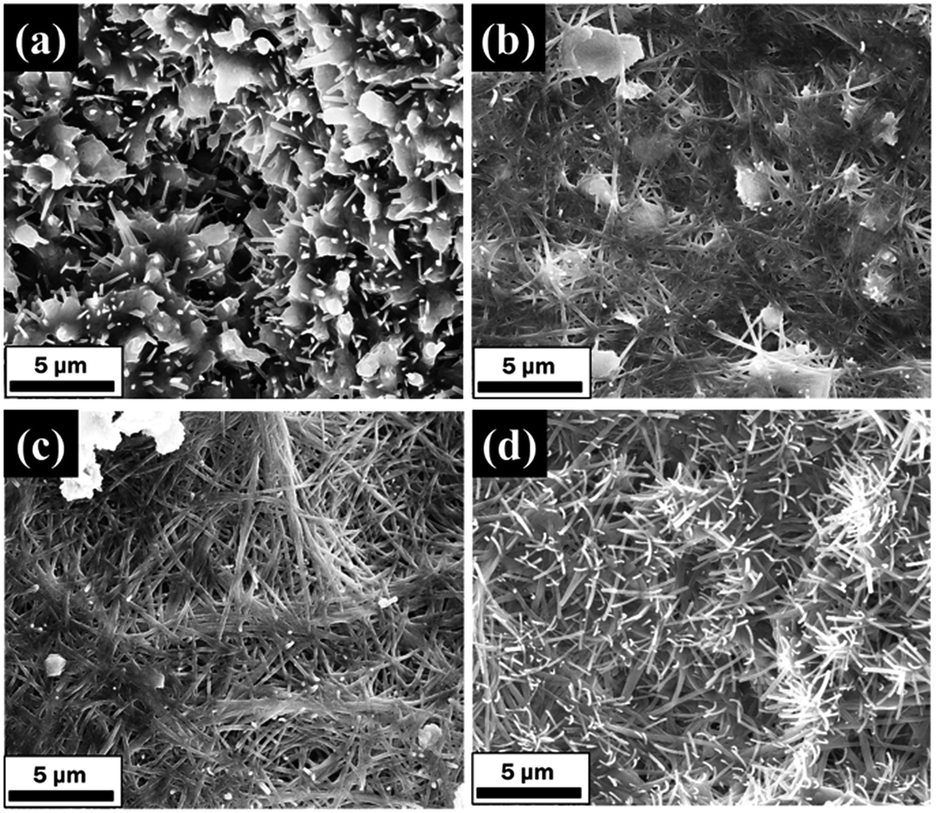
| Fig. 8 (a) FESEM image and (b) typical EDS spectrum of the exhausted sorbent with 20 wt% loading; (c) XRD patterns of the exhausted sorbents with different loading amounts: 0–25 wt%. The inset image in (a) presents the original microstructure of the fibers. | ||
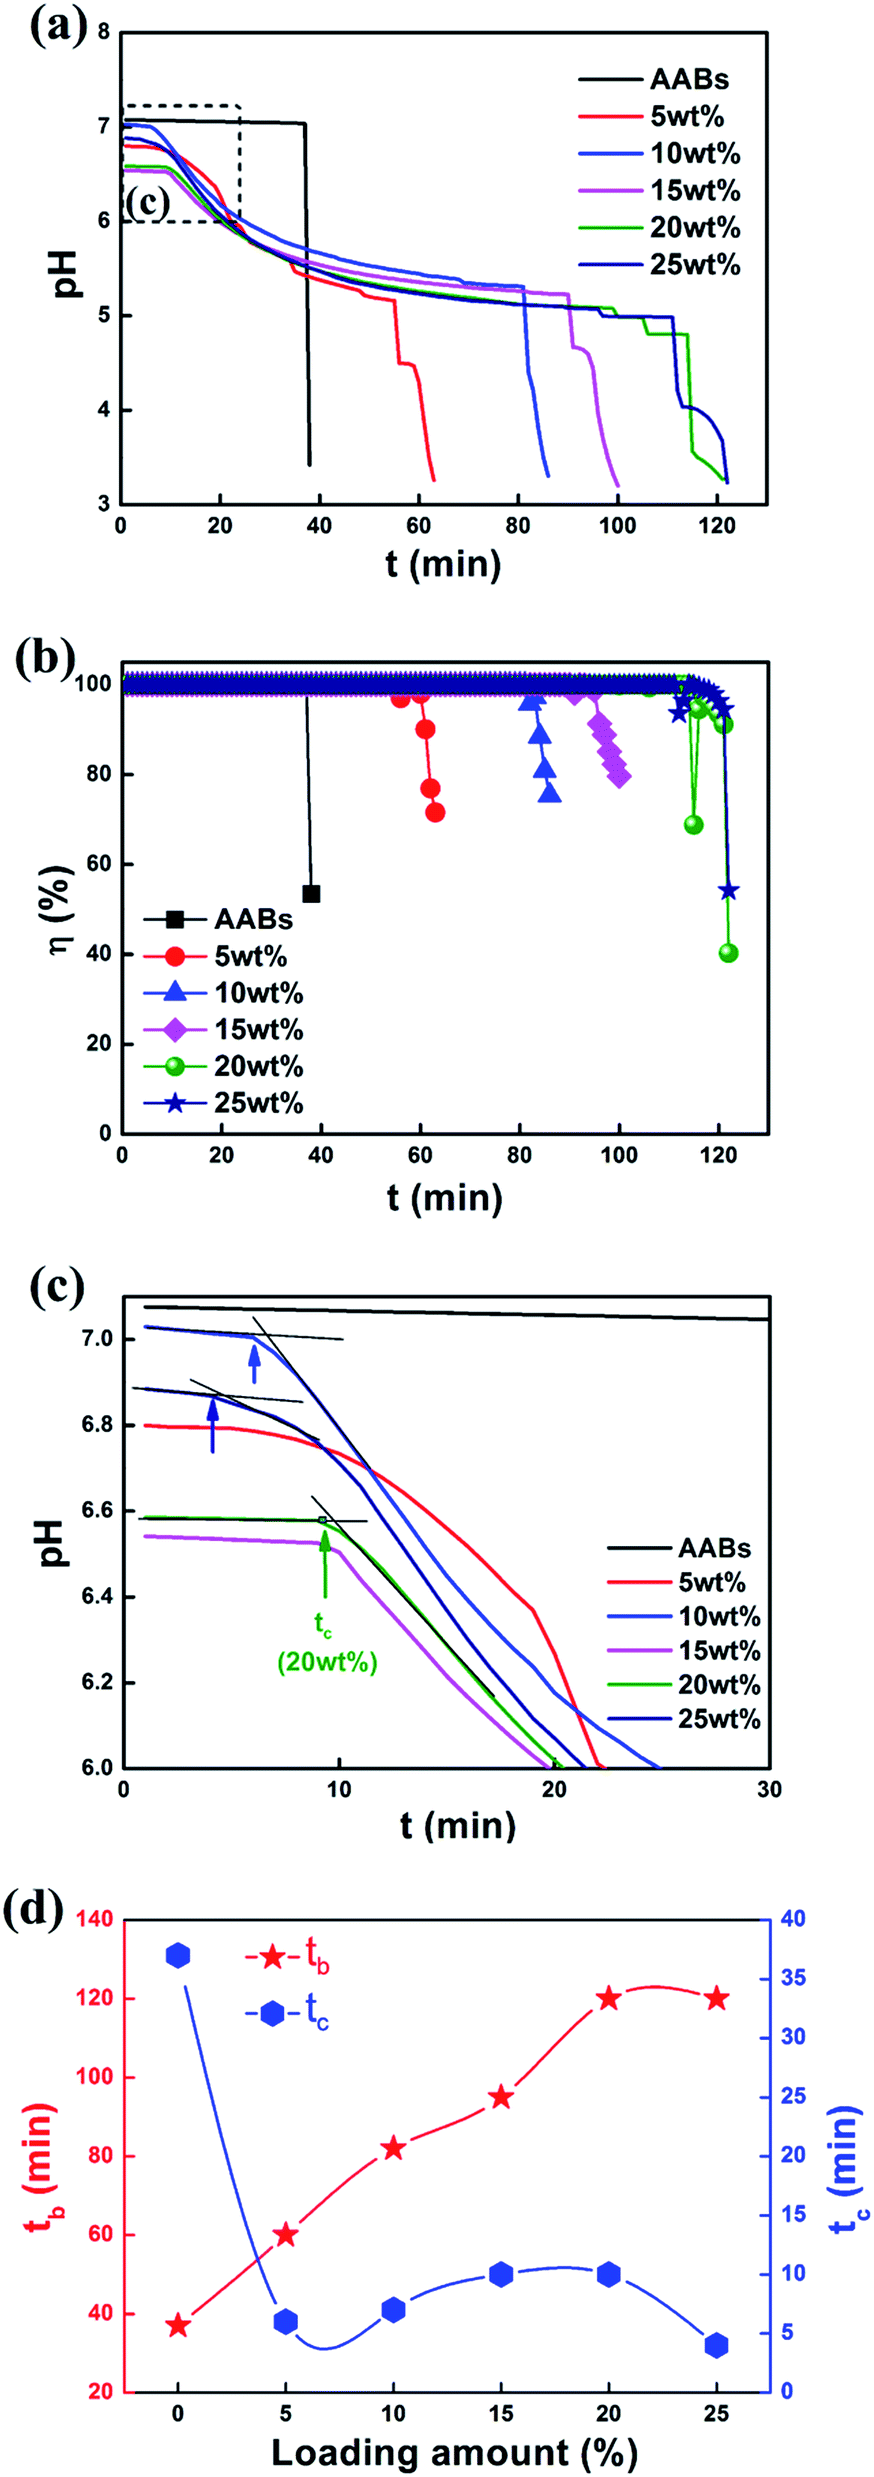 | ||
| Fig. 9 (a) The pH evolution curves and (b) the adsorption efficiency η curves of the sorbents with different loading amounts: 0–25 wt%. (c) The enlarged curves of (a) in the early 30 min period; (d) the curves of breakthrough time tb and transition time tc. | ||
The physical adsorption processes of these modified sorbents are far less than the AABs, suggesting that Na2CO3 has blocked the original pores of AABs. When the neutralization reaction between HCl and Na2CO3 is faster than the physical adsorption, the overall adsorption efficiency is only attributed to the chemical adsorption, where the sorbents completely capture the HCl. After the sorbent was consumed to a certain extent, HCl adsorption stopped, and the adsorption efficiency dropped dramatically (Fig. 9(b)); the sorbents became ineffective.
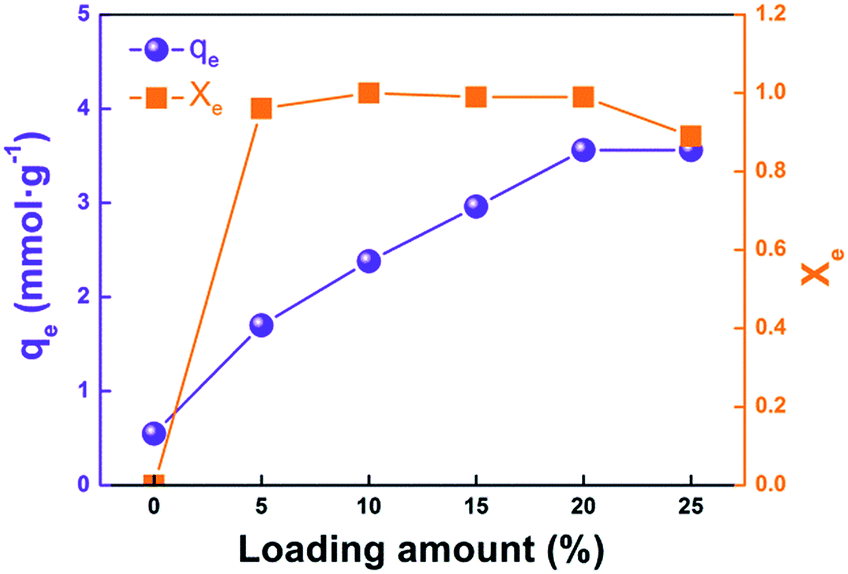 | ||
| Fig. 10 The curves of adsorption capacity qe and conversion ratio of Na2CO3 Xe vs. loading amounts. | ||
| Adsorbent | Percentage of active components | Gas flow rate (mL min−1) | Adsorption T (K) | Breakthrough HCl capacity/mmol g−1 | Conversion rate | Ref. | |
|---|---|---|---|---|---|---|---|
| a CN1# is Na0.98Mg0.25Ca2.3O3.04, mixed with binders and texturing agents. AC$ is activated carbon. (h−1)α is the unit of space velocity. | |||||||
| Na2CO3·10H2O | — | 250 | 673–773 | — | 0.49 | 5 | |
| Ca(OH)2 | — | 150 | 443 | — | ∼0.15 | 15 | |
| Limestone/Al2O3 | 30 wt% | 1400 | 1123 | — | ∼0.6 | 16 | |
| CN1# | — | 3000 (h−1)α | 823 | 4.1 | ∼0.4 | 14 | |
| NaOH/AC$ | 8 wt% | 100 | 308 | 0.05 | — | 36 | |
| Na2CO3/AC$ | 5 wt% | 100 | 308 | 0.33 | — | 36 | |
| K2CO3/Al2O3 | 40 wt% | 500 | 673 | 6.28 | 0.75 | 29 | |
| Na2CO3/Al2O3 | 20 wt% | 40 | 423 | 3.56 | 0.98 | This study | |
(1) The HCl gas adsorbs on the surface of the Na2CO3 fibers.
(2) HCl and Na2CO3 molecules react on the surface of Na2CO3 fibers, generating H2O, NaCl and CO2.
(3) The CO2 molecules escape outwardly into the gas stream through the product layer; H2O molecules, combined with fresh HCl molecules, diffuse to the inside surface of unreacted fibers.
(4) When the reaction rate of HCl and Na2CO3 quickly reduces, the sorbents become exhausted.
In this study, the principle of HCl adsorption is shown in eqn (3). The conversion ratio with per-minute Xt can be calculated to investigate the kinetics of HCl adsorption, as shown in eqn (5):
 | (5) |
Considering the pore size distribution of the sorbent, the vast majority of the mesopores do not govern the entry or exit of the gas; that is, the external diffusion of the gas never becomes the rate-limiting link of the adsorption reaction. According to the previous reports,42–46 the reaction kinetics of sorbents and HCl in the reaction of HCl adsorption at high temperature is mainly controlled by diffusion in the product layer or interfacial chemical reaction.
If reaction is controlled by the interfacial chemical reaction at the grain surface, it will follow eqn (6):9,13,44
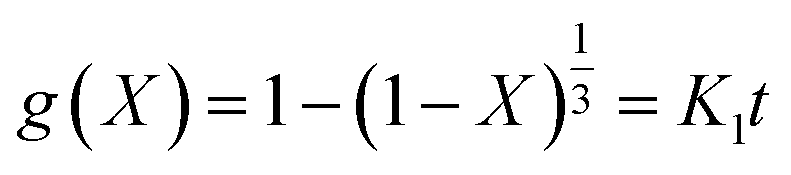 | (6) |
If the reaction is controlled by reactant diffusion through the product layer, it will follow eqn (7):
 | (7) |
After fitting the experimental data to eqn (6) and (7), the calculated results are separately shown in Fig. 11(a) and (b). Compared with correlation coefficient, the figure shows that the model of the interfacial chemical reaction control could better explain the experimental results; especially, the linear fitting coefficient R2 of the modified AABs is larger than 0.980, proving that the adsorption reaction is completely controlled by the interfacial chemical reaction. On one hand, the Na2CO3 fibers did not block the fluffy structures on the surface of original AABs as shown in Fig. 2(b) and maintained the large specific surface area of the AABs; on the other hand, the uniform pore distribution of Na2CO3 fibers provided many convenient channels for the gas inward and outward, both resulting in the easier diffusion of gas phase in the product layer. In this case, internal diffusion of gas phase will no longer be the rate-limiting step in the process of chemical adsorption.
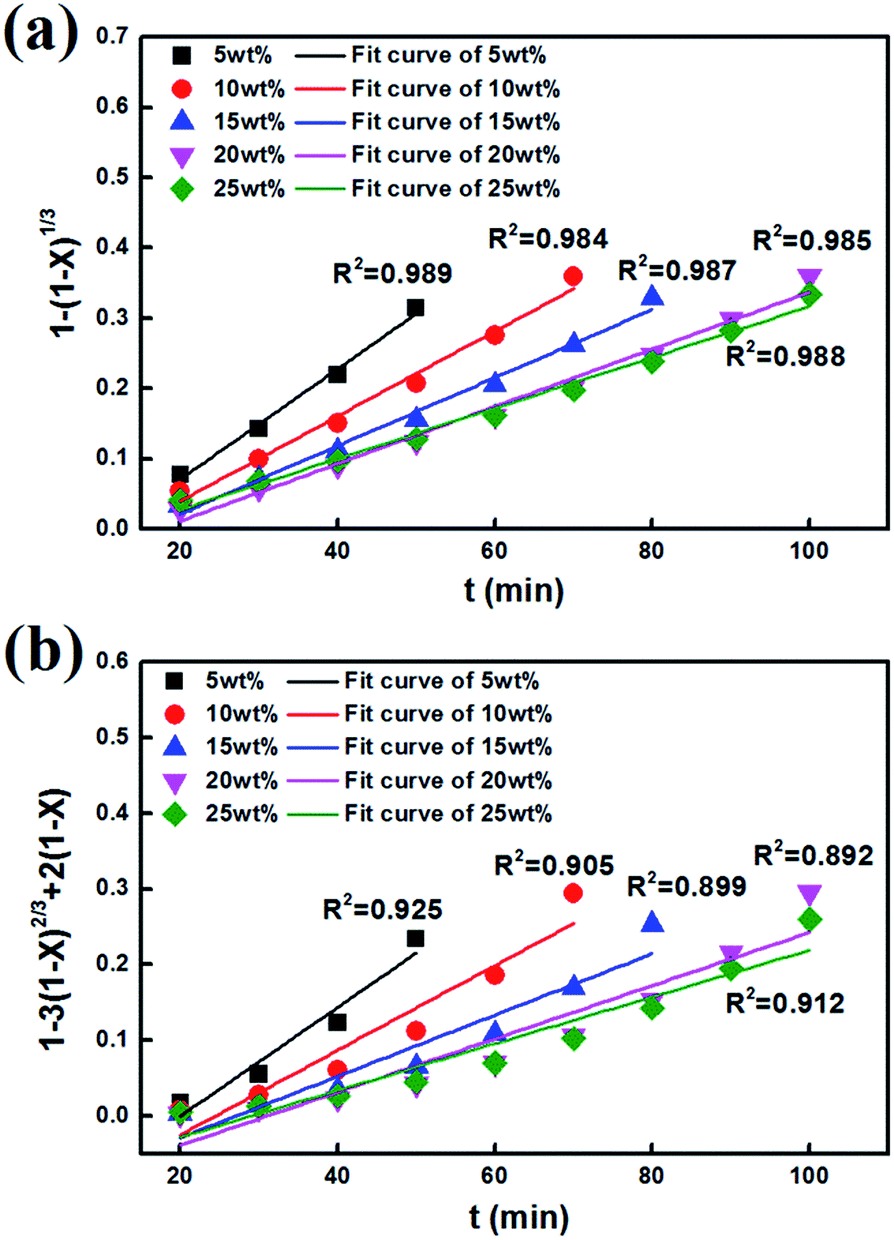 | ||
| Fig. 11 Correlation of X with time t: (a) interfacial chemical reaction control, (b) product layer diffusion control. | ||
4. Conclusions
In this paper, alkali-modified AABs have been prepared to evaluate their performance for HCl adsorption at low temperature (423 K). The results have demonstrated better modification ability of Na2CO3 compared to Ca(OH)2 or NaOH. A typical fibrous structure was obtained on the surface of the sorbent by loading Na2CO3. The loading amounts, impregnation time and drying time had great impact on the morphology of Na2CO3 fibers. When the loading amount was 15–20 wt%, the impregnation time was 17 h, and the drying time was 24 h, Na2CO3 fibers with good orientation and high aspect ratio could be obtained.In addition, the HCl adsorption performance was investigated in a fixed bed reactor at 423 K. Extremely high adsorption efficiency and the highest adsorption capacity of 3.56 mmol HCl g−1 were achieved when the loading amount was 20 wt%; the adsorption capacity of the modified sorbents is five times that of AABs. The physical adsorption is faster than chemical adsorption in the initial process of HCl adsorption, and then the dominant reaction strongly depends on the chemical adsorption. The kinetics investigation indicates that the reaction is controlled by the interfacial chemical reaction; the diffusion of gas phase in the product layer has been greatly improved by the fiber structure. We believe that Na2CO3 fiber-impregnated AABs are promising for the commercial application of HCl removal from BFG.
Conflicts of interest
There are no conflicts to declare.Acknowledgements
This work was financially supported by the National Natural Science Foundation of China (51672025, 51572020, 51372019), and Major Projects of Science and Technology in Shanxi Province (MC2016-03).Notes and references
- K. Goto, H. Okabe, F. A. Chowdhury, S. Shimizu, Y. Fujioka and M. Onoda, Int. J. Greenhouse Gas Control, 2011, 5, 1214–1219 CrossRef CAS.
- B. S. Hu, Y. L. Gui, G. Y. Hu, K. Lv and C. Y. Song, Environ. Eng., 2016, 34, 78–80 CAS.
- B. Zhang, B. S. Hu, Y. L. Gui, X. G. Liu and G. Y. Hu, Mod. Chem. Ind., 2016, 36, 137–140 Search PubMed.
- R. Bie, S. Li and L. Yang, Chem. Eng. Sci., 2005, 60, 609–616 CrossRef CAS.
- W. Duo and N. F. Kirkby, Chem. Eng. Sci., 1996, 51, 2541–2546 CrossRef CAS.
- A. D. Lawrence and J. Bu, Chem. Eng. Sci., 2000, 55, 6129–6137 CrossRef CAS.
- W. Duo, N. F. Kirkby, J. P. K. Seville and R. Clift, Chem. Eng. Sci., 1995, 50, 2017–2027 CrossRef CAS.
- H. Matsuda, S. Ozawa, K. Naruse, K. Ito, Y. Kojima and T. Yanase, Chem. Eng. Sci., 2005, 60, 545–552 CrossRef CAS.
- B. L. Dou, C. Wang, H. S. Chen, Y. C. Song, B. Z. Xie, Y. J. Xu and C. Q. Tan, Chem. Eng. Res. Des., 2012, 90, 1901–1917 CrossRef CAS.
- G. M. Lin and C. S. Chyang, Energy Fuels, 2016, 30, 10696–10704 CrossRef CAS.
- M. Nunokawa, M. Kobayashi and H. Shirai, Powder Technol., 2008, 180, 216–221 CrossRef CAS.
- W. Duo, J. P. K. Sevill, N. F. Kirkby and R. Clift, Chem. Eng. Sci., 1994, 49, 4429–4442 CrossRef CAS.
- B. L. Dou, B. B. Chen, J. S. Gao and X. Z. Sha, Energy Fuels, 2005, 19, 2229–2234 CrossRef CAS.
- B. Dou, W. Pan, J. Ren, B. Chen, J. Hwang and T.-U. Yu, Energy Fuels, 2007, 21, 1019–1023 CrossRef CAS.
- R. Yan, T. Chin, D. T. Liang, K. Laursen, W. Y. Ong, K. Yao and J. H. Tay, Environ. Sci. Technol., 2003, 37, 2556–2562 CrossRef CAS PubMed.
- J. Partanen, P. Backman, R. Backman and M. Hupa, Fuel, 2005, 84, 1664–1673 CAS.
- C. Yang, L. L. Gao, Y. X. Wang, X. K. Tian and S. Komarneni, Microporous Mesoporous Mater., 2014, 197, 156–163 CrossRef CAS.
- Z. R. Zhang, R. W. Hicks, T. R. Pauly and T. J. Pinnavaia, J. Am. Chem. Soc., 2001, 124, 1592–1593 CrossRef.
- T. J. Bandosz, Carbon, 1999, 37, 483–491 CrossRef CAS.
- M. Balsamo, S. Cimino, G. de Falco, A. Erto and L. Lisi, Chem. Eng. J., 2016, 304, 399–407 CrossRef CAS.
- M. C. Castrillon, K. O. Moura, C. A. Alves, M. Bastos-Neto, D. C. S. Azevedo, J. Hofmann, J. Möllmer, W.-D. Einicke and R. Gläser, Energy Fuels, 2016, 30, 9596–9604 CrossRef CAS.
- A. Taguchi and F. Schüth, Microporous Mesoporous Mater., 2005, 77, 1–45 CrossRef CAS.
- W. Feng, S. Kwon, E. Borguet and R. Vidic, Environ. Sci. Technol., 2005, 39, 9744–9748 CrossRef CAS PubMed.
- R. Yan, D. T. Liang, L. Tsen and J. H. Tay, Environ. Sci. Technol., 2002, 36, 4460–4466 CrossRef CAS PubMed.
- L. Li, T. H. Sun, C. H. Shu and H. B. Zhang, J. Hazard. Mater., 2016, 311, 142–150 CrossRef CAS PubMed.
- J. Y. Kim, Y. C. Park, S. H. Jo, H. J. Ryu, J. I. Baek and J. H. Moon, Energy Fuels, 2016, 30, 2268–2275 CrossRef CAS.
- G. J. Mcintosh, G. E. Agbenyegah, M. M. Hyland and J. B. Metson, Langmuir, 2015, 31, 5387–5397 CrossRef CAS PubMed.
- D. Dayananda, V. R. Sarva, S. V. Prasad, J. Arunachalam, P. Parameswaran and N. N. Ghosh, Appl. Surf. Sci., 2015, 329, 1–10 CrossRef CAS.
- S. J. Park and S. Y. Jin, Carbon, 2004, 42, 2113–2115 CrossRef CAS.
- B. Tu, N. Shi, W. Sun, L. Cao and J. Yang, Environ. Sci. Pollut. Res., 2017, 24, 676–684 CrossRef CAS PubMed.
- W. Dong, X. Chen, F. Yu and Y. Wu, Energy Fuels, 2015, 29, 968–973 CAS.
- A. G. Skerman, S. Heubeck, D. J. Batstone and S. Tait, Process Saf. Environ. Prot., 2017, 105, 117–126 CrossRef CAS.
- A. Daneshyar, M. Ghaedi, M. M. Sabzehmeidani and A. Daneshyar, J. Colloid Interface Sci., 2017, 490, 553–561 CrossRef CAS PubMed.
- M.-T. Lee, Z.-Q. Wang and J.-R. Chang, Ind. Eng. Chem. Res., 2003, 42, 6166–6170 CrossRef CAS.
- L. Micoli, G. Bagnasco and M. Turco, Int. J. Hydrogen Energy, 2014, 39, 1783–1787 CrossRef CAS.
- L. Micoli, G. Bagnasco and M. Turco, Int. J. Hydrogen Energy, 2013, 38, 447–452 CrossRef CAS.
- C. Zhao, X. Chen and C. Zhao, Energy Fuels, 2012, 26, 1401–1405 CrossRef CAS.
- C. Zhao, Y. Guo, C. Li and S. Lu, Appl. Energy, 2014, 124, 241–247 CrossRef CAS.
- C. Zhao, X. Chen and C. Zhao, Chemosphere, 2009, 75, 1401–1404 CrossRef CAS PubMed.
- B. Y. Zhao, D. E. Jiang and Y. C. Xie, Fuel, 2002, 81, 1565–1568 CrossRef CAS.
- W. Dong, X. Chen, Y. Wu, C. Zhao and C. Liang, Energy Fuels, 2012, 26, 6040–6046 CrossRef CAS.
- N. Verdone and P. D. Filippis, Chem. Eng. Sci., 2006, 61, 7487–7496 CrossRef CAS.
- A. M. Fonseca, J. J. Órfão and R. L. Salcedo, Ind. Eng. Chem. Res., 1998, 37, 4570–4576 CrossRef CAS.
- B. L. Dou, J. S. Gao and X. Z. Sha, Fuel Process. Technol., 2001, 72, 23–33 CrossRef CAS.
- M. J. D. Low, Chem. Rev., 1980, 60, 267–312 CrossRef.
- C. E. Weinell, P. I. Jensen and K. D. Johansen, Ind. Eng. Chem. Res., 1992, 31, 164–171 CrossRef CAS.
| This journal is © The Royal Society of Chemistry 2017 |