DOI:
10.1039/C7RA10730G
(Paper)
RSC Adv., 2017,
7, 52312-52320
Synthesis of uniform porous NiO nanotetrahedra and their excellent gas-sensing performance toward formaldehyde
Received
28th September 2017
, Accepted 5th November 2017
First published on 13th November 2017
Abstract
Porous tetrahedron-like NiO nanostructures composed of primary nanoparticles have been successfully synthesized via a facile two-step method for the first time. The tetrahedron-like Ni(HCO3)2 precursor was firstly prepared by a solvothermal reaction with the assistance of PVP using a mixture of ethylene glycol and distilled water as the solvent. The porous NiO products were then obtained by annealing the precursor at different temperatures. Some characterization including X-ray diffraction (XRD), scanning electron microscopy (SEM), and transmission electron microscopy (TEM) was performed to obtain structural and morphological information about the as-prepared NiO products. The NiO products obtained by annealing at 400 °C and 500 °C were porous tetrahedron-like particles composed of primary nanoparticles with size increasing with annealing temperature, while the NiO products obtained by annealing at 600 °C were collapsed into irregular nanoparticles. The gas-sensing properties of the three NiO samples were evaluated and the sensors exhibit high sensitivity, good selectivity and stability towards HCHO at 250 °C. The sensitivity of the three samples follows the sample sequence S500 > S400 > S600 due to the combined effect of specific surface area, pore size and defects in the nanocrystals.
1. Introduction
In recent years, the detection of harmful and toxic gases and environmental evaluation have attracted considerable attention because these harmful gases continue to threaten human health. At present, several methods including electrochemical, spectroscopic, chemiluminescent, gas-sensing, and colorimetric detection methods have been developed.1–5 Among these techniques, chemical sensing based on metal oxide semiconductors is regarded as a highly efficient and economical method for the detection of toxic gases due to the low production cost, fast response, high sensitivity, and good stability of the chemical sensors.6,7 Compared to n-type metal oxide semiconductors, the application of p-type metal oxide semiconductors as gas-sensing materials has received relatively little attention owing to their low sensitivity. However, p-type metal oxide-based gas sensors have unique advantages, such as low humidity dependence and good catalytic effect, which might promote selective oxidation of harmful and toxic gases.7,8 Therefore, fabricating novel nanostructures of p-type metal oxides and exploring their morphology-dependent applications in the gas-sensing fields have important scientific and practical significance.
As an important p-type semiconductor with a wide band gap of ∼3.6 eV, NiO nanomaterials have been used in a variety of fields, such as supercapacitors,9 catalysis,10 electrode materials for lithium ion batteries,11,12 and fuel cells.13 Moreover, NiO has been developed as one of the promising gas-sensing materials due to their nontoxicity and high chemical stability.8,14–19 To date, the morphology of NiO and its controlled synthesis has attracted considerable attention for morphology and microstructure affected their performance greatly. Up to now, different wet chemical methods such as hydrothermal or solvothermal method, electrochemical method, electrospinning route and sonochemical route were widely used to prepare a variety of NiO nanostructures. The morphology of NiO nanostructures were mainly focused on nanosheets,18,20 flowerlike microspheres,12,21–23 nanoparticles,16 nanotubes,14 nanowires,24 nanofibers,17,25 nanocrystalline thin films,26,27 and polyhedral nanoparticles.28–30 From the viewpoint of gas sensor, nanostructures with high specific surface area and porous structure are advantageous for improving the gas-sensing performance. To the best of our knowledge, although several NiO polyhedra including sophisticated concave polyhedra,28 nanooctahedron aggregates,29 and hollow octahedral NiO30 have been reported, there have been no reports on the synthesis and properties investigation of tetrahedral NiO nanoparticles. In addition, the gas-sensing property investigation of p-type NiO nanomaterials was mainly focused on ethanol,14 H2,15 CO,16 NO2,8,16 NH3,17 formaldehyde,18 and acetone.31 Although there were some investigations on the sensing behaviours of NiO towards formaldehyde, a notorious indoor air pollutants, the sensitivity was relative low and the gas-sensing mechanism was still need further investigation.18,26,27,32
In this article, we report an efficient and facile solvothermal method for the preparation of tetrahedron-like Ni(HCO3)2 precursor nanoparticles, which can be thermally decomposed to form porous NiO nanotetrahedra or aggregated irregular NiO nanoparticles. Formaldehyde gas-sensing properties of these NiO nanostructures were investigated. The results demonstrated that the porous NiO nanotetrahedra with relative larger pore size obtained by annealing the precursor at 500 °C exhibited superior sensitivity to HCHO gas, indicating that besides specific surface area and pore size, the defect in the nanocrystals also affected the gas-sensing performance of the sensing-materials significantly.
2. Experimental section
2.1 Synthesis
All the reagents were of analytical grade and were used as received without further purification. The NiO nanotetrahedra were prepared by a solvothermal process combined with a post-calcination process. Typically, 0.160 g of NiCl2·6H2O, 0.370 g of urea, and 0.370 g of PVP K30 was dissolved into the mixture of 16.6 mL of ethylene glycol (EG) and 1.4 mL of distilled water under vigorously stirring to form a green viscous solution, which was transferred into a Teflon-lined autoclave of 25.0 mL capacity and heated at 160 °C for 12 h in an electronic oven. After completion of the reaction, the autoclave was cooled to room temperature naturally. The as-obtained green Ni(HCO3)2 precipitate was collected by centrifugation and washed several times with distilled water and absolute ethanol and finally dried at ambient temperature. The NiO products were obtained by annealing the green Ni(HCO3)2 precipitate in a muffle furnace at 400 °C, 500 °C, and 600 °C for 2 h, respectively, in air atmosphere with a heating rate of 5 °C min−1. In the following text, the as-prepared green Ni(HCO3)2 precipitate was called Ni(HCO3)2 precursor, while the NiO samples annealed at 400 °C, 500 °C, and 600 °C were respectively denoted as sample S400, S500, and S600.
2.2 Characterization
A Bruker D8 ADVANCE diffractometer with Cu Kα radiation (λ = 0.15418 nm) was used to identify the phase composition and purity of the products in the range from 10° to 80°. The morphologies and microstructures of the samples were characterized by a field-emission scanning electron microscope (SEM, FEI NOVA Nano SEM 230) and a high-resolution transmission electron microscope (HRTEM, FEI, Tecnai G2 F20). The thermogravimetry analysis (TG) was conducted on a Rigaku Thermo plus EVO2 TG8121 analyser upon heating to 800 °C at a rate of 15 °C min−1 under air atmosphere. The specific surface area and the pore size distribution were determined from N2 adsorption–desorption isotherms at 77 K, obtained by a 3Flex analyser. The specific surface area was calculated from multipoint adsorption data of the N2 adsorption isotherms by using Brunauer–Emmett–Teller (BET) theory. Pore size distribution was calculated from the analysis of the isotherm using the Barrett–Joyner–Halenda (BJH) algorithm. X-ray photoelectron spectroscopy (XPS) measurement was carried out on an ESCALAB 250xi spectrometer (Thermon Scientific, USA) using Al Kα radiation. The binding energies were referenced to the C 1s line at 284.8 eV from adventitious carbon.
2.3 Gas-sensing performance testing
The gas-sensing property of the as-prepared NiO products towards different volatile or toxic gases was evaluated using a WS-30A sensor measurement system (WeiSheng Electronics Co., Ltd., Henan, China). The structure, fabrication, and testing procedure of the gas sensor based on NiO products were similar to those of the sensor based on Co, Ni, Zn(II)-ferrite nanospheres in our previous report.33 The gas sensitivity of the sensor was defined as the ratio of Rgas/Rair, where Rgas and Rair are the electrical resistance of the sensor measured in the test gas and in air, respectively. The time taken by the resistance to reach 90% of its saturation after the gas in or out is defined as the response time or recovery time.
3. Results and discussion
3.1 Morphology and structure
The as-obtained green precipitate obtained after solvothermal reaction was confirmed to be Ni(HCO3)2 by X-ray diffraction technique (XRD). The corresponding XRD pattern was shown in Fig. 1a and all the diffraction peaks can be indexed to the cubic phase of nickel hydrogen carbonate (Ni(HCO3)2, JCPDS no. 15-0782). The thermal behaviour of the precursor in air was studied to determine the appropriate thermal conversion temperature of the Ni(HCO3)2 precursor to NiO. As shown in Fig. 1b, there is an obvious mass loss of 40.33% in the TG curve before 600 °C, which was smaller than the theoretical value (57.0%) of the decomposition of Ni(HCO3)2 to form NiO, probably because that there was already some NiO exists in the as-obtained Ni(HCO3)2 precursor. However, the diffraction peaks of NiO can be overlapped by those of Ni(HCO3)2, thus the NiO phase was hard to identify from the XRD pattern. Fig. 1c shows a representative large area SEM image of the Ni(HCO3)2 precursor, indicating that the sample is uniform tetrahedron-like nanoparticles. From the high magnification SEM images as shown in Fig. 1d and e, the tetrahedron-like morphology can be clearly observed. The side-length of these tetrahedron-like nanoparticles was in the range of ca. 185–225 nm.
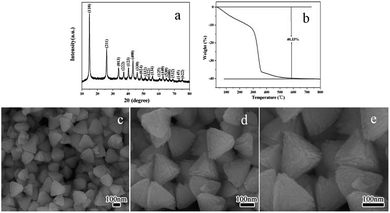 |
| | Fig. 1 XRD pattern (a), TG curve (b), and SEM images (c, d, e) of the Ni(HCO3)2 precursor. | |
According to the TG result, the Ni(HCO3)2 precursor will decompose to form NiO after calcination. To investigate the effect of annealing temperature on the morphology, microstructure, and property of the products, the typical tetrahedron-like Ni(HCO3)2 precursor was annealed in air atmosphere in a muffle furnace at 400 °C, 500 °C, and 600 °C for 2 h, respectively. The crystal structure of the annealed NiO nanostructures was characterized by X-ray diffraction. As shown in Fig. 2, the diffraction peaks can be perfectly indexed to diffraction of the {111}, {200}, {220}, {311}, and {222} crystal planes of the cubic phase bunsenite (NiO, JCPDS no. 71-1179). No other evident peaks have been detected, indicating the high purity of the final products. The results indicated that although a little weight loss exists in the TG curve when above 400 °C, pure phase NiO can be formed when the precursor was annealed at 400 °C or above. Obviously, the diffraction peaks become stronger and sharper from S400 to S500 and S600, indicating an enhancement of crystallinity with the annealing temperature.
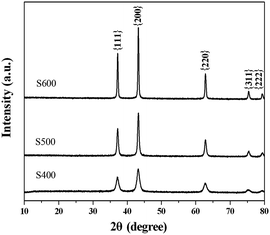 |
| | Fig. 2 XRD pattern of different NiO samples prepared by annealing the precursor at 400 °C (sample S400), 500 °C (S500), and 600 °C (S600). | |
The morphologies of the NiO annealed at different temperatures in air were studied by SEM techniques. As shown in Fig. 3a–d, the as-obtained S400 and S500 inherited the tetrahedron-like morphology of the Ni(HCO3)2 precursor primely. These nanotetrahedra are porous and are composed of primary nanoparticles. Obviously, the pores are generated due to the liberation of H2O and CO2 gases during the decomposition of the precursor and the size of the pores increased with the annealing temperature. However, after annealed at 600 °C for 2 h, almost all the nanotetrahedra ruptured to form irregular particles with width in the range of ca. 25–70 nm (Fig. 3e and f). It can be seen that the size of the primary NiO nanoparticles increased with the annealing temperature due to the crystal growth at higher temperature.
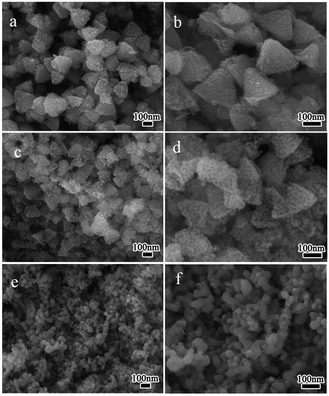 |
| | Fig. 3 SEM images of different NiO samples prepared at 400 °C (S400, a, b); 500 °C (S500, c, d); and 600 °C (S600, e, f). | |
To gain further insight into the morphology and structure characteristics of the samples, TEM photographs, high resolution TEM photographs (HRTEM) and corresponding selected area electron diffraction patterns (SAED) of the samples were taken by TEM (Fig. 4). As shown in the low magnification TEM images (Fig. 4a and d), uniform triangle-shaped nanoparticles with side-length of ca. 105–250 nm and 115–190 nm can be observed for sample S400 and S500. It can be imagined that the triangle-shaped nanoparticles in the TEM images were the projection of the tetrahedron-like nanoparticles, thus the TEM results were consistent with the SEM results. Although sample S400 and S500 inherited the exterior morphology of the Ni(HCO3)2 precursor, the size of the products decreased slightly with the annealing temperature due to the decomposition of the precursor to liberate gases and the growth of component nanoparticles. For the sample obtained by annealing at 600 °C (S600, Fig. 4g), the products were aggregated irregular nanoparticles of ca. 25–70 nm in width. Fig. 4b, e, and h were high magnification TEM images of several nanoparticles for the three samples, respectively. It can be seen clearly that the triangle-shaped nanoparticles (Fig. 4b and e) had porous structure and were composed of a large number of primary nanoparticles. The primary nanoparticles were ca. 7–10 nm and 12–23 nm for sample S400 and S500, respectively. The corresponding SAED pattern of a single NiO nanotetrahedron of sample S400 was shown in the top-left inset of Fig. 4b. The presence of electron diffraction rings indicated the polycrystalline structure of the nanotetrahedron. The SAED patterns of sample S500 and S600 were presented in the top-left inset of Fig. 4e and h, respectively. The presence of ED spots indicates that all the two samples have a quasi-single crystalline structure. The two SAED patterns show similar characteristics, and the diffraction spots can be indexed to (220), (202), (0![[2 with combining macron]](https://www.rsc.org/images/entities/char_0032_0304.gif) 2) planes and their equivalent planes. Fig. 4c, f and i show the high-resolution TEM (HRTEM) images recorded on the corresponding section marked with white rectangles in Fig. 4b, e and h. Clear lattice fringes could be observed, indicating the good crystallinity of the products. The interplanar distances in the HRTEM image of sample S400 (Fig. 4c) were measured to be 0.24 nm and 0.21 nm, corresponding to the (111) and (200) planes of the cubic phase NiO, respectively. The interplanar distances of 0.24 nm observed in Fig. 4f of sample S500 can be indexed to the (111) plane of the NiO. For sample S600 (Fig. 4i), clear lattice fringes with the interplanar distance of 0.21 nm can be observed, which corresponded to (200) planes of NiO.
2) planes and their equivalent planes. Fig. 4c, f and i show the high-resolution TEM (HRTEM) images recorded on the corresponding section marked with white rectangles in Fig. 4b, e and h. Clear lattice fringes could be observed, indicating the good crystallinity of the products. The interplanar distances in the HRTEM image of sample S400 (Fig. 4c) were measured to be 0.24 nm and 0.21 nm, corresponding to the (111) and (200) planes of the cubic phase NiO, respectively. The interplanar distances of 0.24 nm observed in Fig. 4f of sample S500 can be indexed to the (111) plane of the NiO. For sample S600 (Fig. 4i), clear lattice fringes with the interplanar distance of 0.21 nm can be observed, which corresponded to (200) planes of NiO.
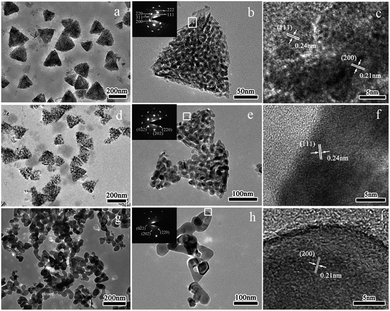 |
| | Fig. 4 TEM images, HRTEM images, SAED patterns of different NiO samples prepared at 400 °C (S400, a, b, c); 500 °C (S500, d, e, f); and 600 °C (S600, g, h, i). | |
The nitrogen adsorption–desorption isotherms and the BJH pore-size distribution of the three NiO samples obtained by annealing at 400 °C, 500 °C, and 600 °C were shown in Fig. 5. It can be seen that all the three annealed samples showed IUPAC type IV isotherms and type H3 hysteresis loops in the range of 0.6–1.0 P/P0, indicating the mesoporous structure of the samples and the presence of slit-shaped pores in the samples. As listed in Table 1, the specific BET surface areas of the three samples are 114.8, 52.6, and 22.4 m2 g−1, respectively. The average BJH pore sizes of S400 and S500 are 7.5 and 18.9 nm, respectively, while no obvious pores are detected for sample S600. The mesopores are actually the void space generated by the thermal evaporation of water and CO2 molecules. With increasing the annealing temperature, the small pores tend to grow and combine with each other to form the larger ones, while the primary NiO nanocrystals grow simultaneously to form larger ones as demonstrated by the TEM results. At the higher annealing temperature (sample S600), the tetrahedron-like structure ruptured to form relative larger nanocrystals (ca. 25–70 nm in width) and the pores disappeared. Thus, the specific surface areas decreased with the increasing of the annealing temperature.
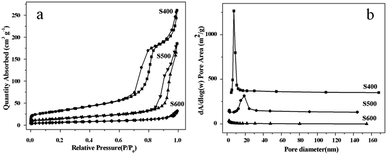 |
| | Fig. 5 N2 adsorption–desorption isotherm (a) and corresponding pore size distribution (b) of the three NiO samples prepared at different annealing temperatures. | |
Table 1 Specific surface area and BJH pore size of different NiO samples
| sample |
S400 |
S500 |
S600 |
| Surface area (m2 g−1) |
114.8 |
52.6 |
22.4 |
| Average pore size (nm) |
7.5 |
18.9 |
— |
3.2 Gas-sensing properties
The NiO have been demonstrated to be an interesting sensing material for chemical sensors because the sensing performance of NiO can be influenced by many factors such as crystalline structure, size, morphology, defects, and etc. To gain further insights into the gas-sensing properties, we conducted gas-sensing experiments on the three different NiO samples towards formaldehyde systematically. On the account of the fact that the operating temperature has a prominent effect on the gas-sensing property, the gas-sensing response was examined as a function of temperature upon exposure to 50 ppm of formaldehyde. The response sensitivity was defined as the resistance ratio Rgas/Rair, where Rair and Rgas were the electrical resistance of the sensors in air and in target gas, respectively. As shown in Fig. 6a, the response curves of the three sensors exhibit the same variation trend in the testing temperature range of 180–300 °C. When the working temperature was 180 °C, the sensor prepared with S600 has little response (2.5) to formaldehyde gas while the S400 and the S500 sensor show higher response with the sensitivity of 6.0 and 7.3, respectively. Then, as the working temperature increasing, the response sensitivities were initially increased, then peaked at 250 °C and finally decreased with a further increasing in the temperature. As is known, the gas-sensing of oxide semiconductors is essentially based on the change in resistance of sensing materials in different gas surroundings, which is primarily caused by the adsorption and desorption of gas molecules and their reaction with the oxygen species on the surface of the sensing material.6,7 At a low temperature, the formaldehyde molecules cannot be activated effectively to react with the surface absorbed oxygen species sufficiently, thus a relative low response was observed.33,34 Then when the operating temperature increased, the formaldehyde molecules can obtain sufficient energy to react with the surface absorbed oxygen species, leading to a higher response. However, the adsorption of formaldehyde molecules on the sensing materials became more difficult on further increasing the temperature, thus resulting in a lower response. The highest sensitivity of the sensors to 50 ppm of formaldehyde was measured at 250 °C, which was 8.8, 11.6 and 4.8 for sample S400, S500, and S600, respectively. Thus, 250 °C was chosen as the optimum working temperature to proceed with subsequent experiments. Fig. 6b illustrates the gas response of the three sensors at 250 °C to 50 ppm of various combustible or toxic gases, including formaldehyde, acetone, acetic acid, ethanol, ammonia, acetaldehyde, carbon disulfide, and benzene. Obviously, the sensitivity of the three sensors follow the same sequence of samples S500 > S400 > S600 no matter the testing temperature and the kind of the gases. In addition, it can be seen that although all the sensors showed little response to ethanol, ammonia, acetaldehyde, carbon disulfide, and benzene (the sensitivity was all smaller than 4.2), the sensors show relative high response to acetone, acetic acid, and formaldehyde, indicating that the selectivity of the sensors was still need further improvement. The sensors show the highest response to formaldehyde, and thus formaldehyde was chosen as the target gas to investigate the gas-sensing properties of the as-obtained NiO nanostructures.
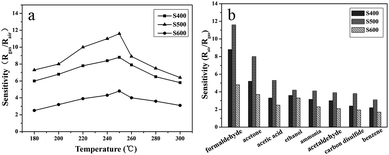 |
| | Fig. 6 Gas sensitivities of three NiO samples measured at different operating temperatures to 50 ppm of formaldehyde (a), and selectivity of the three samples sensor on successive exposure to 50 ppm of eight different gases at 250 °C (b). | |
The dynamic response–recovery curves of the three sensors prepared with the NiO samples annealed at different temperatures against formaldehyde concentration (1–200 ppm) at 250 °C are shown in Fig. 7a. The curves recorded the sensor resistance and it can be seen clearly that the sensor resistance increased dramatically when the gas was in and gradually approached steady and then decreased immediately to recover its initial value when the gas was out, indicating the rapid switching dynamics of the sensors to formaldehyde. The response and recovery time of the sensor based on sample S500 toward 50 ppm of formaldehyde at 250 °C was calculated to be 10 s and 18 s, respectively according to the response–recovery curves shown in Fig. 7a. Fig. 7b shows the corresponding relationship between the sensor response and the concentration of formaldehyde gas. It can be seen that the response of all the three sensors increased sharply with the increase of gas concentration indicating the wide detection range of all the NiO-based sensors to formaldehyde ranging from 1 to 200 ppm. For the sensor based on sample S500, the sensitivity was about 2.3 at a low concentration of 1 ppm of formaldehyde, while the response was up to 22.7 to 200 ppm formaldehyde. Compared with those NiO based HCHO sensors reported previously (Table 2), the formaldehyde sensing performance of the presented sensor based on the porous NiO nanotetrahedra (especially S500) possessed a considerable advantage in gas-sensing response. In practical applications, the repeatability of the sensor device is one of the most important parameters. Fig. 8a presents the five cycle gas response and recovery curves of the three sensors to 50 ppm of formaldehyde at 250 °C. The gas response and recovery were nearly constant after 5 continuous cyclic tests, suggesting the good repeatability properties of the sensor. Moreover, to verify the stability of the as-prepared sensor sensors, the response to 50 ppm of HCHO was measured every ten days after the previous measurement under the fixed experimental condition. As shown in Fig. 8b, the response values show little change over more than fifty days, indicating that the NiO sensing nanomaterials possessed good long-term stability.
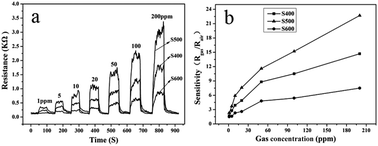 |
| | Fig. 7 Dynamic response curves of the three sensors to formaldehyde with concentration ranging from 1 to 200 ppm at 250 °C (a), and relationships between the sensitivities of the three sensors and formaldehyde concentration (b). | |
Table 2 Comparison of the gas-sensing performances of different NiO nanostructures based sensors toward formaldehyde
| Sensor materials |
Concentration (ppm) |
Temperature (°C) |
Sensitivity |
References |
| NiO nanotetrahedra (S500) |
5 |
250 |
3.7 |
This work |
| 50 |
250 |
11.6 |
| 200 |
250 |
22.7 |
| NiO thin film |
5 |
340 |
2.2 |
26 and 27 |
| Porous NiO nanosheets |
50 |
240 |
2.1 |
18 |
| Hierarchical NiO hollow microspheres |
100 |
350 |
1.3 |
21 |
| Flower-like NiO hierarchical microspheres |
100 |
250 |
2.8 |
22 |
| Nanoparticles-assembled chain-like NiO architectures |
50 |
210 |
3.7 |
32 |
| Curly porous NiO nanosheets |
50 |
240 |
3.5 |
35 |
| Mesoporous NiO |
380 |
300 |
20.6 |
36 |
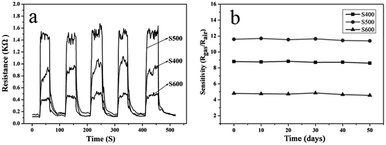 |
| | Fig. 8 Response and recovery curves of the sensor to 50 ppm of formaldehyde after 5 cycles of gas on and off at 250 °C (a), and stability of the three sensors to 50 ppm of formaldehyde at 250 °C (b). | |
3.3 Gas-sensing mechanism
For the p-type semiconductor with hole carriers, for example NiO, the adsorption of the oxygen molecules from the ambient atmosphere results in the accumulation of holes near the surface by extracting electrons to form oxidizing oxygen species including O2(ads)−, 2O(ads)−, and 2O(ads)2−.22,37 As shown in Fig. 9a, this process would promote the formation of a hole-rich layer on the surface of the sensing material and thus the sensor device shows a relatively low resistance in air ambient. Then, when formaldehyde or a similar reducing gas was injected into the test chamber, these gas molecules will adsorb on the surface of the gas-sensing materials and react with the adsorbed oxygen species on the surface of NiO, which will release the trapped electrons back into NiO and neutralizes the hole carriers in the surface layer by electron–hole recombination (Fig. 9b). Therefore, the measured resistance of the sensor increases in the presence of reducing gases.
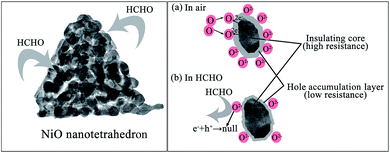 |
| | Fig. 9 Schematic illustration of the sensing mechanism of NiO nanotetrahedra based sensor to HCHO: in air (a) and in HCHO (b), respectively. | |
Usually, the sensitivity of the semiconductor oxide gas sensor can be empirically represented as:8,38,39
where
a and
b are constant depending on the sensor material and the type of gas sensor. The constant component
b has an ideal value of either 0.5 or 1, depending on the charge of the surface oxygen ion species and the stoichiometry of the elementary reactions on the exterior. Normally, the value of
b was of around 0.5 for O
2− and 1 for O
−.
40,41 Thus, the oxygen ion species on the surface of the NiO sensor can be speculated by obtaining the value of constant
b.
Eqn (1) can be written as:
| |
log(Sg − 1) = log![[thin space (1/6-em)]](https://www.rsc.org/images/entities/char_2009.gif) a + b a + b![[thin space (1/6-em)]](https://www.rsc.org/images/entities/char_2009.gif) log log![[thin space (1/6-em)]](https://www.rsc.org/images/entities/char_2009.gif) Cg Cg
| (2) |
Obviously, log(Sg − 1) has a linear relation with log![[thin space (1/6-em)]](https://www.rsc.org/images/entities/char_2009.gif) Cg, while the slope equals to the value of constant b. Fig. 10 shows the plot of log (Sg − 1) and log
Cg, while the slope equals to the value of constant b. Fig. 10 shows the plot of log (Sg − 1) and log![[thin space (1/6-em)]](https://www.rsc.org/images/entities/char_2009.gif) Cg for the three NiO sensors tested at 250 °C under HCHO atmosphere. The fitted equations and corresponding b values for the three NiO sensors are summarized in Table 3. Interestingly, the b values for all the three sensors were around 0.5, suggesting that the oxygen ion at the surface of NiO at 250 °C is O2−. The deviation from ideal value of 0.5 was probably due to the effect of element randomness in the NiO nanostructures.39
Cg for the three NiO sensors tested at 250 °C under HCHO atmosphere. The fitted equations and corresponding b values for the three NiO sensors are summarized in Table 3. Interestingly, the b values for all the three sensors were around 0.5, suggesting that the oxygen ion at the surface of NiO at 250 °C is O2−. The deviation from ideal value of 0.5 was probably due to the effect of element randomness in the NiO nanostructures.39
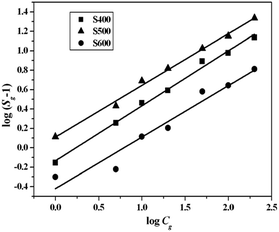 |
| | Fig. 10 Linear correlation between the log![[thin space (1/6-em)]](https://www.rsc.org/images/entities/char_2009.gif) (Sg − 1) and the log (Sg − 1) and the log![[thin space (1/6-em)]](https://www.rsc.org/images/entities/char_2009.gif) Cg for the three NiO samples to HCHO gas. Cg for the three NiO samples to HCHO gas. | |
Table 3 Linear equations relating log(Sg − 1) and log![[thin space (1/6-em)]](https://www.rsc.org/images/entities/char_2009.gif) Cg for the three NiO samples to HCHO gas
Cg for the three NiO samples to HCHO gas
| Sample |
Linear relationship eqn |
b value (charge parameter) |
| S400 |
y = 0.53269x + 0.1107 |
0.53269 |
| S500 |
y = 0.56646x − 0.13397 |
0.56646 |
| S600 |
y = 0.53082x − 0.42086 |
0.53082 |
According to the above discussion, the gas-sensing mechanism of the NiO sensor to HCHO can be expressed by the following equations:42,43
In Air:
| | |
O2(ads) + e− → O2(ads)−
| (4) |
| | |
O2(ads)− + e− → 2O(ads)−
| (5) |
| | |
O(ads)− + e− → O(ads)2−
| (6) |
In HCHO gas atmosphere:
| | |
HCHO + 2O(ads)2− → CO2 + H2O + 4e−
| (7) |
The gas-sensing is a surface-related reaction procedure and the gas-sensing performance of sensor depends largely on the surface structure of the sensing materials, including their surface area, pore size, exposed facets of the materials, and crystallinity or defects in the crystal structure. Both a large specific surface area and a large pore size can be benefit for enhancing the gas response. A larger specific surface area can normally promote the adsorption/desorption interaction between the gas molecules and the semiconductor surface.24,44 A larger pore size means a higher diffusion rate of both oxygen and detected gas molecules in the materials, which would enable gas molecules to reach deeper region of the gas-sensing material and increase the effective surface area for gas-sensing reaction.45,46 However, the surface area and pore size are not the unique influencing parameter but an increasing tendency for the sensitivity. Except for surface area and pore size, exposed facets, crystallinity or defects in the crystal structure also have important effects on the sensitivity of the products.8,47 Herein, it should be noted that to a definite concentration of HCHO the sensitivity of the three sensors follows a sequence of sample S500 > S400 > S600, which is not exactly proportional to their surface areas. For example, the response of sample S500 with a medium specific surface area of 52.6 m2 g−1 and larger average pore size of 18.9 nm exhibits a higher response (22.7 to 200 ppm HCHO) than sample S400 with a much higher specific surface area of 114.8 m2 g−1 and smaller average pore size of 7.5 nm (the response is 14.7 to 200 ppm HCHO). Thus, other factors may be responsible for the gas sensitivity of the NiO samples. As for the p-type metal oxide semiconductors, the p-type characteristics are usually attributed to the cation vacancies. The gas sensitivity of p-type metal oxide semiconductors is believed to depend largely on the concentration of the cation defects related vacancy, because the abundant numbers of cation vacancies can act as the dominative active sites participating in the gas–solid reaction and enhance the gas response.48 As is known, NiO is nonstoichiometry, in which vacancies occur in cation sites and according to the defect formation energy, the nickel vacancy is preferred to form when the NiO is annealed in air.49 To gain further insights into the gas-sensing mechanism of the NiO products, X-ray photoelectron spectroscopy (XPS) technique was used to identify the surface compositions and chemical states of the NiO samples. Fig. 11a–c show the Ni 2p3/2 core level signal of the three samples, respectively. The Ni 2p3/2 signal can be deconvoluted into three peaks centered at about 854 eV, 856 eV, and 861 eV. The Ni 2p3/2 peak at about 854 eV can be assigned to the Ni(II) ions in the NiO samples, which is matched well with the value of pure NiO (854.2 eV). The peak at about 856 eV can be attributed to the Ni3+ species on the NiO surface, indicating the presence of nickel vacancy in the sample.50 In addition, the presence of nickel vacancy can be reflected in the O 1s spectra due to a larger difference of Ni2+ and Ni3+ chemical bonds.51 Fig. 11b–d show the O 1s XPS peaks of the three samples, which can be deconvoluted into three Gaussian components centered at about 529 eV (OL), 531 eV (OV), and 532 eV (OC), respectively.44,52,53 The OL component is attributed to O2− ions binding with Ni2+ in the NiO lattice, while the OV and OC components are assosiated with O2− ions binding with Ni3+ (deficient regions) and chemisorbed oxygen species or OH, respectively. Therefore, we can estimate the relative amount of nickel vacancy in the NiO annealed at different temperatures and the oxygen-chemisorbed ability of the three samples according to the intensity of OV and OC components in the O 1s XPS peak. The relative percentages of the OL, OV and OC for the three NiO samples are calculated and listed in Table 4. Apparently, the relative percentage of OC follows the sequence of S400 ≫ S500 > S600, which is consistent with the sequence of the BET specific surface area, while the relative percentage of OV component follows the sequence of S500 > S600 ≫ S400, indicating that the relative amount of nickel vacancies in the sample S500 and S600 was larger than S400. For the three different samples, the relative percentages of the Ov and Oc components are about 50.39% (S400), 51.56% (S500), and 45.18% (S600), respectively, matched well with the sequence of gas-sensing performance of the three samples. From the above analysis, it can be concluded that both the specific surface area and the concentration of nickel vacancy concentration contribute to the gas-sensing performance of the NiO. The specific surface area of the NiO decreases significantly with the increasing of the annealing temperature, while the amount of the nickel vacancies in the NiO increases with the annealing temperature. Then, the gas-sensing superiority of sample S500 over sample S400 and S600 can be understood, because relative larger specific surface area (52.6 m2 g−1) and relative higher nickel vacancies concentration can offer more effective active sites for formaldehyde adsorption. Meanwhile, relative larger pore size (18.9 nm) for sample S500 would provide an efficient transport pathway for gas molecules to the interior surface of the NiO sensor, which is also beneficial for gas-sensing properties.46 Although having lower nickel vacancies concentration, the specific surface area of sample S400 (114.8 m2 g−1) was much larger than that of sample S600 (22.4 m2 g−1), thus the sensitivity of S400 was higher than that of S600, because the gas-sensing process is first based on the adsorption and desorption of testing gas on the surface of the NiO material, and a larger surface area can provide more surface sites for gas adsorption, desorption and reaction.
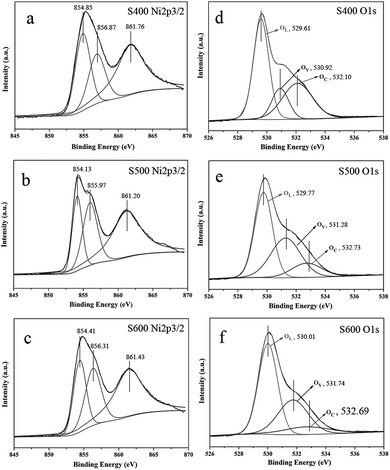 |
| | Fig. 11 Ni 2p3/2 XPS spectra (a, b, c) and O 1s XPS spectra (d, e, f) of the three samples: (a, d) S400, (b, e) S500, (c, f) S600. | |
Table 4 Fitting results of O 1s XPS spectra of the three NiO samples
| Sample |
Oxygen species |
Binding energy (eV) |
Relative percentage (%) |
| S400 |
OL (Ni–O) |
529.61 |
49.61 |
| Ov (vacancy) |
530.92 |
16.48 |
| OC (chemisorbed) and –OH |
532.10 |
33.91 |
| S500 |
OL (Ni–O) |
529.77 |
48.44 |
| Ov (vacancy) |
531.28 |
37.75 |
| OC (chemisorbed) and –OH |
532.73 |
13.81 |
| S600 |
OL (Ni–O) |
530.01 |
54.82 |
| Ov (vacancy) |
531.74 |
33.78 |
| OC (chemisorbed) and –OH |
532.69 |
11.40 |
4. Conclusions
In summary, NiO nanostructures have been successfully synthesized via annealing the tetrahedron-like Ni(HCO3)2 precursor under air atmosphere, which was prepared by a convenient and environmental friendly solvothermal route using the mixture of ethylene glycol and distilled water as solvent. The porous NiO products obtained by annealing at lower temperature (400 °C and 500 °C) inherited the tetrahedron-like morphology of the precursor and were composed of primary NiO nanoparticles with size increasing with annealing temperature. The gas-sensing characteristics of the NiO nanostructures obtained by annealing at different temperatures were investigated, revealing that NiO products exhibited high sensitivity and stability towards HCHO at 250 °C, which may have great potential in practical applications. Among the three samples, the NiO tetrahedra with larger pore size (sample S500) showed the best gas-sensing performance, demonstrating that the gas-sensing performance varied depending on the defects in the nanocrystals and pore size of the samples rather than on the specific surface area itself.
Conflicts of interest
There are no conflicts to declare.
Acknowledgements
This work was supported by the National Training Programs of Innovation and Entrepreneurship for Undergraduates (no. 201610065024), the National Natural Science Foundation of China (no. 21001081, and 21303122), and the Program for Innovative Research Team in University of Tianjin (No. TD 12-5038).
Notes and references
- G. J. Mohr, U. E. Spichiger, W. Jona and H. Langhals, Anal. Chem., 2000, 72, 1084–1087 CrossRef CAS PubMed.
- Y. Suzuki, N. Nakano and K. Suzuki, Environ. Sci. Technol., 2003, 37, 5695–5700 CrossRef CAS PubMed.
- M. Plaza, S. Santoyo, L. Jaime, G. Garcia-Blairsy Reina, M. Herrero, F. J. Senorans and E. Ibanez, J. Pharm. Biomed. Anal., 2010, 51, 450–455 CrossRef CAS PubMed.
- X. Zhou, S. Lee, Z. Xu and J. Yoon, Chem. Rev., 2015, 115, 7944–8000 CrossRef CAS PubMed.
- L. Feng, C. J. Musto and K. S. Suslick, J. Am. Chem. Soc., 2010, 132, 4046–4047 CrossRef CAS PubMed.
- D. R. Miller, S. A. Akbar and P. A. Morris, Sens. Actuators, B, 2014, 204, 250–272 CrossRef CAS.
- H. J. Kim and J. H. Lee, Sens. Actuators, B, 2014, 192, 607–627 CrossRef CAS.
- J. Zhang, D. Zeng, Q. Zhu, J. Wu, Q. Huang and C. Xie, J. Phys. Chem. C, 2016, 120, 3936–3945 CAS.
- K. K. Purushothaman, I. M. Babu, B. Sethuraman and G. Muralidharan, ACS Appl. Mater. Interfaces, 2013, 5, 10767–10773 CAS.
- J. Park, E. Kang, S. Son, H. Park, M. Lee, J. Kim, K. Kim, H. Noh, J. Park, C. Bae, J. Park and T. Hyeon, Adv. Mater., 2005, 17, 429–434 CrossRef CAS.
- A. Caballero, L. Hernán and J. Morales, Energy Fuels, 2013, 27, 5545–5551 CrossRef CAS.
- J. H. Pan, Q. Huang, Z. Y. Koh, D. Neo, X. Z. Wang and Q. Wang, ACS Appl. Mater. Interfaces, 2013, 5, 6292–6299 CAS.
- C. J. Flynn, E. E. Oh, S. M. McCullough, R. W. Call, C. L. Donley, R. Lopez and J. F. Cahoon, J. Phys. Chem. C, 2014, 118, 14177–14184 CAS.
- X. Song, L. Gao and S. Mathur, J. Phys. Chem. C, 2011, 115, 21730–21735 CAS.
- A. M. Soleimanpour, S. V. Khare and A. H. Jayatissa, ACS Appl. Mater. Interfaces, 2012, 4, 4651–4657 CAS.
- A. Aslania, V. Oroojpoura and M. Fallahi, Appl. Surf. Sci., 2011, 257, 4056–4061 CrossRef.
- A. Khalil, J. J. Kim, H. L. Tuller, G. C. Rutledge and R. Hashaikeh, Sens. Actuators, B, 2016, 227, 54–64 CrossRef CAS.
- G. Li, X. Wang, H. Ding and T. Zhang, RSC Adv., 2012, 2, 13018–13023 RSC.
- N. D. Hoa and S. A. El-Safty, Chem.–Eur. J., 2011, 17, 12896–12901 CrossRef CAS PubMed.
- J. Zhang, D. Zeng, Q. Zhu, J. Wu, K. Xu, T. Liao, G. Zhang and C. Xie, J. Phys. Chem. C, 2015, 119, 17930–17939 CAS.
- G. Zhu, C. Xi, H. Xu, D. Zheng, Y. Liu, X. Xu and X. Shen, RSC Adv., 2012, 2, 4236–4241 RSC.
- X. San, G. Wang, B. Liang, J. Ma, D. Meng and Y. Shen, J. Alloys Compd., 2015, 636, 357–362 CrossRef CAS.
- F. Yang and Z. Guo, J. Colloid Interface Sci., 2016, 467, 192–202 CrossRef CAS PubMed.
- B. Miao, W. Zeng, L. Lin and S. Xu, Phys. E, 2013, 52, 40–45 CrossRef CAS.
- J. Choi, J. Byun and S. S. Kim, Sens. Actuators, B, 2016, 227, 149–156 CrossRef CAS.
- I. Castro-Hurtado, C. Malagù, S. Morandi, N. Perez, G. G. Mandayo and E. Castanõ, Acta Mater., 2013, 61, 1146–1153 CrossRef CAS.
- I. Castro-Hurtado, J. Herrán, G. G. Mandayo and E. Castaño, Thin Solid Films, 2011, 520, 947–952 CrossRef CAS.
- W. Zhou, M. Yao, L. Guo, Y. Li, J. Li and S. Yang, J. Am. Chem. Soc., 2009, 131, 2959–2964 CrossRef CAS PubMed.
- C. Wang, Y. Zhao, D. Su, C. Ding, L. Wang, D. Yan, J. Li and H. Jin, Electrochim. Acta, 2017, 231, 272–278 CrossRef CAS.
- X. Wang, L. Yu, P. Hu and F. Yuan, Cryst. Growth Des., 2007, 7, 2415–2418 CAS.
- Y. Lu, Y. H. Ma, S. Y. Ma, W. X. Jin, S. H. Yan, X. L. Xu, X. H. Jiang, T. T. Wang, H. M. Yang, H. Che and Z. Qiang, Mater. Lett., 2016, 164, 48–51 CrossRef CAS.
- J. Cao, H. Zhang and X. Yan, Mater. Lett., 2016, 185, 40–42 CrossRef CAS.
- Y. Xu, D. Sun, H. Hao, D. Gao and Y. Sun, RSC Adv., 2016, 6, 98994–99002 RSC.
- X. Zhou, J. Liu, C. Wang, P. Sun, X. Hu, X. Li, K. Shimanoe, N. Yamazoe and G. Lu, Sens. Actuators, B, 2015, 206, 577–583 CrossRef CAS.
- Y. Lu, Y. H. Ma, S. Y. Ma, W. X. Jin, S. H. Yan, X. L. Xu and Q. Chen, Mater. Lett., 2017, 190, 252–255 CrossRef CAS.
- X. Lai, G. Shen, P. Xue, B. Yan, H. Wang, P. Li, W. Xia and J. Fang, Nanoscale, 2015, 7, 4005–4112 RSC.
- N. Barsan and U. Weimar, J. Electroceram., 2001, 7, 143–167 CrossRef CAS.
- J. Li, H. Fan and X. Jia, J. Phys. Chem. C, 2010, 114, 14684–14691 CAS.
- R. W. J. Scott, S. M. Yang, G. Chabanis, N. Coombs, D. E. Williams and G. A. Ozin, Adv. Mater., 2001, 13, 1468–1472 CrossRef CAS.
- E. Wongrat, P. Pimpang and S. Choopun, Appl. Surf. Sci., 2009, 256, 968–971 CrossRef CAS.
- D. E. Williams, Sens. Actuators, B, 1999, 57, 1–16 CrossRef CAS.
- N. Hongsith, E. Wongrat, T. Kerdcharoen and S. Choopun, Sens. Actuators, B, 2010, 144, 67–72 CrossRef CAS.
- T. Santhaveesuk, D. Wongratanaphisan and S. Choopun, Sens. Actuators, B, 2010, 147, 502–507 CrossRef CAS.
- W. Zeng, T. M. Liu, D. J. Liu and E. J. Han, Sens. Actuators, B, 2011, 160, 455–462 CrossRef CAS.
- M. Tiemann, Chem.–Eur. J., 2007, 13, 8376–8388 CrossRef CAS PubMed.
- S. Tian, X. Ding, D. Zeng, S. Zhang and C. Xie, Sens. Actuators, B, 2013, 186, 640–647 CrossRef CAS.
- J. Ouyang, J. Pei, Q. Kuang, Z. Xie and L. Zheng, ACS Appl. Mater. Interfaces, 2014, 6, 12505–12514 CAS.
- G. Zhang, C. Xie, S. Zhang, S. Zhang and Y. Xiong, J. Phys. Chem. C, 2014, 118, 18097–18109 CAS.
- B. Subramanian, M. Mohamed Ibrahim, V. Senthilkumar, K. R. Murali, V. S. Vidhya, C. Sanjeeviraja and M. Jayachandran, Phys. B, 2008, 403, 4104–4110 CrossRef CAS.
- M. J. Tomellini, J. Electron Spectrosc. Relat. Phenom., 1992, 58, 75–78 CrossRef CAS.
- S. Oswald and W. Brückner, Surf. Interface Anal., 2004, 36, 17–22 CrossRef CAS.
- J. C. Dupin, D. Gonbeau, P. Vinatier and A. Levasseur, Phys. Chem. Chem. Phys., 2000, 2, 1319–1324 RSC.
- M. Wang, Y. Wang, J. Liu, C. Pei, B. Liu, Y. Yuan, H. Zhao, S. Liu and H. Yang, Sens. Actuators, B, 2017, 250, 208–214 CrossRef CAS.
|
| This journal is © The Royal Society of Chemistry 2017 |
Click here to see how this site uses Cookies. View our privacy policy here.  Open Access Article
 * and
Yaqiu Sun


![[2 with combining macron]](https://www.rsc.org/images/entities/char_0032_0304.gif) 2) planes and their equivalent planes. Fig. 4c, f and i show the high-resolution TEM (HRTEM) images recorded on the corresponding section marked with white rectangles in Fig. 4b, e and h. Clear lattice fringes could be observed, indicating the good crystallinity of the products. The interplanar distances in the HRTEM image of sample S400 (Fig. 4c) were measured to be 0.24 nm and 0.21 nm, corresponding to the (111) and (200) planes of the cubic phase NiO, respectively. The interplanar distances of 0.24 nm observed in Fig. 4f of sample S500 can be indexed to the (111) plane of the NiO. For sample S600 (Fig. 4i), clear lattice fringes with the interplanar distance of 0.21 nm can be observed, which corresponded to (200) planes of NiO.
2) planes and their equivalent planes. Fig. 4c, f and i show the high-resolution TEM (HRTEM) images recorded on the corresponding section marked with white rectangles in Fig. 4b, e and h. Clear lattice fringes could be observed, indicating the good crystallinity of the products. The interplanar distances in the HRTEM image of sample S400 (Fig. 4c) were measured to be 0.24 nm and 0.21 nm, corresponding to the (111) and (200) planes of the cubic phase NiO, respectively. The interplanar distances of 0.24 nm observed in Fig. 4f of sample S500 can be indexed to the (111) plane of the NiO. For sample S600 (Fig. 4i), clear lattice fringes with the interplanar distance of 0.21 nm can be observed, which corresponded to (200) planes of NiO.


![[thin space (1/6-em)]](https://www.rsc.org/images/entities/char_2009.gif) a + b
a + b![[thin space (1/6-em)]](https://www.rsc.org/images/entities/char_2009.gif) log
log![[thin space (1/6-em)]](https://www.rsc.org/images/entities/char_2009.gif) Cg
Cg
![[thin space (1/6-em)]](https://www.rsc.org/images/entities/char_2009.gif) Cg, while the slope equals to the value of constant b. Fig. 10 shows the plot of log (Sg − 1) and log
Cg, while the slope equals to the value of constant b. Fig. 10 shows the plot of log (Sg − 1) and log![[thin space (1/6-em)]](https://www.rsc.org/images/entities/char_2009.gif) Cg for the three NiO sensors tested at 250 °C under HCHO atmosphere. The fitted equations and corresponding b values for the three NiO sensors are summarized in Table 3. Interestingly, the b values for all the three sensors were around 0.5, suggesting that the oxygen ion at the surface of NiO at 250 °C is O2−. The deviation from ideal value of 0.5 was probably due to the effect of element randomness in the NiO nanostructures.39
Cg for the three NiO sensors tested at 250 °C under HCHO atmosphere. The fitted equations and corresponding b values for the three NiO sensors are summarized in Table 3. Interestingly, the b values for all the three sensors were around 0.5, suggesting that the oxygen ion at the surface of NiO at 250 °C is O2−. The deviation from ideal value of 0.5 was probably due to the effect of element randomness in the NiO nanostructures.39
![[thin space (1/6-em)]](https://www.rsc.org/images/entities/char_2009.gif) (Sg − 1) and the log
(Sg − 1) and the log![[thin space (1/6-em)]](https://www.rsc.org/images/entities/char_2009.gif) Cg for the three NiO samples to HCHO gas.
Cg for the three NiO samples to HCHO gas.![[thin space (1/6-em)]](https://www.rsc.org/images/entities/char_2009.gif) Cg for the three NiO samples to HCHO gas
Cg for the three NiO samples to HCHO gas


