
 Open Access Article
 This Open Access Article is licensed under a
 Creative Commons Attribution 3.0 Unported Licence
Localized double phonon scattering and DOS induced thermoelectric enhancement of degenerate nonstoichiometric Li1−xNbO2 compounds†
Jamil Ur Rahmanab,
Nguyen Van Duab,
Gul Rahmanc,
V. M. García-Suárezd,
Won-Seon Seoa,
Myong Ho Kimb and
Soonil Lee *a
*a
aEnergy & Environmental Materials Division, Korea Institute of Ceramic Engineering & Technology, Jinju 52861, Korea. E-mail: leesoonil@gmail.com; Fax: +82-55-792-2580; Tel: +82-55-792-2567
bSchool of Advanced Materials Engineering, Changwon National University, Changwon 51140, Korea
cDepartment of Physics, Quaid-i-Azam University, Islamabad 45320, Pakistan
dDepartamento de Física, Universidad de Oviedo, Nanomaterials and Nanotechnology Research Center-CINN, 33007 Oviedo, Spain
First published on 17th November 2017
Abstract
We report the synthesis and thermoelectric properties of a new p-type oxide thermoelectric material (Li1−xNbO2, with x = 0–0.6), in which Li-vacancies play a significant role in the enhancement of the thermoelectric performance. The electrical conductivity drastically increases due to Li-vacancies, resulting in an increase in the hole carrier concentration. A remarkable enhancement in the power factor is observed, which is comparable to well-known oxide thermoelectrics. The carrier concentration was not significantly dependent on the temperature, while the Hall mobility shows negative temperature-dependence. The Seebeck coefficient is linearly proportional to temperature, and the density of the state effective mass  was estimated by using the Pisarenko relation. The thermal conductivity was substantially reduced by Li-vacancies and Li-vacancy induced localized double phonon scattering. Density functional theory (DFT) calculations reveal that the enhancement of the thermoelectric properties is mainly due to the increase in the electronic density of states (DOS) at the Fermi energy, which increases with hole concentration. All of the samples after high-temperature measurements are highly stable, which suggests that the well-synthesized nonstoichiometric Li1−xNbO2 could be a new promising candidate material for high temperature thermoelectric applications.
1. Introduction
Thermoelectric (TE) materials are receiving increasing attention because of their promising prospects for extensive power generation applications.1,2 The efficiency of TE materials is governed by the dimensionless figure of merit, ZT, which is defined as ZT = (S2σ/κ)T, where S, σ, κ, and T are the Seebeck coefficient, electrical conductivity, thermal conductivity, and absolute temperature, respectively.3,4 The quantity of S2σ is defined as the power factor, which is important especially in power generation applications. Therefore, both the Seebeck coefficient (S) and the electrical conductivity (σ) must be large, while the thermal conductivity (κ) must be minimized for good thermoelectric devices.5 The thermal conductivity, κ = κlat + κele, consists of two components, namely κlat and κele, which are the lattice and electronic thermal conductivity, respectively. Various innovative families of thermoelectric materials have been discovered in the last few years, such as PbTe, SiGe, (Bi,Sb)2, clathrates, skutterudites and related semiconductors.5–7 However, the major problems with these materials are high cost, lack of thermal stability, and dependence on rare or toxic elements.8,9 To overcome these issues, oxide thermoelectric materials are considered to be the best choice, but the thermoelectric performance of oxide materials is still far from sufficient for practical applications.10,11 Therefore, it is important to search for new oxide materials with high TE properties. In this effort, numerous materials have been studied, but materials with layered structure (BiCuTeO and NaCoO2) are considered to be the best candidate materials for TE applications.11–14In resemblance to the highly studied layer-structured TE material, sodium cobalt oxide (NaCoO2), lithium niobium oxide (LiNbO2) has a layered structure, which could make it very interesting and suitable for both applications and research in the field of thermoelectrics. The most remarkable feature is that both NaCoO2 and LiNbO2 support superconductivity at temperature below 5.5 K,15–17 which presumably means that its structure could have the possibility of relatively high electrical conductivity at higher temperature. Similarly to NaxCoO2, LiNbO2 can be described as an alternate stacking along the c-axis of layers of LiO6 octahedra and layers of edge-sharing NbO6 trigonal prisms, as shown in the schematic Fig. 1.18,19 In the literature there is some disagreement about the band gap and electronic properties of stoichiometric LiNbO2 compound.20–22 In general, it is found that the dz2 band is completely occupied and the unoccupied part of conducting band is well separated from the lower one by 1.5 eV.21,23 Geselbracht et al. measured the optical reflectance, which shows an onset at 2 eV, and suggests that this material is a direct band gap semiconductor.20 On the other hand, the band structure calculations by Kellerman et al. suggest that the stoichiometric LiNbO2 is metallic or semi-metallic at low temperature.24 In case of the nonstoichiometric compound, the octahedral sites are somewhat flexible with respect to the Li-vacancies. These delithiated octahedral sites make it suitable for superconducting applications.25–27 Furthermore, the partial removal of Li has the effect of adding holes to the conduction band, made up of Nb dz2 states, which results in the oxidation of the niobium atoms and an a increase in the density of states at the Fermi level (just like when holes are introduced into NaCoO2). In addition to this, the removal of Li-atoms leads to a decrease of the distance between the niobium and oxygen, which results in a transition from direct to an indirect band structure.28 Based on the above discussion, it is expected that Li-vacancies (intrinsic defects, which cannot be ignored) would increase the carriers, which will give rise to increased electrical conductivity. Additionally, the intrinsic defects in Li1−xNbO2 would play as a scattering center for thermal conductivity. Therefore, defected Li1−xNbO2 is expected to be highly beneficial for thermoelectric applications because for enhanced thermoelectric properties higher electrical and low thermal conductivity are required.
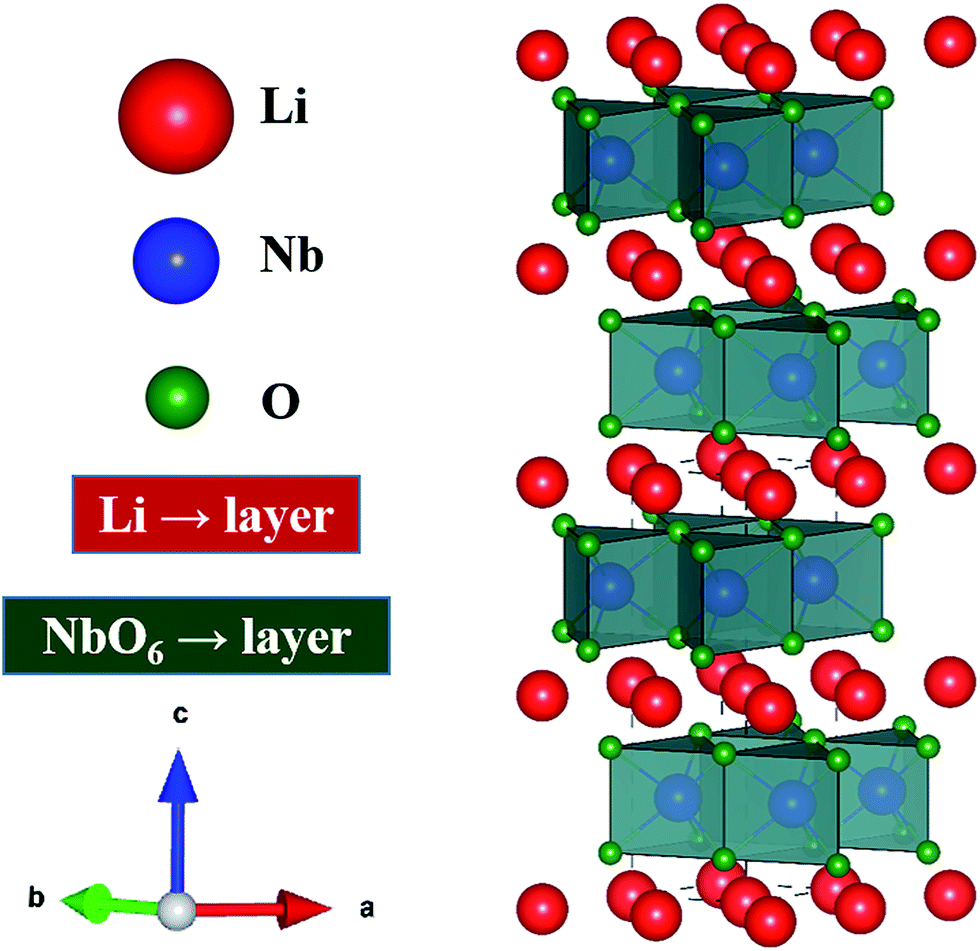 | ||
| Fig. 1 Schematic crystal structure of LiNbO2 with layers of trigonal-prismatic NbO6 separated by sheets of mobile Li-ions. | ||
The main goal of the present work is to design nonstoichiometric Li1−xNbO2 through a new experimental route, investigate its thermoelectric properties, and understand the role of Li vacancy in the enhancement of the thermoelectric properties using atomistic calculations based on density functional theory.29 In the literature the synthesis of Li1−xNbO2 through chemical and solid state reaction (SSR) have been reported.20,23,26,30 However, bulk density and thermal stability are the main factors which limit the synthesis of nonstoichiometric Li1−xNbO2 for thermoelectric applications. To overcome these issues, in this work for the first time nonstoichiometric Li1−xNbO2 samples were synthesized through spark plasma sintering (SPS), which significantly enhances the thermoelectric properties compared to our previous work on Li1−xNbO2, where samples were synthesized using ordinary solid state reaction (SSR).31 Moreover, this material could open up new possibilities and new material exploration in the field of thermoelectrics. By using the SPS technique, the in situ reaction between the elemental powders and their subsequent consolidation takes place in a single step within a few minutes with high density, Li-vacancies are dominant and enhanced thermoelectric transport properties. The structure and charge transport properties calculated with DFT are quite consistent with our experimental observations. The increase of Li-vacancies in the nonstoichiometric Li1−xNbO2 increases the hole concentration, as expected, resulting in a significant increase in the electrical conductivity of Li1−xNbO2. The charge transport mechanism of Li1−xNbO2 was characterized up to 970 K by using a Hall measurement system, and interestingly it was found that the Li-vacancies change the scattering mechanism in the Li1−xNbO2 system. The relation between the charge transport and the thermoelectric properties in Li1−xNbO2 was discussed by using the classical Pisarenko relation.
2. Experimental and computational methods
2.1. Synthesis
Li1−xNbO2 (x = 0–0.6) compounds were synthesized by using solid-state reaction method. Li2CO3 (99.99%), Nb2O5 (99.99%) and NbO (99.99%) powders commercially available reagent-grade oxide and carbonates were used as starting materials. First, Li3−yNbO4 was obtained by heating a mixture of Li2CO3 and Nb2O5 in a molar ratio of 3 − y![[thin space (1/6-em)]](https://www.rsc.org/images/entities/char_2009.gif) :1 (y = 0, 0.015, 0.3, 0.6, 0.9, 1.2 and 1.8) at 900 °C in air for 50 h. Li1−xNbO2 (x = 0–0.6) was obtained by mixing Li3−yNbO4 (y = 0, 0.015, 0.3, 0.6, 0.9, 1.2 and 1.8) for corresponding x = (0, 0.05, 0.1, 0.2, 0.4 and 0.6), respectively, and NbO in a molar ratio of 1:2. The mixture of the powders was ball-milled for 24 h in ethanol as the solvent and zirconia balls as the milling media. The dried slurries were pulverized and loaded into a graphite mold of 12.5 mm and placed into the sintering chamber. Graphite foils were used to diffuse electric current efficiently through the sample during the sintering process. The mold was heated up to 1323 K under 50 MPa of pressure for 15 min in a 10−3 torr vacuum with a heating rate of 100 °C min−1, which are the optimum parameters for optimum density and phase in this work. After the sintering, the graphite foils were fully removed by using a diamond cutter and confirmed that the interior and exterior of the samples were equally annealed.
:1 (y = 0, 0.015, 0.3, 0.6, 0.9, 1.2 and 1.8) at 900 °C in air for 50 h. Li1−xNbO2 (x = 0–0.6) was obtained by mixing Li3−yNbO4 (y = 0, 0.015, 0.3, 0.6, 0.9, 1.2 and 1.8) for corresponding x = (0, 0.05, 0.1, 0.2, 0.4 and 0.6), respectively, and NbO in a molar ratio of 1:2. The mixture of the powders was ball-milled for 24 h in ethanol as the solvent and zirconia balls as the milling media. The dried slurries were pulverized and loaded into a graphite mold of 12.5 mm and placed into the sintering chamber. Graphite foils were used to diffuse electric current efficiently through the sample during the sintering process. The mold was heated up to 1323 K under 50 MPa of pressure for 15 min in a 10−3 torr vacuum with a heating rate of 100 °C min−1, which are the optimum parameters for optimum density and phase in this work. After the sintering, the graphite foils were fully removed by using a diamond cutter and confirmed that the interior and exterior of the samples were equally annealed.
2.2. Theoretical calculations
The electronic structure of Li1−xNbO2 was investigated using density functional theory (DFT) with the local density approximations,32 as implemented in the Quantum Espresso (QE) code.33 The lattice parameters of Li1−xNbO2 were determined through total energy calculations, and all the atomic positions of Li, Nb, and O atoms were relaxed until the forces on all ions were converged to less than 0.01 eV Å−1. To simulate Li vacancies, different supercells (1 × 1 × 1, 1 × 1 × 2, 2 × 2 × 1, and 2 × 2 × 2) were considered. For the thermoelectric properties, the BolzTraP program,34 based on the Boltzmann transport theory with a constant relaxation time, was used.35 First we calculated the band structure with the QE code, from which we obtained the energy dispersion relation E(n,k) as a function of wave vector k and band index n. Then we used the Boltztrap code to calculate thermoelectric properties such as the electrical conductivity σ and the Seebeck coefficient S.2.3. Characterization
X-ray diffraction analysis of the bulk samples was carried along the length of the samples using Rigaku D/MAX-2500/PC with Cu Kα radiation. The current and operating voltage were kept 45 mA and 40 kV, respectively. The fractographs of the samples were observed using field emission scanning electron microscope (FESEM, Model). Rectangular specimens (2 × 2 × 10 mm3) were cut for the evaluation of Seebeck coefficient and electrical conductivity, which were measured by using a four-point probe method (TPMS, ZEM-3, ULVAC-RIKO). High-temperature charge transport properties were measured up to 970 K by using a high-temperature Hall measurement system (HT-Hall, Toyo Corporation, ResiTest 8400) with a magnetic field of 0.57 T. A circular disc sample of 12.5 mm diameter and 1.5 mm in thickness was used for thermal diffusivity measurement by using a laser flash method (DLF-1300, TA instrument). The density was measured by using Archimedes principle and found that all samples have about ≥95% of the theoretical density. Finally, thermal conductivity (κ) was calculated from the relation, thermal diffusivity (α) × specific heat capacity (Cp) × density (ρ).3. Results and discussion
Fig. 2(a) shows the X-ray diffraction (XRD) patterns of Li1−xNbO2 (x = 0, 0.05, 0.1, 0.2, 0.4 and 0.6). The main diffraction peaks can be indexed to the LiNbO2 hexagonal layer structure with the space group P63/mmc (194) which can be viewed as an alternatively stacked close-packed Li layers sandwiched between two O–Nb–O ‘slabs’ along the c direction as shown in the schematic Fig. 1.26 The relative intensities are the same for all samples, indicating there are no any samples with specific orientation. By synthesizing Li1−xNbO2 through SPS showed small peaks of LiNbO3 and NbO2 besides the main crystal peaks of LiNbO2. It is anticipated that small amount of LiNbO3 phase is observed due to moderate oxygen partial pressure during SPS, which changes the oxidation state of niobium atom from Nb3+ to Nb5+. Moreover, at high nominal Li-vacancies, i.e., x > 0.2, the intensity of NbO2 peaks increases, which can be explained by using the following chemical reaction (1).| Li3NbO4 + 2NbO → 3LiNbO2 | (1) |
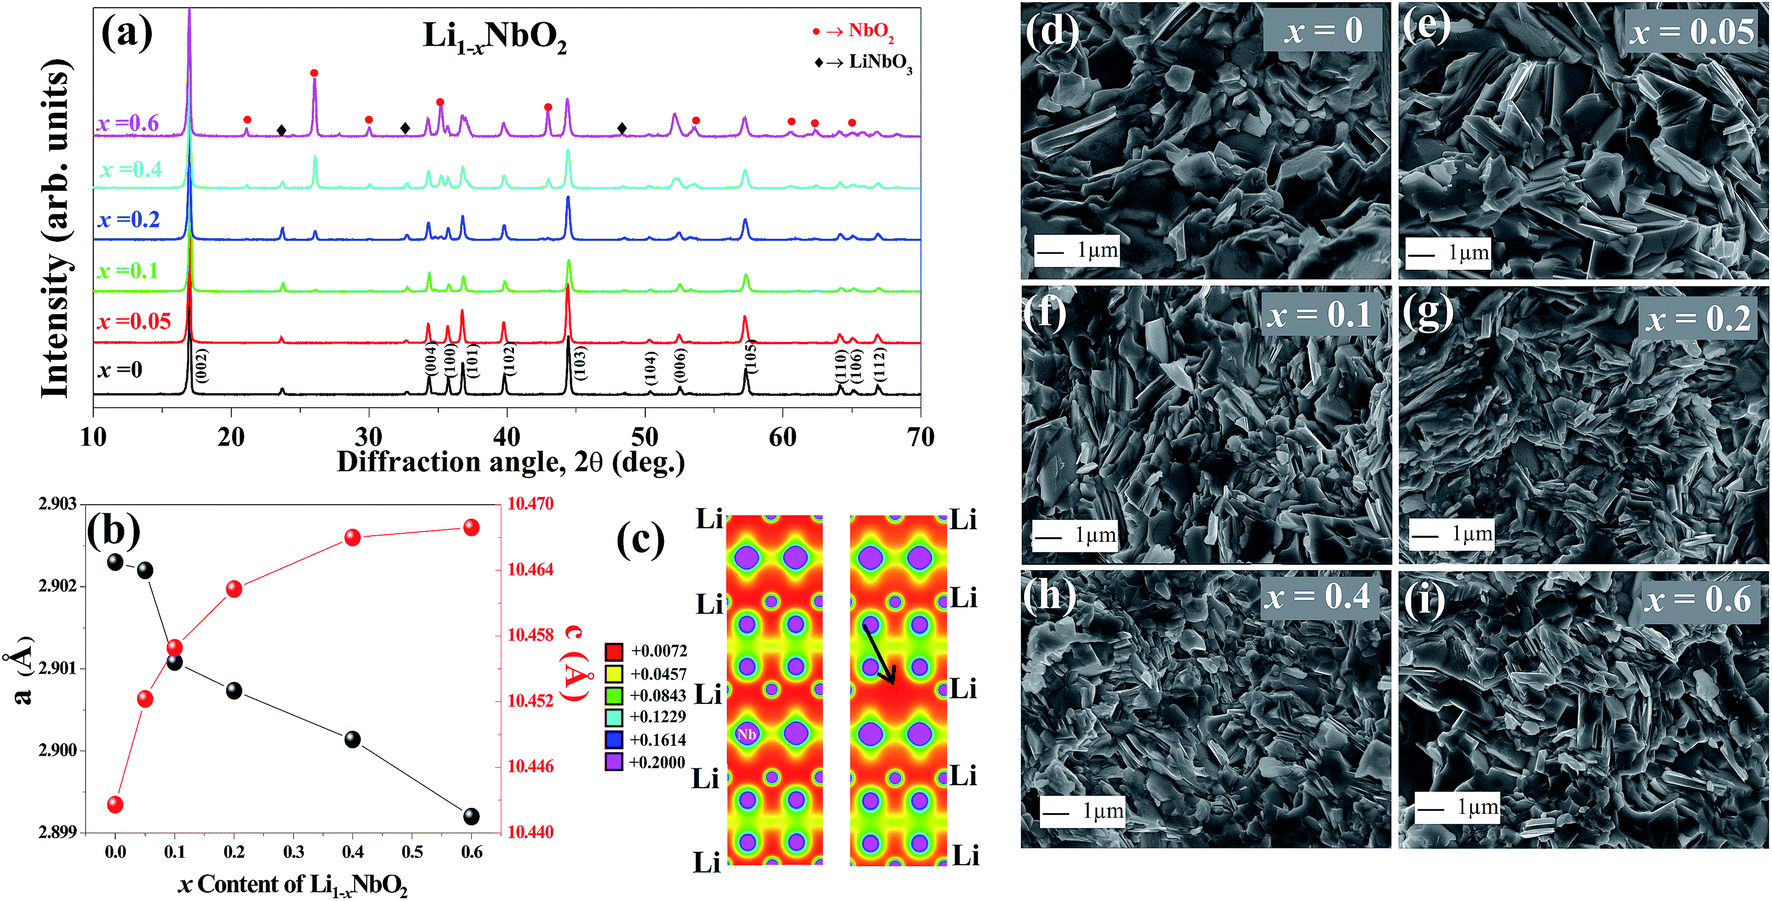 | ||
| Fig. 2 (a) X-ray diffraction patterns and (b) lattice parameters of the SPSed samples at 1050 °C for Li1−xNbO2 (x = 0, 0.05, 0.1, 0.2, 0.4 and 0.6). (c) The DFT calculated charge density profile for pure and Li vacancy Li1−xNbO2. The arrow in the Vac panel indicates the Li vacancy. (d–i) Microstructure of the fractured surfaces for Li1−xNbO2 (x = 0, 0.05, 0.1, 0.2, 0.4 and 0.6). | ||
At lower Li-vacancies there are enough Li atoms to combine with Nb3+ ([Nb5+ + 2Nb2+]3+) to form LiNbO2. However, at high Li-vacancies there are not enough Li atoms to combine with all Nb3+ ([Nb5++2Nb2+]3+) atoms to form LiNbO2 and due to low oxygen partial pressure Nb5+ in the Li3NbO4 is reduced to Nb4+ which result NbO2 phase. Furthermore, when Li atoms are extracted from the Li layers leading to increased repulsive force between the two neighboring oxygen layers, causing the increased lattice parameter c of the unit cell. Meanwhile, the a lattice parameter decreases because of the shrinking Nb–O bonds in NbO6 octahedral, which results in contracting the ion radius of Nb with higher oxidation states.21,25 The variation in the lattice parameter is presented in Fig. 2(b). The observed lattice parameters are very close to previous reports and our DFT calculated lattice parameters.19,36 In this last case, using the optimized lattice volume, we considered different supercells (1 × 1 × 1, 1 × 1 × 2, 2 × 2 × 1, and 2 × 2 × 2) to simulate Li vacancies in LiNbO2. We found that the formation energy of the Li vacancy increases with Li vacancy concentrations, i.e., ∼2.13, 2.34, 3.34, 3.58 eV for 0.06%, 0.13%, 0.25% and 0.50% Li vacancy concentrations, respectively. The atomic positions of the Li, Nb, and O atoms were also relaxed and we observed a small decrease in the bond length of NbO around the Li vacancy. The bond length of unrelaxed (relaxed) NbO was found to be 2.10 (2.08) Å. From this it is clear that the Li vacancy slightly distorts the Nb–O bonds and shrinks the NbO6 octahedral.
The charge density distribution of LiNbO2 was also calculated when the Li vacancy was introduced. Fig. 2(c) shows the DFT calculated charge density projected on the (110) plane containing the Li vacancy. It is clear from Fig. 2(c) that the Li vacancy does not significantly change the bonding nature of LiNbO2. A strong overlapping of the charge density between the Nb and O atoms can be seen in both the pure and Li defected systems. The bonds between Li and O atoms are weaker as compared to those between Nb and O atoms and therefore the Li vacancy does not bring much change in the bonding characteristic in Li1−xNbO2. Experimentally, the results obtained from our XRD suggest that some of the Nb atoms are substituted over the Li-vacant sites. We have also calculated filling the Li vacancies with Nb atoms, and we obtained that Nb-doped at the Li site in Li1−xNbO2 has a much smaller formation energy (0.48 eV) than the Li vacancy (2.13 eV). It is noted that such a low energy hints to the fact that the role of Nb at Li sites cannot be ignored when synthesizing Li1−xNbO2 through the SPS method.
Fig. 2(d)–(i) and ESI Fig. S1† displays the FESEM images from the fractured cross-section of Li1−xNbO2 (x = 0, 0.05, 0.1, 0.2, 0.4 and 0.6). All samples are well sintered and have dense microstructures which is consistent with high relative densities larger than 95%. It can also be seen that the grain are homogeneously distributed, randomly oriented and no obvious segregations. Furthermore, the Li-vacancies have no significant effect on shape and size of the grains.
The temperature dependent electrical conductivities (σ) for Li1−xNbO2 (x = 0, 0.05, 0.1, 0.2, 0.4 and 0.6) are shown in Fig. 3(a). All properties were measured along the direction perpendicular to the pressing direction as schematically drawn in the inset of Fig. 3(a). The electrical conductivities of the samples increased with the increase in the amount of Li-vacancies, indicating that more holes are produced, as shown in the defect reaction eqn (2). It is noteworthy that the electrical conductivity decreases with increasing temperature, indicating metallic behavior. However, for higher concentrations of Li-vacancies (x ≥ 0.4) and at high temperatures the metallic conduction changed to a semiconducting-like behavior. This transition region is shifted to lower temperatures in the compounds with increasing Li-vacancies, indicating that hole generation is suppressed by electrons. These electrons are produced by substitution of Nb atoms in some of the missing Li atoms, as aforementioned by the DFT calculations. It is also known that the 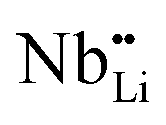 (Nb at Li-site) prefers over
  (Nb at interstitial site) to compensate the charge neutrality.37 Above this region, the electrical conductivity is dominated by electrons and a slight increase in electrical conductivity is observed. This mechanism can be understood by the defect reactions shown in eqn (3)–(5).
 | (2) |
 | (3) |
 | (4) |
 | (5) |
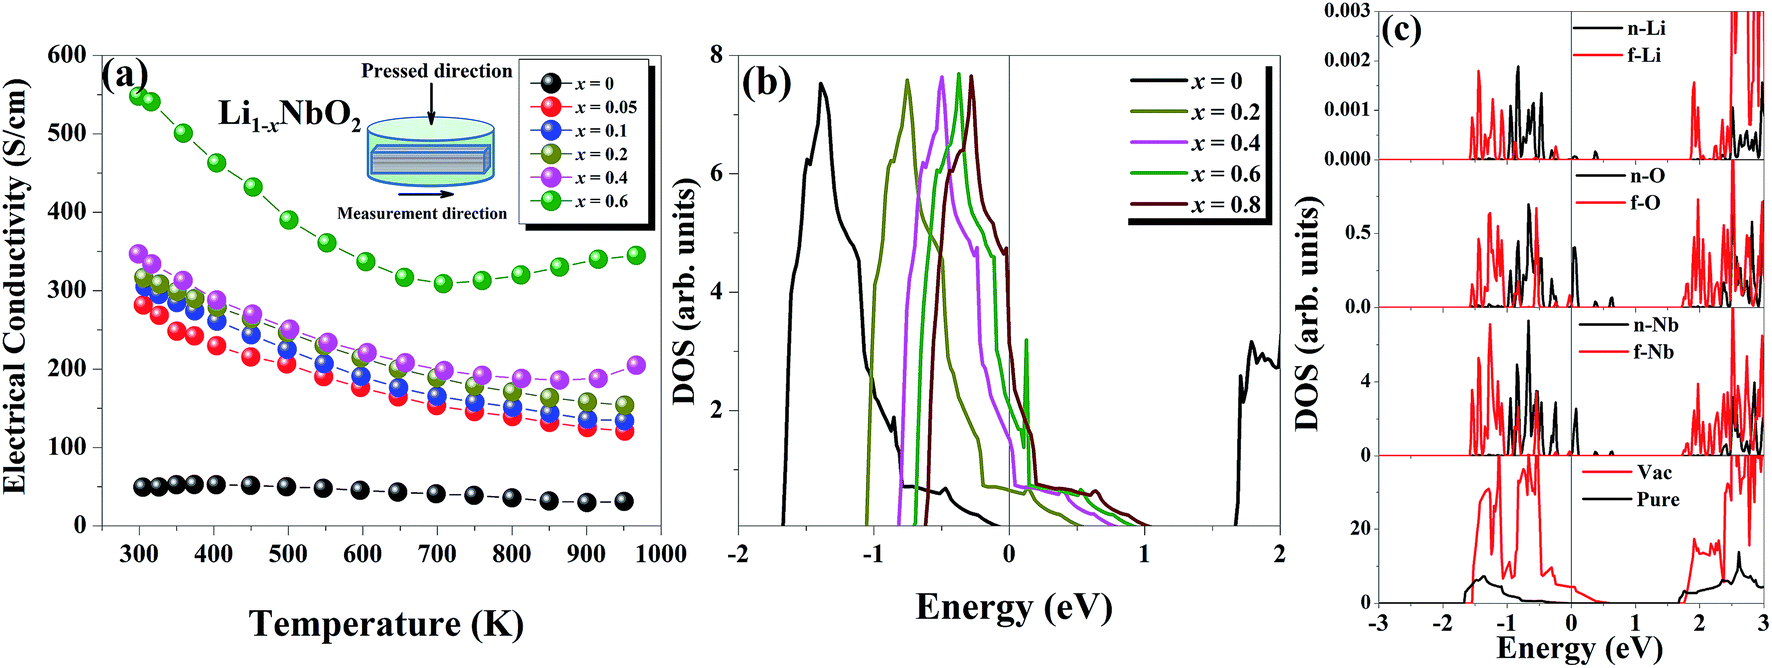 | ||
| Fig. 3 (a) Temperature dependence of the electrical conductivity of Li1−xNbO2 (x = 0, 0.05, 0.1, 0.2, 0.4 and 0.6) samples. (b) The DFT calculated electronic density of states (DOS) of Li1−xNbO2 for different fractions of holes. Zero holes correspond to pure LiNbO2. (c) The DFT calculated total and partial density of states of defected (Li vacancy) LiNbO2. n-(Nb/O/Li) indicates the nearest atom and f-(Nb/O/Li) the farthest atom to the Li vacancy. The vertical line corresponds to the Fermi energy. | ||
To gain insight into the origin of the above experimental observations, we calculated the electronic structure of pure and Li defected LiNbO2 systems. We found that pristine LiNbO2 is an indirect band-gap semiconductor with a calculated band-gap of 1.65 eV. Note that DFT-LDA usually underestimates the band-gap. Nevertheless, the calculated band-gap agrees with previous works.34 We then calculated the electronic density of states (DOS) under different hole concentrations (x = 0–0.8). Fig. 3(b) summarizes the DOS at different fractions of holes. From these results it is clear that pure LiNbO2 is a semiconductor without any hole. However, as holes are introduced into LiNbO2, electronic states appear at the Fermi energy, indicating metallic character, and the DOS at the Fermi energy increases with increasing holes. These calculations demonstrate that, as the hole concentration is increased, the DOS at the Fermi energy also increases, suggesting that the electrical conductivity of Li1−xNbO2 grows with increasing holes. To further elaborate and investigate the atomic origin of the enhancement of the electrical conductivity induced by Li vacancies, we show the atomic projected density of states of LiNbO2 in the presence of Li vacancies (0.06%) (see Fig. 3(c)). From the projected DOS it can be seen that, as Li vacancies are introduced, the electronic states at the top of the valance band develop a hole-like character. Therefore, it is clear that Li vacancy induces holes in LiNbO2. These holes are mostly localized on the Nb and O atoms near the Li vacancy. The sharp peaks near the Fermi energy are contributed by the Nb-d and O-p electrons. These states were completely occupied in pristine LiNbO2, but due to the Li vacancy they become partially occupied, which increases the electrical conductivity of LiNbO2 due to the itinerant nature of these Nb-d and O-p electrons. We also calculated the electronic structure of Nb-doped LiNbO2 (not shown), and we found that Nb doping at the Li site only reduced slightly the band-gap and introduced an impurity band just below the conduction band edge. The presence of such a band implies that Nb introduces electrons in the system, which are supposed to compensate the holes generated by the Nb substitution on the Li site, as expected from eqn (4) and (5). Since Nb-doped LiNbO2 has a smaller formation energy than the Li vacancy, as shown before, the sample (x ≥ 0.4) can have a significant number of Nb atoms at the Li site at high temperature, which produce electrons and can affect the electrical conductivity and Seebeck coefficient discussed below.
The temperature dependent Seebeck coefficients (S) for Li1−xNbO2 (x = 0, 0.05, 0.1, 0.2, 0.4 and 0.6) samples are presented in Fig. 4(a). To support our experimental observation, DFT calculations in combination with the Boltzmann transport theory were also carried out to obtain the Seebeck coefficient for a pristine sample doped with a hole carrier concentration (∼1019 cm−3) and compare it with experimental data. We see that both the experimentally obtained S and theoretically calculated S are in good agreement. The sign of the Seebeck coefficient is positive over the entire temperature range, which means that the major charge carriers are holes. The occurrence of holes is related to the deviation from stoichiometry in the lithium sublattice i.e., Li-vacancies.38 The Seebeck coefficient of samples with x ≤ 0.1 monotonically increases with increasing temperature, indicating a degenerately doped p-type semiconductor. However, for sample with x = 0.2 at high temperatures the increase in the Seebeck coefficient is very weak, which indicates that the carrier generation i.e., holes, is starting to be suppressed by electron. With further increase in Li-vacancies (x > 0.2) and at high temperatures, the Seebeck coefficient starts decreasing and ultimately a transition from p-type to n-type is observed for x ≥ 0.6. This p–n transition temperature shifts to lower temperature with further increase in the Li-vacancies concentration (x = 0.8), which is not shown here. Such shift suggests that the observed p–n transition may be due to cation disorder, which is consistent with the σ–T behavior (shown in Fig. 3(a)) and our DFT calculations. Moreover, it is also necessary to consider that the niobium atom (Nb) can have multiple oxidation states. The Nb3+ can more probably considered to be a source of positive charge carriers (holes), while Nb[(y+3)+] y ≥ 1 in Li1−xNbO2 can be considered as a source of negative charge carriers (electrons). This assumption is also consistent with XRD data shown in Fig. 2(a). The overall mechanism can also be understood by the defect reaction eqn (3)–(5). Furthermore, the thermoelectric power factor (PF = S2σ) for Li1−xNbO2 (x = 0, 0.05, 0.1, 0.2, 0.4 and 0.6) as a function of temperature is plotted and the obtained PFs are comparable to champion oxide thermoelectric materials (ESI Fig. S2†). The observed trend for the optimal composition indicates that the PF will be even larger at higher temperatures. This significant enhancement in the PF is due to both high Seebeck coefficient and electrical conductivity by the increased DOS.
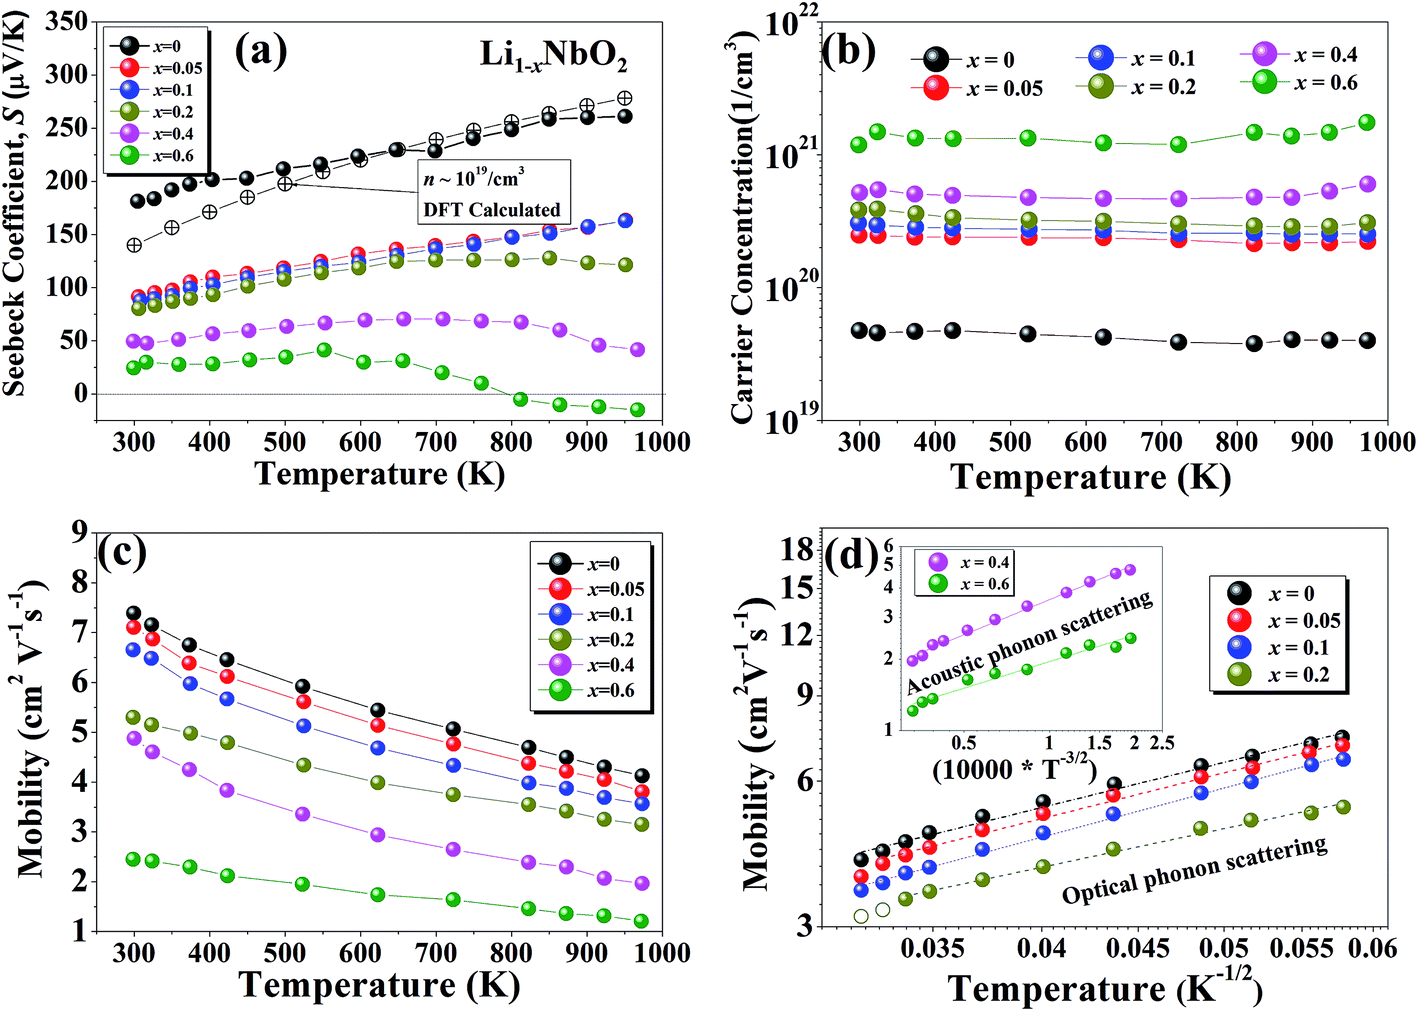 | ||
Fig. 4 Temperature dependence of the (a) Seebeck coefficient, (b) carrier concentration, (c) carrier mobility, (d) normalized mobility as a function of 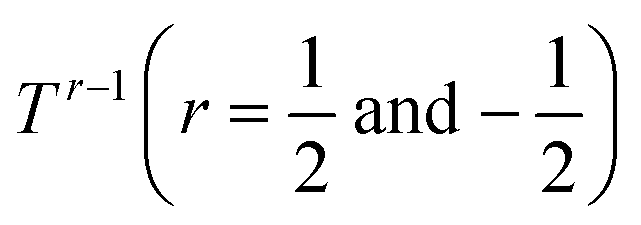 of Li1−xNbO2 (x = 0, 0.05, 0.1, 0.2, 0.4 and 0.6) samples. of Li1−xNbO2 (x = 0, 0.05, 0.1, 0.2, 0.4 and 0.6) samples. | ||
To further investigate the origin of the electronic transport properties of Li1−xNbO2 (x = 0, 0.05, 0.1, 0.2, 0.4 and 0.6), temperature dependent Hall measurements were performed. The results are presented in Fig. 4(b)–(d). The observed trends, characterized by the Hall measurements, were in reasonably good agreement with the electrical conductivity and Seebeck coefficient. The hole concentration as shown in Fig. 4(b) increases as expected with increasing Li-vacancies, resulting from the generation of Li-vacancies 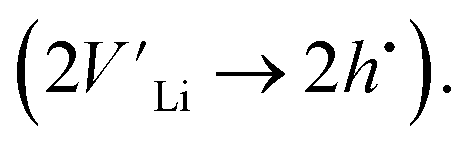 It is noteworthy that the hole concentrations in compounds with relatively low Li-vacancies (x ≤ 0.2) were not significantly influenced by temperature, indicating that they are degenerately doped with Li-vacancies. However, compounds with high Li-vacancies (x ≥ 0.4) and at high temperatures exhibit a slight increase in the carrier concentration. This tendency is in excellent agreement with the evolution of the Seebeck coefficients shown in Fig. 4(a), and suggests that this increase is due to the generation of electrons. Furthermore, the Fermi level in degenerately doped p-type semiconductor is located below the valence band maxima (VBM) and the carrier concentration is independent of temperature up to the extrinsic–intrinsic transition temperature.39 Therefore, it is anticipated that Li1−xNbO2 is a heavily doped extrinsic semiconductor, with a large amount of holes generated by the Li-vacancies, as discussed in the above DFT calculations. The mobility showed strong temperature dependence and decrease in the entire temperature range, as shown in Fig. 4(c). Based on the Hall measurements and the defect reactions eqn (2)–(5), it is anticipated that the temperature-dependent electrical conductivity is governed by the mobility in the region where p-type holes are dominant and by carrier concentration in the region where n-type electrons are dominant (x ≥ 0.4 and at high temperature). The carrier mobility showed negative temperature-dependence in all compounds, resulting from the well-known phonon scattering (μ ∝ Tr−1), where
 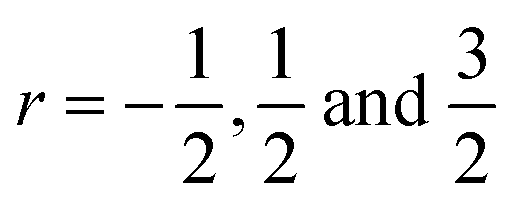 represent acoustic phonon scattering, optical phonon scattering and ionized impurity scattering, respectively.40–42 To understand the scattering mechanism in Li1−xNbO2, mobilities were replotted as a function of Tr−1 as shown in Fig. 4(d). The compositions x ≤ 0.2 exhibited a linear relationship with T−1/2, suggesting that the mobility is dominantly governed by optical phonon scattering. However, composition x ≥ 0.4, as shown in Fig. 4(d) inset, exhibited a linear relationship with T−3/2, suggesting that the mobility is governed by acoustic phonon scattering. The reason for this transition i.e., from optical to acoustic phonon scattering, is not clear, however, it is believed that a possible reason for this transition could be due to the dominant defect change from Li-vacancies, corresponding to eqn (2) and (3), to Nb substitutions for Li sites, corresponding to eqn (4) and (5). Regarding the secondary phases with higher x-value, the complex scattering effects by different interfaces between different phases (Li1−xNbO2/NbO2/LiNbO3) also cannot be excluded completely. Consequently, it is also reconfirmed that the metallic-like temperature dependence of the electrical conductivity as shown in Fig. 3(a) is attributed to the temperature dependence of the carrier mobility.
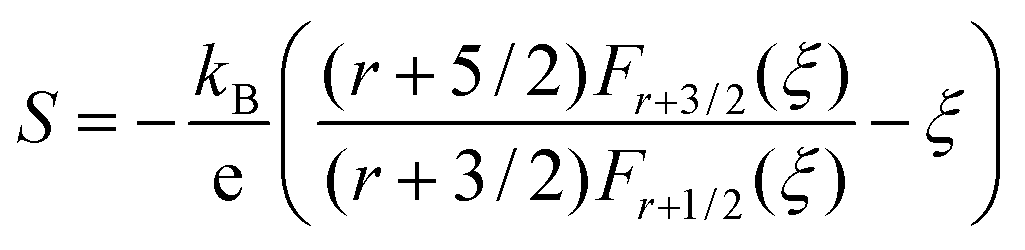
The linear temperature dependence of the Seebeck coefficient also suggests that the carrier concentration is constant, which is in agreement with the Hall-effect measurements, as discussed above. To analyze the dominant conduction mechanism behind the Seebeck effect, the effective mass at the Fermi level, that is, the density of state (DOS) effective mass 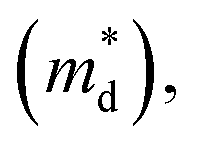 was determined from the slope of S − n2/3 vs. T, as shown in Fig. 5. The Seebeck coefficient can be expressed by using the Pisarenko relation in eqn (6).5,43
 | (6) |
 is the density of state effective mass. As shown in Fig. 5, samples with x ≤ 0.1 show degenerate semiconducting behavior in the whole temperature range. The slope of S − n2/3 vs. T becomes steeper, which leads to an enhancement in the DOS effective mass
  However, for sample with x = 0.2 and at high temperatures the slope was not well fitted. A possible explanation could be that the increase in the effective mass
  is slightly suppressed by the carrier concentration as shown in Fig. 8(c), which leads to a weak temperature-dependent Seebeck coefficient in this region. With a further increase in the Li-vacancies for x ≥ 0.4 and at high temperatures the deviation from the S − n2/3 vs. T slope is due to the transition from p-type to n-type, as discussed above.
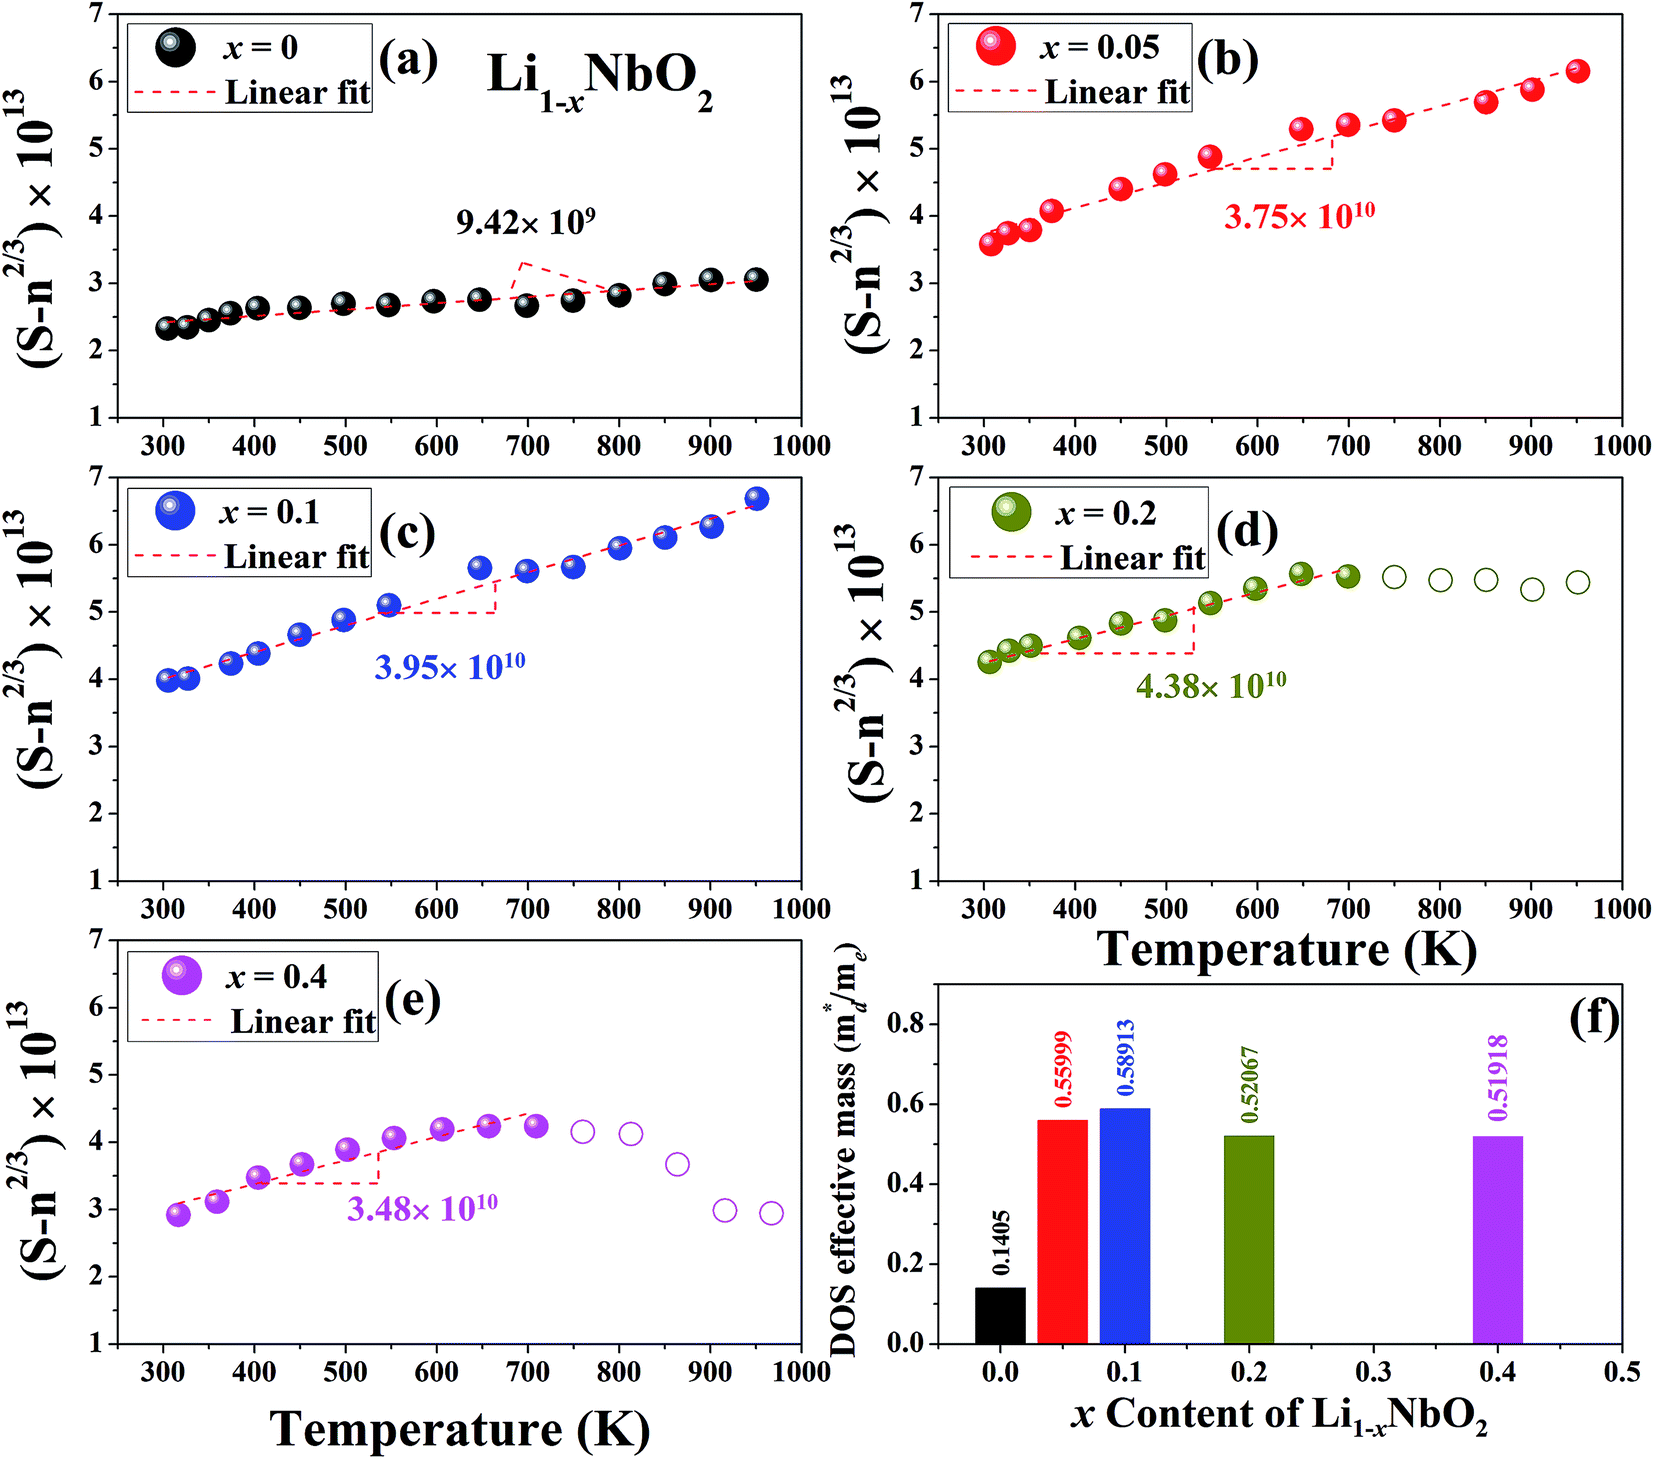 | ||
| Fig. 5 A plot of S − n2/3 vs. T from the Pisarenko relation for Li1−xNbO2 (x = 0, 0.05, 0.1, 0.2 and 0.4) samples (a–e) and the DOS effective mass using the slope of this plot (f). | ||
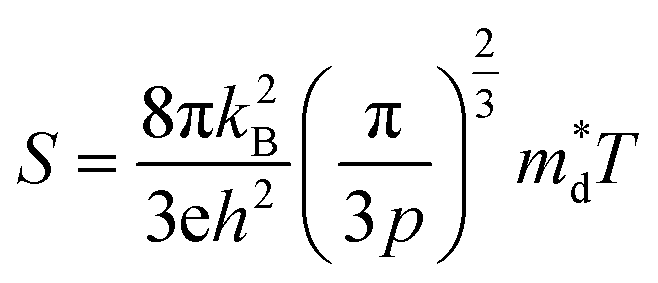
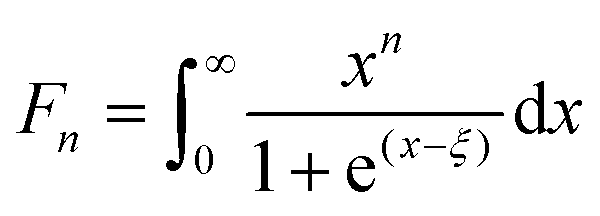
Fig. 6 represents the theoretically calculated Seebeck coefficients at various temperatures, which are plotted as a function of carrier concentration and compared with our measured Seebeck coefficients. Considering the case of a single parabolic band (SPB) model of conduction, it is possible to calculate the Seebeck coefficient and evaluate the role of carrier concentration and carrier scattering mechanisms by using the Fermi–Dirac distribution and the Fermi integral, Fr, in eqn (7), where kB is the Boltzmann constant, e is the electron charge, r is the scattering parameter (−1/2 for acoustic phonon scattering, +1/2 for optical phonon scattering, and +3/2 for ionized impurity scattering), and ξ is the chemical potential in eqn (7).44–46
 | (7) |
 | (8) |
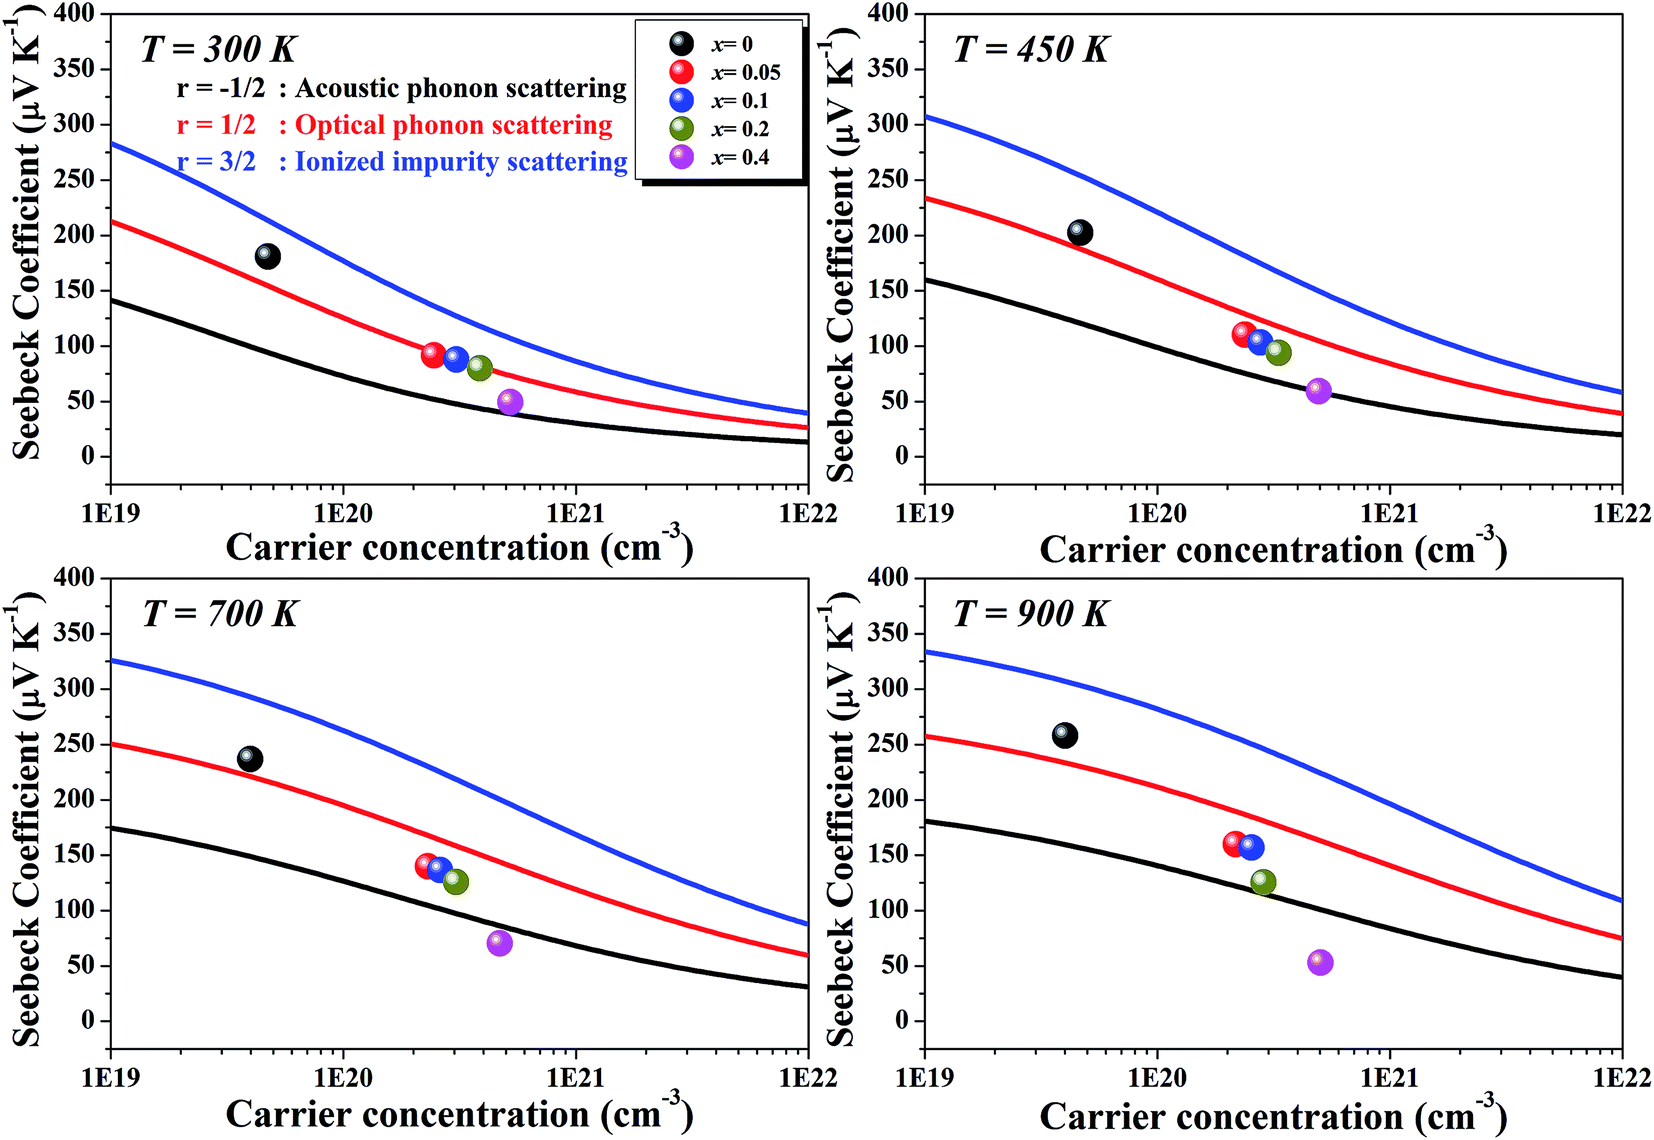 | ||
| Fig. 6 Calculated carrier concentration-dependent Seebeck coefficients of Li1−xNbO2 (x = 0, 0.05, 0.1, 0.2 and 0.4) samples at various temperatures. | ||
Comparing our results with the SPB model prediction, it is observed that the Li-vacancies switch the scattering mechanism from optical to acoustic phonon scattering. In addition to this, it is noteworthy to note that compositions with x ≥ 0.4 and at high temperatures the measured values lie below the theoretical values for all of the charge carrier scattering mechanisms. This switching optical to acoustic phonon scattering is consistent with the observed mobility scattering mechanism presented in Fig. 4(d).
The temperature dependent total thermal conductivities (κtot) of Li1−xNbO2 (x = 0, 0.05, 0.1, 0.2, 0.4 and 0.6) are shown in Fig. 7(a). With the increase of temperature, the thermal conductivity decreases for all nominal compositions. Fig. 7(a) inset shows the lattice thermal conductivity, which is calculated using eqn (9), where κele, κlat, T, σ and L are the electronic thermal conductivity, lattice thermal conductivity, absolute temperature, electrical conductivity, and Lorenz number (2.45 × 10⁻⁸ W Ω K−2), respectively. κele can also be obtained by using Wiedemann–Franz relationship, κele = LσT.47
| κ = κlat + κele = κlat + LσT | (9) |
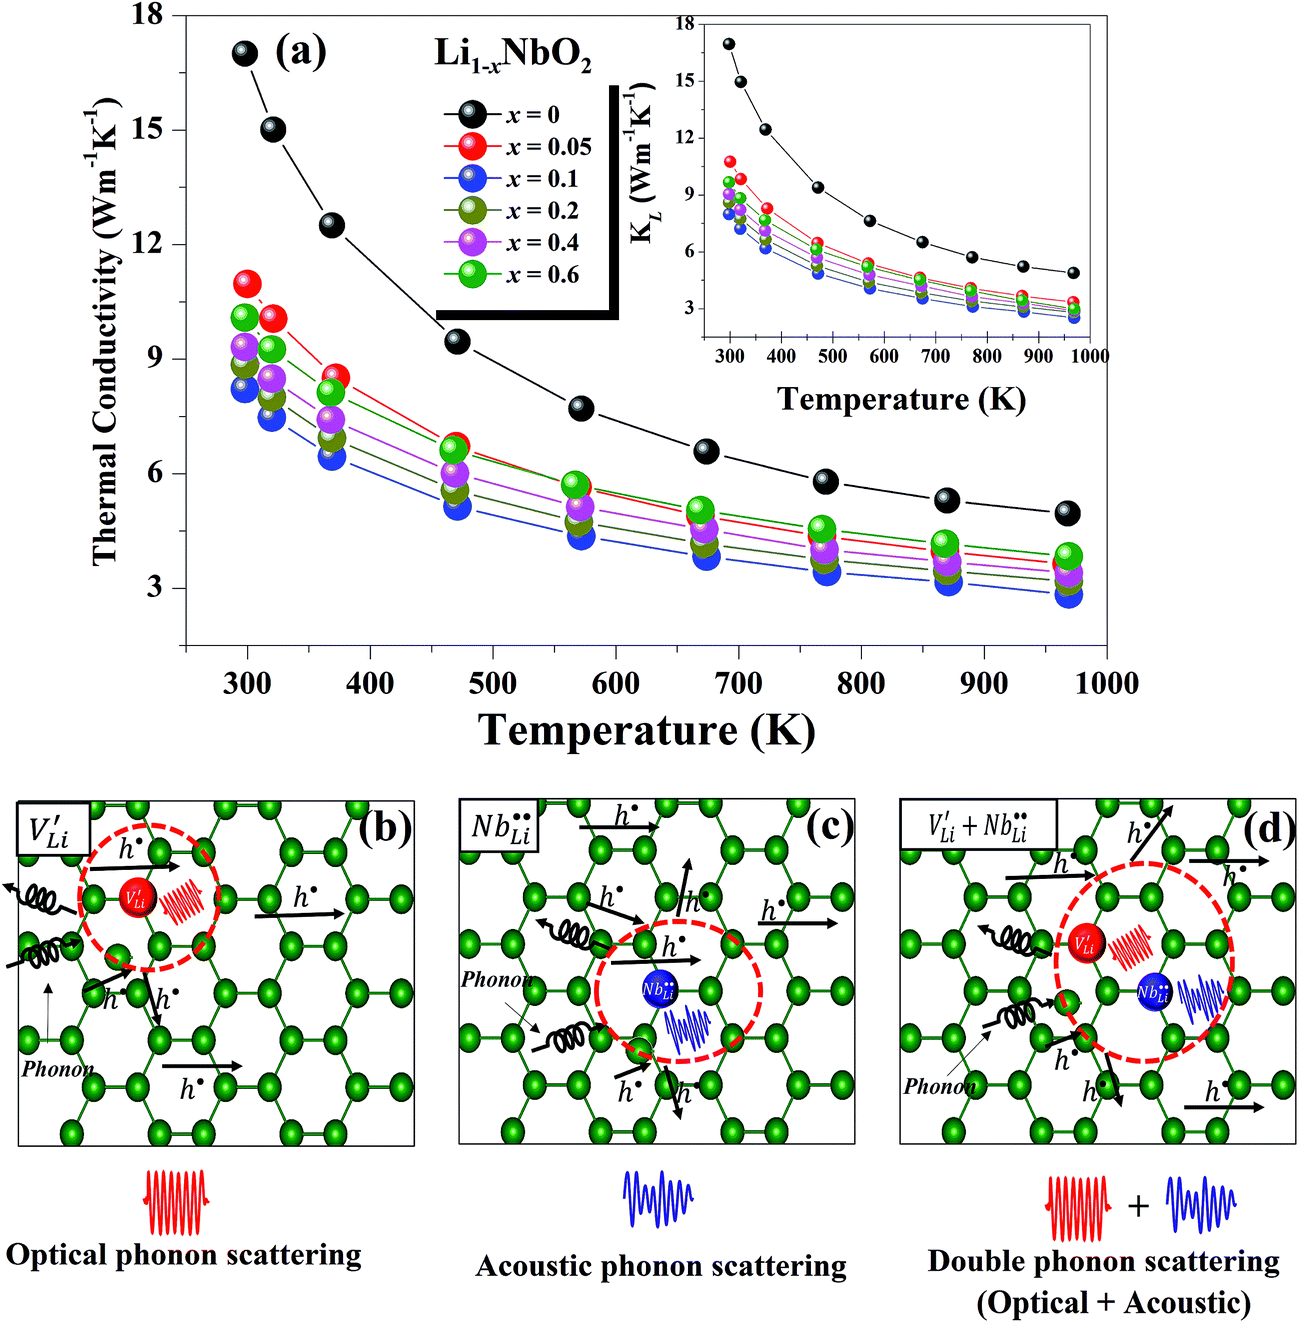 | ||
| Fig. 7 Temperature dependent (a) total and lattice thermal conductivities for Li1−xNbO2 (x = 0, 0.05, 0.1, 0.2, 0.4 and 0.6) samples, and schematic representations of (b) optical phonon scattering, (c) acoustic phonon scattering, and (d) double phonon scattering. | ||
As shown in the Fig. 7(a) inset, that the major contribution to the total thermal conductivity comes from lattice vibrations. A slight increase in the electronic thermal conductivity, κele, is also observed with an increase in the Li-vacancies, as shown in ESI Fig. S3,† which is consistent with the evolution of the electrical conductivity (see Fig. 3) and the DFT calculations discussed above. In addition to this, a significant reduction in the thermal conductivity is observed with increasing Li-vacancies up to x = 0.1, which suggests that Li-vacancies behave as an effective scattering center of phonons, leading to a reduction of the lattice thermal conductivity. As aforementioned, the Nb–O distortion by Li-vacancies can also be a scattering center. Furthermore, as shown in Fig. 4(d) and 6, as the x-value increases, the phonon type changes from optical phonon by mainly Li-vacancies to acoustic phonon by  contribution. Therefore, as shown in Fig. 7, both x = 0.05 and 0.1 cases presumably have localized double phonon (optical and acoustic phonons), which may play a role as a phonon scattering center with the Li-site defects (
 and
and  ), showing substantial decrease of lattice thermal conductivity. The overall phonon scattering scenario is schematically illustrated in Fig. 7(b)–(d). Moreover, with further increase in x-values (Li-vacancies, x ≥ 0.2), the thermal conductivity increases slightly again, which is presumably due to the single phonon type of acoustic phonon and/or the high thermal conductivity of secondary phases48 as detected in XRD (see Fig. 2(a)).
The figure-of-merit ZT for all Li1−xNbO2 (x = 0, 0.05, 0.1, 0.2, 0.4 and 0.6) samples is shown in Fig. 8. Due to the strong phonon scattering by Li-vacancies, it is found that ZT is enhanced in the entire temperature range and reaches a maximum value of 0.125 at 970 K, which is about ∼220% (3-times) higher than that of pristine (LiNbO2) samples. The observed trend indicates that ZT would be even higher at higher temperatures. In addition to this, the ZT obtained in this work is higher than that of reported early oxide thermoelectric material, e.g., NaCoO2 (ZT ∼ 0.032).49 This shows a successful demonstration of significant ZT enhancement by synthesizing nonstoichiometric Li1−xNbO2 through SPS. Also, the samples after high-temperature measurement were characterized by XRD to confirm the stability of Li1−xNbO2. Based then on the XRD data, shown in the inset of Fig. 8, it is possible to confirm that all of our samples after high-temperature measurement are highly stable and can be used as new promising candidate materials for high temperature thermoelectric applications.
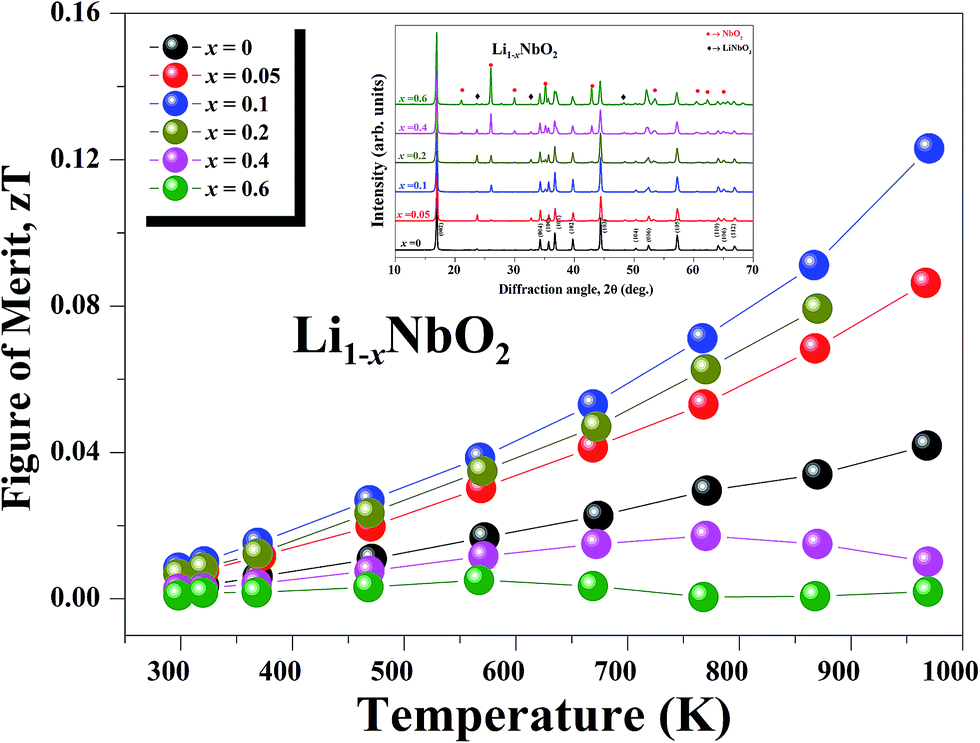 | ||
| Fig. 8 Temperature dependence of the dimensionless figure of merit (ZT) of Li1−xNbO2 (x = 0, 0.05, 0.1, 0.2, 0.4 and 0.6) samples. | ||
4. Conclusion
In conclusion, in this work we synthesized polycrystalline nonstoichiometric Li1−xNbO2 (x = 0, 0.05, 0.1, 0.2, 0.4 and 0.6) by the SPS method and investigated its thermoelectric properties. To the best of our knowledge, there has been no report on the synthesis via SPS and measurement of the high temperature thermoelectric transport properties of (Li1−xNbO2, with x = 0–0.6). We found that the SPS plays a crucial role in the thermoelectric performance of Li1−xNbO2. DFT calculations revealed that Li-vacancies lead to the generation of hole carriers, which results in a significant enhancement of the electrical conductivity with relatively high Seebeck coefficient. The densities of states were significantly improved, which led to an enhancement of the electrical conductivity and the Seebeck coefficient and resulted in a drastic increase of the power factor. We also found that both Li-vacancies and thereby induced localized double phonon play a significant role in the reduction of the lattice thermal conductivity. A maximum ZT of 0.125 with x = 0.1 was obtained at 970 K in samples with excellent stability. With these results, it is also suggested that the synthesis of Li1−xNbO2 and other related compounds through SPS could be a possible way to boost the thermoelectric performance and design stable materials with relatively high figure of merit.Conflicts of interest
There are no conflicts of interest to declare.Acknowledgements
This work was partially supported by the Industrial Technology Innovation Program (Industrial Materials Core Technology Development Program) funded by the Ministry of Trade, Industry and Energy, Republic of Korea (10052977). The co-author, V. M. García-Suárez, thanks the Spanish Ministerio de Economía y Competitividad for funding (FIS2015-63918-R) and Banco Santander for a Mobility Excelence Grant.References
- G. Mahan, B. Sales and J. Sharp, Phys. Today, 1997, 50, 42 CrossRef CAS.
- M. S. Dresselhaus, G. Chen, M. Y. Tang, R. G. Yang, H. Lee, D. Z. Wang, Z. F. Ren, J. P. Fleurial and P. Gogna, Adv. Mater., 2007, 19, 1043 CrossRef CAS.
- L.-D. Zhao, V. P. Dravid and M. G. Kanatzidis, Energy Environ. Sci., 2014, 7, 251 CAS.
- T. M. Tritt and M. Subramanian, MRS bull., 2006, 31, 188 CrossRef.
- G. J. Snyder and E. S. Toberer, Nat. Mater., 2008, 7, 105 CrossRef CAS PubMed.
- B. Sales, D. Mandrus and R. K. Williams, Science, 1996, 272, 1325 CAS.
- G. Nolas, J. Cohn, G. Slack and S. Schujman, Appl. Phys. Lett., 1998, 73, 178 CrossRef CAS.
- H. Ohta, Mater. Today, 2007, 10, 44 CrossRef CAS.
- S. Lee, R. H. T. Wilke, S. Trolier-McKinstry, S. Zhang and C. A. Randall, Appl. Phys. Lett., 2010, 96, 031910 CrossRef.
- S. Lee, G. Yang, R. H. T. Wilke, S. Trolier-McKinstry and C. A. Randall, Phys. Rev. B: Condens. Matter Mater. Phys., 2009, 79, 134110 CrossRef.
- I. Terasaki, Y. Sasago and K. Uchinokura, Phys. Rev. B: Condens. Matter Mater. Phys., 1997, 56, R12685 CrossRef CAS.
- T. Kawata, Y. Iguchi, T. Itoh, K. Takahata and I. Terasaki, Phys. Rev. B: Condens. Matter Mater. Phys., 1999, 60, 10584 CrossRef CAS.
- K. Fujita, T. Mochida and K. Nakamura, Jpn. J. Appl. Phys., 2001, 40, 4644 CrossRef CAS.
- T. H. An, Y. S. Lim, H. S. Choi, W. S. Seo, C. H. Park, G. R. Kim, C. Park, C. H. Lee and J. H. Shim, J. Mater. Chem. A, 2014, 2, 19759 CAS.
- E. G. Moshopoulou and a. J. J. C. P. Bordet, Phys. Rev. B: Condens. Matter Mater. Phys., 1999, 59, 9590 CrossRef CAS.
- N. Kumada, S. Watauchi, I. Tanaka and N. Kinomura, Mater. Res. Bull., 2000, 35, 1743 CrossRef CAS.
- E. R. Ylvisaker and W. E. Pickett, Phys. Rev. B: Condens. Matter Mater. Phys., 2006, 74, 075104 CrossRef.
- K. Takada, H. Sakurai, E. Takayama-Muromachi, F. Izumi, R. A. Dilanian and T. Sasaki, Nature, 2003, 422, 53 CrossRef CAS PubMed.
- A. Miura, K. Tadanaga, E. Magome, C. Moriyoshi, Y. Kuroiwa, T. Takahiro and N. Kumada, J. Solid State Chem., 2015, 229, 272 CrossRef CAS.
- M. J. Geselbracht, A. M. Stacy, A. R. Garcia, B. G. Silbemagel and G. H. Kwei, J. Phys. Chem., 1993, 97, 7102 CrossRef CAS.
- D. L. Novikov, V. A. Gubanov, V. G. Zubkov and A. J. Freeman, Phys. Rev. B: Condens. Matter Mater. Phys., 1994, 49, 15830 CrossRef CAS.
- J. K. Burdett and T. Hughbanks, Inorg. Chem., 1985, 24, 1741 CrossRef CAS.
- G. T. Liu, J. L. Luo, Z. Li, Y. Q. Guo, N. L. Wang, D. Jin and T. Xiang, Phys. Rev. B: Condens. Matter Mater. Phys., 2006, 74, 012504 CrossRef.
- D. Kellerman, V. Gorshkov, A. Tyutyunnik and V. Zubkov, Superconductivity. Phys. Chem. Tech., 1992, 5, 2035 Search PubMed.
- M. J. Geselbracht, T. J. Richardson and A. M. Stacy, Nature, 1990, 345, 324 CrossRef CAS.
- N. Kumada, S. Muramatu, F. Muto, N. Kinomura, S. Kikkawa and M. Koizumi, J. Solid State Chem., 1988, 73, 33 CrossRef CAS.
- J. D. Greenlee, W. L. Calley, W. Henderson and W. A. Doolittle, Phys. Status Solidi C, 2012, 9, 155 CrossRef CAS.
- E. R. Ylvisaker, K.-W. Lee and W. E. Pickett, Phys. B, 2006, 383, 63 CrossRef CAS.
- P. Hohenberg and W. Kohn, Phys. Rev., 1964, 136, B864 CrossRef.
- P. Bordet, E. Moshopoulou, S. Liesert and J. Capponi, Phys. C, 1994, 235, 745 CrossRef.
- J. U. Rahman, E. J. Meang, D. V. Nguyen, W. S. Seo, A. Hussain, M. H. Kim and S. Lee, J. Electron. Mater., 2017, 46, 1740 CrossRef.
- W. Kohn and L. Sham, Phys. Rev. A: At., Mol., Opt. Phys., 1965, 140, 113 Search PubMed.
- P. Giannozzi, S. Baroni, N. Bonini, M. Calandra, R. Car, C. Cavazzoni, D. Ceresoli, G. L. Chiarotti, M. Cococcioni and I. Dabo, J. Phys.: Condens. Matter, 2009, 21, 395502 CrossRef PubMed.
- G. K. Madsen and D. J. Singh, Comput. Phys. Commun., 2006, 175, 67 CrossRef CAS.
- J. M. Ziman, Principles of the Theory of Solids, Cambridge University Press, 1979 Search PubMed.
- H. F. Roth, G. Meyer, Z. Hu and G. Kaindl, Z. Anorg. Allg. Chem., 1993, 619, 1369 CrossRef CAS.
- D. M. Smyth, Ferroelectrics, 2011, 50, 93 CrossRef.
- K. W. Lee, J. Kuneš, R. T. Scalettar and W. E. Pickett, Phys. Rev. B: Condens. Matter Mater. Phys., 2007, 76, 144513 CrossRef.
- B. G. Streetman and S. Banerjee, Solid State Electronic Devices, Prentice Hall, New Jersey, 1980 Search PubMed.
- B.-L. Huang and M. Kaviany, Phys. Rev. B: Condens. Matter Mater. Phys., 2008, 77, 125209 CrossRef.
- H. Kitagawa, A. Kurata, H. Araki, S. Morito and E. Tanabe, Phys. Status Solidi A, 2010, 207, 401 CrossRef CAS.
- T. Zhu, Z. Xu, J. He, J. Shen, S. Zhu, L. Hu, T. M. Tritt and X. Zhao, J. Mater. Chem. A, 2013, 1, 11589 CAS.
- A. F. Ioffe, Physics of Semiconductors, Academic Press, New York, 1960 Search PubMed.
- P. Jood, R. J. Mehta, Y. Zhang, G. Peleckis, X. Wang, R. W. Siegel, T. Borca-Tasciuc, S. X. Dou and G. Ramanath, Nano Lett., 2011, 11, 4337 CrossRef CAS PubMed.
- A. F. May, E. S. Toberer, A. Saramat and G. J. Snyder, Phys. Rev. B: Condens. Matter Mater. Phys., 2009, 80, 125205 CrossRef.
- D. Young, T. Coutts, V. Kaydanov, A. Gilmore and W. Mulligan, J. Vac. Sci. Technol., A, 2000, 18, 2978 CAS.
- C. Kittel, Introduction to Solid State Physics, Wiley, 2005 Search PubMed.
- N. H. a. M. E. Fine, J. Appl. Phys., 1981, 52, 2876 CrossRef.
- I. Terasaki, Physical Properties of NaCo2O4 and related oxide: Strongly Correlated Layered Oxide as Thermoelectric Materials, Piscataway, 1999 Search PubMed.
Footnote |
| † Electronic supplementary information (ESI) available. See DOI: 10.1039/c7ra10557f |
| This journal is © The Royal Society of Chemistry 2017 |