 Open Access Article
Hydrotreatment of model compounds with catalysts of NiW/Al2O3 and NiWP/Al2O3 to simulate low temperature coal tar oil
Mengxiang Fanga,
Shuai Maa,
Tao Wang *a,
Zhixiang Xiaa,
Wei Tangb,
Liangyan Xiac and
Zhongyang Luo
 a
a
aState Key Laboratory of Clean Energy Utilization, Zhejiang University, Hangzhou 310027, P. R. China. E-mail: oatgnaw@zju.edu.cn
bHuaneng Clean Energy Research Institute (HNCERI), Beijing 102209, P. R. China
cA. O. Smith (China) Water Heater Co., Ltd., Nanjing 210000, P. R. China
First published on 27th November 2017
Abstract
Eight characteristic model compounds were employed as hydrotreatment feedstocks to simulate low temperature coal tar oil. A series of NiW/Al2O3 catalysts with different Ni/W ratio and NiWP/Al2O3 catalysts with different phosphorus content were prepared by incipient wetness co-impregnation. Both catalysts were characterized by N2 adsorption–desorption, X-ray diffraction, HRTEM, H2-TPR, NH3-TPD and FT-IR. The heteroatom removal and polyaromatic hydrogenation conversions were more than 90% over these catalysts. Ni6W20 showed the highest conversion among the NiW/Al2O3 catalysts due to the presence of relatively short, thick slabs when compared to the other Ni/W ratios. Phosphorus was added to adjust the acid concentration of NiW sulfides. The best hydrotreatment performance was seen with the 0.8 wt% phosphorus catalyst, which was attributed to the highest medium strength acid concentration. The results suggested the medium acid on the NiW sulfide was probably the active site for the hydrogenation of the aromatic ring in the coal tar oil hydrotreatment process. The self-prepared catalyst showed higher HDS and HDN activity than a commercial catalyst.
1 Introduction
Coal is the main energy source in China. Poly-generation technology, combining coal pyrolysis, gasification and combustion process, can convert coal into gas, tar and steam. And then gas and tar can be converted into chemical products and fuels. Steam can be used in electricity generation, which is a promising way to deal with the problem of energy demand and environmental protection in China.1 Coal tar oil is one of the main products of coal pyrolysis at low temperature. Therefore, coal tar oil can be transformed into clean fuel oil by hydroprocessing in this system.2–6Coal tar oil consists of thousands of chemical compounds.7 Such a complex composition is hard to investigate. As such, both the understanding of coal tar oil hydrotreatment and the screening of the catalyst for this process are very difficult. It is not economical and practical to detect the transformation of every compound in coal tar oil during hydroprocessing. Fortunately, the compounds in coal tar oil can be separated into several groups with different functional groups. The hydrogenation mechanisms of the compounds in one group are almost the same. Thus, they can be represented by one characteristic compound in the group. Therefore, several characteristic compounds can be chosen to simulate coal tar oil. Wandas et al.8 investigated the hydroprocessing of three-component model mixtures to simulate fast pyrolysis tars. They found that the interactions of naphthalene and cresols in mixtures resulted in a lower efficiency of naphthalene hydrogenation as well as cresol hydrodeoxygenation than that of the hydroconversion of the single components. Lemberton et al.9–11 reported that they had used phenanthrene, carbazole and 1-naphthol as the model compounds of coal tar oil. In previous studies, three or four model compounds were generally chosen to simulate coal tar oil. However, the model compounds were not abundant enough to represent low temperature coal tar oil (LTCTO), which is composed of O-containing compounds, N-containing compounds, S-containing compounds, aromatics and aliphatics. Ni(Co)–Mo(W) sulfides have been extensively studied and used as hydrotreatment catalysts for years in petroleum industry. The performance of metal sulfide catalysts in coal tar oil hydroprocessing must be different from that seen in the hydroconversion of crude-derived feedstock due to much higher content of phenols, N-containing compounds and aromatics in coal tar oil. The effect of MoO3 content in NiMo3, Ni/W ratio,12 zeolite13 and fluorine14 content in NiW catalysts on LTCTO distillate hydrotreatment has been reported. However, there is little information about these catalysts when applied in coal tar oil hydroprocessing.
In this work, eight compounds were chosen as the model mixtures to simulate LTCTO. The performance of model compounds hydrotreating over NiW/Al2O3 and NiWP/Al2O3 was investigated, and the effects of Ni/W ratio and P content on the physical and chemical properties of catalysts were also studied.
2 Experiment
2.1 Catalyst preparation
NiW/Al2O3 and NiWP/Al2O3 catalysts were prepared by incipient wetness co-impregnation on γ-Al2O3. Ni(NO3)2·6H2O and (NH4)6H2W12O40 were dissolved in de-ionized water. The γ-Al2O3 was impregnated using an aqueous solution at room temperature for 10 h and dried at 120 °C overnight. The resulting sample was calcinated at 550 °C for 4 h. The tungsten content in NiW/Al2O3 was fixed at 20 wt%, and the nickel content was 2 wt%, 4 wt%, 6 wt% and 8 wt%, with catalysts named as Ni2W20, Ni4W20, Ni6W20 and Ni8W20, respectively.NiWP/Al2O3 was obtained using the same steps used to prepare NiW/Al2O3. Phosphoric acid was the source of phosphorus for the co-impregnation solution of Ni(NO3)2·6H2O and (NH4)6H2W12O40. The synthesized NiWP/Al2O3 catalysts were denoted as NiWP-x, where x represented the phosphorus content in the precursor. The nickel and tungsten content in NiWP/Al2O3 was fixed at 6 wt% and 20 wt%, and the phosphorus content was 0.5 wt%, 0.8 wt%, 1.2 wt% and 1.5 wt% respectively.
2.2 Catalyst characterization
With the exceptions of X-ray diffraction (XRD), FT-IR and H2 temperature-programmed reduction (H2-TPR), all samples should be presulfided prior to catalyst characterization. The presulfidation was carried out in a fix-bed reactor at 360 °C and 3 MPa for 4 h. The presulfiding solution was 5 wt% carbon disulfide dissolved in cyclohexane. The flow rates of the H2 and the presulfiding solution were 100 ml min−1 and 0.5 ml min−1, respectively.N2 adsorption–desorption isotherms of the catalysts were measured on a Micromeritics TriStarII3020 apparatus. The specific surface area was calculated by the Brunauer–Emmett–Teller (BET) equation. The desorption branch of the isotherm was used to calculate the average pore diameter according to the Barrett–Joyner–Halenda (BJH) method.
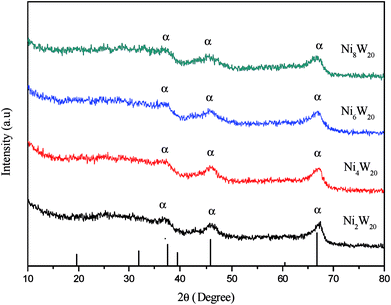
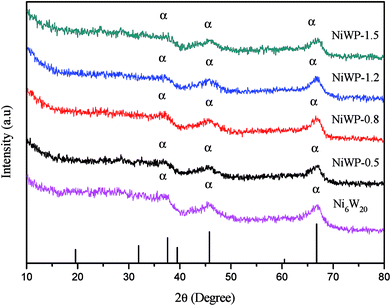
X-ray diffraction (XRD) of the catalysts were recorded with a X'Pert PRO diffractometer (PANalytical), using monochromatic CuKα radiation (λ = 1.541 Å). The X-ray tube was set at 40 kV and 40 mA.
High resolution transmission electron microscope (HRTEM) images were obtained on a Tecnai G2 F20 S-Twin (FEI) operating at 200 kV. The samples were dissolved ultrasonically and placed on a 200-mesh copper grid coated with carbon.
H2 temperature programmed reduction (H2-TPR) was conducted on an AutoChem II 2920 instrument with a mixture of H2/He (H2 10 vol%) at a flow rate of 30 ml min−1 (STP). A 0.1 g sample was placed into a quartz tube, and heated at a rate of 10 °C min−1 to 900 °C.
NH3 temperature programmed desorption (NH3-TPD) was carried out on AutoChem II 2920 instrument as well. A NH3/He mixture (NH3 10 vol%) was absorbed on 0.1 g sample of catalyst at 100 °C. The sample was then heated to 700 °C at a rate of 10 °C min−1.
Fourier transform infrared spectroscopy (FT-IR) of absorbed pyridine was conducted on a Nicolet 6700 FT-IR Spectrometer. Self-supporting wafers with weight of 13 mg catalysts were activated at 400 °C for 4 h under 10−2 Pa, and then cooled down to room temperature. Subsequently, pyridine vapors were admitted, and after equilibration samples were heated to 200 °C at a rate of 10 °C min−1. Then the samples were outgassed for 0.5 h to evacuate the excess pyridine. Infrared spectra of catalysts were recorded with a resolution of 2.0 cm−1.
2.3 Model compounds selection
Model compounds for simulating LTCTO should be carefully selected. The number of model compounds should be neither too small to represent the character of coal tar oil, nor too large to be analysed. In previous research,15–18 aromatics were chosen and thoroughly studied as the model compounds to simulate the hydrogenation of high temperature coal tar oil. However, as listed in Table 1, a high content of phenol and paraffins were found in LTCTO created by coal pyrolysis, compared with the high temperature coal tar oil from coking. These differences should be considered when choosing the model compounds for representing LTCTO.In this study, eight compounds with different functional groups were chosen as the hydrotreatment feedstock to simulate LTCTO. The component of feedstock was listed in Table 2. N-Cetane was chosen to represent saturates because the carbon number of alkanes in coal tar oil was 10–30. The most abundant O-containing compounds in LTCTO were phenols. O-Cresol was chosen for its relatively low hydrodeoxygenation activity among the three kinds of cresols. Quinoline and dibenzothiophene had the highest content of N-containing compounds and S-containing compounds in LTCTO, respectively. The reaction networks of these compounds were also characteristic in hydrodenitrogenation and hydrodesulfurization, respectively. The content of each model compound in the hydrotreatment feedstock was based on the composition analysis of LTCTO distillate by GC-MS.
| Compounds | Boiling point/°C | Content/wt% | Representing compounds in coal tar oil |
|---|---|---|---|
| O-Xylene | 144 | 10 | Monoaromatics |
| O-Cresol | 191 | 18 | O-Containing compounds |
| 1-Methylnaphthalene | 240 | 25 | Diaromatics |
| Biphenyl | 255 | 10 | Diaromatics |
| Phenanthrene | 340 | 10 | Polyaromatics |
| N-Cetane | 287 | 21 | Saturates |
| Quinoline | 238 | 5 | N-Containing compounds |
| Dibenzothiophene | 332 | 1 | S-Containing compounds |
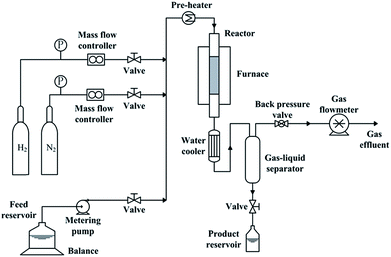
2.4 Hydrotreatment unit
Catalyst activity measurements were carried out in a fixed-bed reactor with inner diameter of 12 mm. The reactor system (as shown in Fig. 1) has been described elsewhere.21 To establish an uniform flow distribution in the reactor and to avoid overheating, 7.5 ml catalyst was packed into the reactor with a dilution of 17.5 ml quartz sand. Prior to activity measurement, catalysts should be in situ presulfided. The process of presulfidation was the same as that before catalyst characterization. After presulfidation, temperature and pressure were adjusted to the desired reaction values. Liquid feed was shifted to the hydrotreatment feedstock. Reaction conditions were 360 °C, 6 MPa, LHSV = 1 h−1 and H2/liquid ratio of 1000![[thin space (1/6-em)]](https://www.rsc.org/images/entities/char_2009.gif) :
:![[thin space (1/6-em)]](https://www.rsc.org/images/entities/char_2009.gif) 1. Each run was conducted for 10 h. The first sample was collected 4 h after initiating the reaction to ensure reaction conditions were stable. The composition distribution of feedstock and products was detected by GC (Agilent 7890A) with an HP-5 capillary column (30 m × 0.25 mm × 0.25 μm, Agilent). The compounds in feedstock and products were identified by GC-MS. For comparison, a commercial hydrotreating catalyst (bought from SINOPEC QILU CO. LTD) was also tested.
1. Each run was conducted for 10 h. The first sample was collected 4 h after initiating the reaction to ensure reaction conditions were stable. The composition distribution of feedstock and products was detected by GC (Agilent 7890A) with an HP-5 capillary column (30 m × 0.25 mm × 0.25 μm, Agilent). The compounds in feedstock and products were identified by GC-MS. For comparison, a commercial hydrotreating catalyst (bought from SINOPEC QILU CO. LTD) was also tested.
3 Results and discussion
3.1 Catalyst characterization
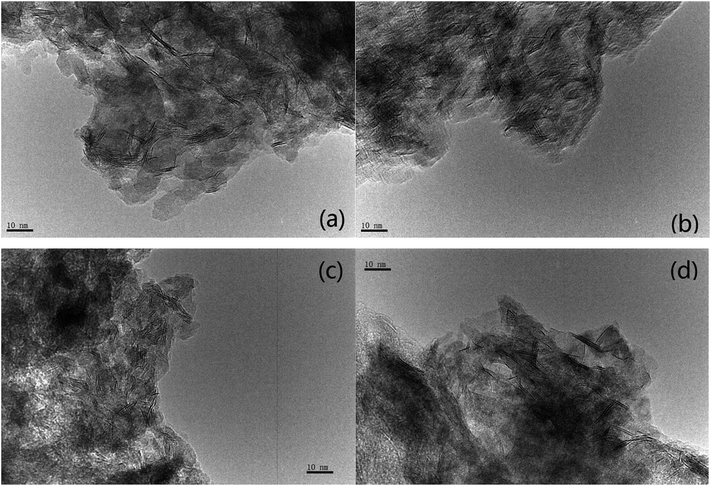
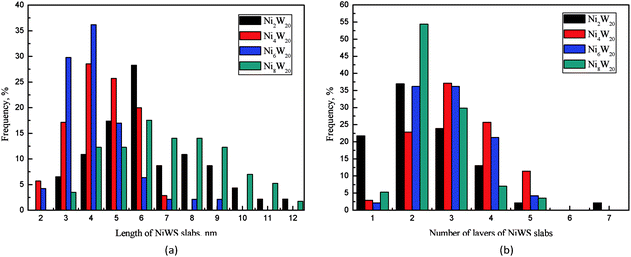
The transmission electron microscopy images of four NiW catalysts are shown in Fig. 3. Black lines representing the layered NiWS slabs could be observed clearly. The length and number of layers of slabs were determined statistically through more than 10 images and calculated from measurement of more than 50 slabs. The distribution of the slab length and the number of slab layers are shown in Fig. 4. As shown in Fig. 4(a), the slab length with the highest frequency on Ni2W20 and Ni8W20 was 6 nm, while the corresponding value on Ni4W20 and Ni6W20 was 4 nm. More than 90% of the slabs on Ni4W20 and Ni6W20 had a length of 3–6 nm. However, the distributions of slab length on Ni2W20 and Ni8W20 were more even. Some slabs on Ni2W20 and Ni8W20 showed a length of more than 10 nm. From Fig. 4(b), the frequency of two layers was the highest on Ni2W20 and Ni8W20. More slabs were observed with three layers rather than two layers on Ni4W20. The frequencies of slabs with two layers and three layers were almost the same on Ni6W20.
The average length and number of layers of NiWS slabs are given in Table 3. As shown in TEM images and calculation results, Ni2W20 and Ni8W20 exhibited longer and thinner NiWS slabs. Ni4W20 and Ni6W20 had the highest average number of layers and the lowest average length of NiWS slabs, respectively, among the four NiW catalysts.
| Ni2W20 | Ni4W20 | Ni6W20 | Ni8W20 | |
|---|---|---|---|---|
| Average length/nm | 6.39 | 4.46 | 4.17 | 6.96 |
| Average number of layers | 2.46 | 3.20 | 2.89 | 2.49 |
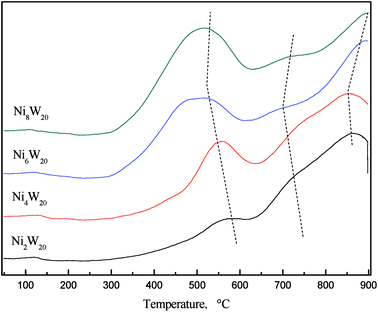
Fig. 5 shows the H2-TPR curves of NiW catalyst precursors. Two peaks and a peak shoulder could be seen in each curve. The low temperature peak at 400–600 °C was regarded as the reduction of NiO, while the high temperature peak at 700–800 °C was considered as the reduction of WO3.22 The low temperature reduction peak shifted to the low temperature zone as the Ni/W ratio increased from 0.1 to 0.3. NiO reduction could occur at a temperature as low as 300 °C when the Ni/W ratio was 0.3 and 0.4. However, the peak at high temperature shifted to higher temperature when Ni/W ratio increased. The results indicated that as Ni/W increased, NiO reduction was easier to achieve while WO3 reduction was not. More nickel in the catalyst caused the separation of the high temperature reduction peak and the peak shoulder, which might represent the reduction of Ni–W–O phase. The shifting of the peak shoulder to a lower temperature was attributed to a high amount of nickel, weakening the strength of the interaction between Ni and W.
The physical properties of NiW catalysts were listed in Table 4. As shown, Ni6W20 had the highest BET surface area and pore volume. The average pore diameter decreased with the increase of Ni/W ratio.
| BET surface area (m2 g−1) | Pore volume (cm3 g−1) | Average pore diameter (nm) | |
|---|---|---|---|
| Ni2W20 | 112.1 | 0.193 | 5.18 |
| Ni4W20 | 103.6 | 0.191 | 5.16 |
| Ni6W20 | 133.4 | 0.212 | 4.47 |
| Ni8W20 | 129.8 | 0.182 | 4.16 |
The physical properties of NiWP catalysts with different phosphorus contents are shown in Table 5. With the increase of phosphorus content in catalyst, the BET surface area of NiWP catalysts increased and reached a maximum of 138.2 m2 g−1 at NiWP-0.8, then decreased significantly to 100.0 m2 g−1 when phosphorus content was 1.5 wt%. Pore volume showed the same trend as that of BET surface area. It could be deduced from the trend of BET surface area and pore volume that pores were blocked when phosphorus content was more than 1 wt%.
| BET surface area (m2 g−1) | Pore volume (cm3 g−1) | Average pore diameter (nm) | |
|---|---|---|---|
| Ni6W20 | 133.4 | 0.212 | 4.47 |
| NiWP-0.5 | 120.0 | 0.186 | 4.54 |
| NiWP-0.8 | 138.2 | 0.206 | 4.25 |
| NiWP-1.2 | 122.6 | 0.188 | 4.48 |
| NiWP-1.5 | 100.0 | 0.154 | 4.47 |
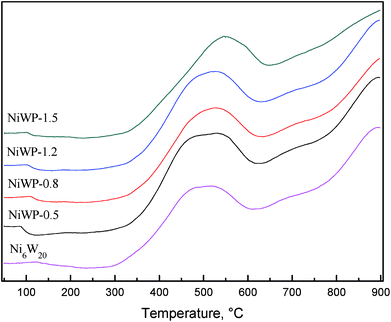
Fig. 7 shows the H2-TPR curves of Ni6W20 and NiWP catalyst precursors. From the Fig. 7, the curves of NiWP-0.5, NiWP-0.8 and NiWP-1.2 were almost the same. However, the peaks at low temperature and high temperature both shifted to a higher temperature with further addition of phosphorus. A 50 °C shifting of the low temperature peak was observed between the curves of NiWP-1.5 and the other three curves. The variation showed that the reduction of metal oxides would be difficult when the phosphorus content on the catalyst was 1.5 wt% or more. This may have been due to a stable phase combining with phosphorus and metal, which resulted in the formation of a Al2O3 support.
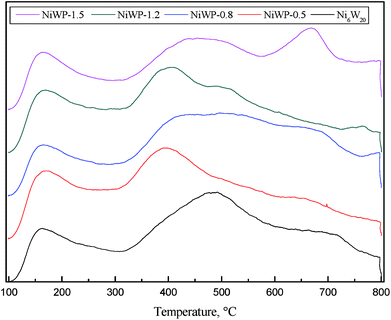
Fig. 8 shows the NH3-TPD curves of Ni6W20 and NiWP catalysts. Three or four peaks were observed in the curves. Compared with Ni6W20, the peak at low temperatures (<200 °C) on NiWP catalysts was almost the same. However, a large difference was seen on the peaks at higher temperatures (>300 °C) after the addition of phosphorus. The peak at 500 °C on the Ni6W20 curve shifted to a lower temperature by about 100 °C. Desorption peaks became broader and some peak shoulders appeared when phosphorus was added in the catalyst. The results revealed that the addition of phosphorus weakened the strength of medium acid sites and new acid sites were generated.
The acid sites concentration of Ni6W20 and NiWP catalysts obtained from the Gaussian deconvolution are reported in Table 6. According to the maximum temperature, the acid sites were classified into the weak (<300 °C), medium (300–550 °C) and strong (>550 °C). As can be seen in Table 6, the medium acid was dominant on all catalysts. After adding 0.5 wt% phosphorus, the weak acid concentration on the catalyst increased, accompanied with a decrease of medium and strong acid concentrations. As phosphorus content further increased, the concentration of medium and strong acids first increased, and then decreased. The observed medium acid concentration trend was: NiWP-0.8 > Ni6W20 > NiWP-0.5 > NiWP-1.5 > NiWP-1.2. The change of acid site distribution of Ni6W20 and NiWP catalysts indicated that an increase of phosphorus content on the catalysts resulted in the increase of the weak acid concentration, followed by an increase of the medium and strong acid concentrations. However, the improvement on acid concentration by adding phosphorus was only slight when the phosphorus content was higher than 1 wt%.
| Weak acid (<300 °C) | Medium acid (300–550 °C) | Strong acid (>550 °C) | Total | |
|---|---|---|---|---|
| a The value in the parentheses is the percentage of various strength of acid. | ||||
| Ni6W20 | 0.110 (26)a | 0.220 (52) | 0.094 (22) | 0.423 |
| NiWP-0.5 | 0.157 (37) | 0.201 (48) | 0.064 (15) | 0.422 |
| NiWP-0.8 | 0.085 (18) | 0.239 (50) | 0.151 (32) | 0.475 |
| NiWP-1.2 | 0.117 (29) | 0.163 (41) | 0.118 (30) | 0.397 |
| NiWP-1.5 | 0.096 (23) | 0.195 (47) | 0.124 (30) | 0.415 |
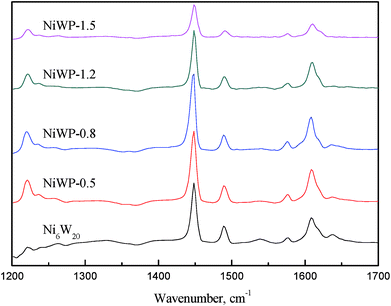
Fig. 9 shows the FT-IR spectrogram of pyridine adsorbed on Ni6W20 and NiWP catalysts outgassed at 200 °C. According to literature,23,24 the band at 1540 cm−1 was due to pyridine absorbed on Brønsted acid sites, and the band at 1450 cm−1 could be assigned to coordinately bound pyridine interacting with Lewis acid sites. As for the band at 1490 cm−1, it was associated with an interaction of pyridine with both Brønsted and Lewis acid sites.23 The results indicated that both the Ni6W20 and NiWP catalysts showed Brønsted and Lewis acid sites while the height of peaks at corresponding bands were quite different. For Ni6W20, the peak at 1540 cm−1 could be observed which represented the Brønsted acid sites. After the addition of phosphorus the peak was less distinct and it could hardly be observed when the phosphorus loading was 1.5 wt%. As for the band at 1450 cm−1, the height of the peak increased first and then decreased as the loading of phosphorus and the same trend was observed at 1490 cm−1.
The relative acidic amount of Brønsted and Lewis acid sites were determined by calculating the areas of pyridine adsorption bands at 1540 and 1450 cm−1, and were summarized in Table 7. We could see from the table that the Brønsted acid amount decreased obviously after the introduction of phosphorus. This might be due to the loss of tetrahedral framework aluminum.25 The Lewis acid amount increased first and then decreased, during which the highest was reached on NiWP-0.5. As for total acid amount, the highest was obtained on NiWP-0.8 because of its relatively higher Brønsted acid amount compared with other NiWP catalysts. This was in accordance with the results in Table 6. From the ratio of Brønsted acid to Lewis acid we could also find that the acid type was changed significantly after adding phosphorus. Therefore, the addition of phosphorus not only changed the total acid sites concentration, but also modified the types of acid sites on the surface of catalysts by decreasing Brønsted acid sites and generating new Lewis acid sites.
| Brønsted acid amount | Lewis acid amount | Total acid amount | B/L | |
|---|---|---|---|---|
| Ni6W20 | 60.03 | 293.88 | 353.91 | 0.204 |
| NiWP-0.5 | 28.94 | 423.22 | 452.16 | 0.068 |
| NiWP-0.8 | 42.88 | 412.04 | 454.92 | 0.104 |
| NiWP-1.2 | 11.27 | 236.45 | 247.72 | 0.048 |
| NiWP-1.5 | 4.87 | 178.03 | 182.90 | 0.027 |
3.2 NiW catalysts activity
The HDO, HDS, and HDN conversion as a function of Ni/W ratio is shown in Fig. 10. From Fig. 10, HDO, HDS and HDN conversion on all catalysts approached or exceeded 90%, which shows the high hydrotreatment activity of NiW catalysts. HDO conversion approached 100% when the Ni/W ratio was higher than 0.1. HDO conversion was higher than HDS and HDN conversion, which mostly reside in the 90–95% range. With an increasing Ni/W ratio, HDO conversion first increased and then decreased slightly. HDN conversion decreased to less than 90% at a Ni/W ratio of 0.2, and then went up to about 93%. In contrast, HDS conversion decreased linearly when the Ni/W ratio increased, though the variation was less than 2%.
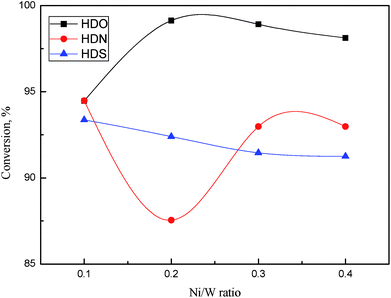 | ||
Fig. 10 HDO, HDS, and HDN conversions as a function of Ni/W ratio. Reaction conditions: 360 °C, 6 MPa, LHSV = 1 h−1, H2/oil ratio 1000![[thin space (1/6-em)]](https://www.rsc.org/images/entities/char_2009.gif) : :![[thin space (1/6-em)]](https://www.rsc.org/images/entities/char_2009.gif) 1. 1. | ||
Complex reaction networks with several reaction pathways were reported on cresol HDO,26 DBT HDS,27 and quinoline HDN.28 The hydrogenation (HYD) pathway, which is hydrogenation followed by deoxygenation, was the main pathway for o-cresol HDO. However, the direct desulfurization (DDS) pathway dominated DBT HDS. In quinoline HDN, the hydrogenation of aromatic rings was followed by C–N bond breaking. The decrease of DBT HDS conversion with the increase of Ni/W ratio showed that direct desulfurization activity was not enhanced by the addition of Ni in this range. The HDO conversion increased notably as the Ni/W ratio increased from 0.1 to 0.2, indicating that the hydrogenation activity of the aromatic ring was improved. The decrease of HDN conversion in the same Ni/W range might be due to the low denitrogenation activity, since it was more difficult for C–N bond to break than the C–O bond.
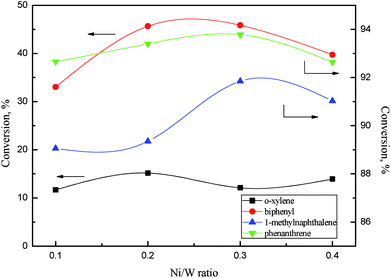 | ||
Fig. 11 Aromatics conversions as a function of Ni/W ratio. Reaction conditions: 360 °C, 6 MPa, LHSV = 1 h−1, H2/oil ratio 1000![[thin space (1/6-em)]](https://www.rsc.org/images/entities/char_2009.gif) : :![[thin space (1/6-em)]](https://www.rsc.org/images/entities/char_2009.gif) 1. 1. | ||
There was a relationship between the aromatic hydrogenation activity and NiWS slab features on NiW catalysts. Ni4W20 and Ni6W20 had smaller average slab lengths and a larger average number of layers, showing better aromatics hydrogenation performance than Ni2W20 and Ni8W20. The thickness and length of slabs strongly affected the hydrogenation activity of the NiW catalyst. Yao et al.30 reported that more diaromatics were hydrogenated into monoaromatics over NiMo sulfide with larger number of slab layers. Wang et al.31 and Vradman et al.32,33 believed that multilayered structure facilitated the π adsorption of aromatic ring on slabs, resulting in the high hydrogenation activity.
| GC retention time/min | Compounds | Content/wt% | GC retention time/min | Compounds | Content/wt% |
|---|---|---|---|---|---|
a Reaction conditions: 360 °C, 6 MPa, LHSV = 1 h−1, H2/oil ratio 1000![[thin space (1/6-em)]](https://www.rsc.org/images/entities/char_2009.gif) : :![[thin space (1/6-em)]](https://www.rsc.org/images/entities/char_2009.gif) 1. 1. |
|||||
| 3.332 | Methylcyclohexane | 12.48 | 18.462 | Tetrahydroquinoline | 0.40 |
| 3.604 | Toluene | 2.01 | 18.898 | 1-Methylnaphthalene | 2.55 |
| 3.867 | Ethylcyclohexane | 0.31 | 19.245 | Phenylcyclohexane | 4.6 |
| 4.194 | Ethylbenzene | 0.26 | 21.635 | Biphenyl | 6.99 |
| 5.206 | O-Xylene | 8.6 | 25.184 | Tetradecahydrophenanthrene | 2.39 |
| 5.813 | Propylcyclohexane | 3.4 | 29.418 | Butyltetralin | 0.24 |
| 6.211 | Propylbenzene | 0.39 | 31.548 | Cetane | 22.52 |
| 6.392 | Butylcyclohexane | 0.29 | 34.972 | Octahydrophenanthrene | 3.77 |
| 6.812 | Butylbenzene | 0.29 | 35.393 | DBT | 0.12 |
| 8.665 | O-Cresol | 0.19 | 35.707 | Tetrahydrophenanthrene | 1.59 |
| 11.444 | Methyldecalin | 3.34 | 36.123 | Phenanthrene | 0.76 |
| 18.372 | Methyltetralin | 19.5 | |||
3.3 NiWP catalysts activity
By investigating a series of catalysts with different Ni/W ratio, we thought the catalyst with Ni/W ratio of 0.3 had best hydrotreating activity considering the heteroatom removal and aromatics hydrogenation. Thus we fixed the nickel and tungsten content in NiWP/Al2O3 at 6 wt% and 20 wt% and further investigated the influence of phosphorus content on hydrotreatment activity.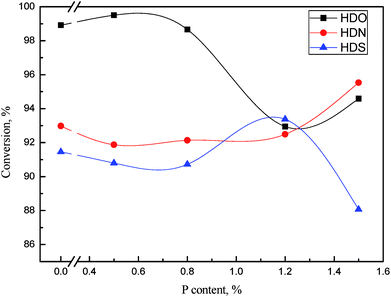 | ||
Fig. 12 HDO, HDS, and HDN conversions as a function of phosphorus content. Reaction conditions: 360 °C, 6 MPa, LHSV = 1 h−1, H2/oil ratio 1000![[thin space (1/6-em)]](https://www.rsc.org/images/entities/char_2009.gif) : :![[thin space (1/6-em)]](https://www.rsc.org/images/entities/char_2009.gif) 1. 1. | ||
Across the range of phosphorus content on catalysts, HDO, HDS, and HDN conversion showed different trends. Additionally, the corresponding phosphorus contents with the highest conversion of HDO, HDS, and HDN were not the same. This was probably due to the difference of HDO, HDS, and HDN reaction networks, which caused many active sites on catalysts to be responsible for heteroatom removal, rather than one or two sites. The addition of phosphorus might increase a certain kind of active site, thus increasing the activity of the corresponding reaction. However the reaction networks of HDO, HDS and HDN were combination of many kinds of reactions. The change of catalytic activity caused by the phosphorus content exhibited three different trends during the removal of three kinds of heteroatoms. When the phosphorus content was higher than 1 wt%, the HDN and HDS activity was relatively high while the HDO activity was low. The content of phenols in LTCTO were much higher than that of N-containing compounds and S-containing compounds, thus the phosphorus content should be lower than 1 wt% considering the total removal rate of heteroatoms.
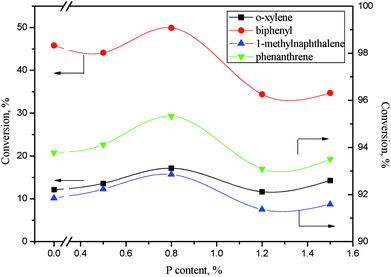 | ||
Fig. 13 Aromatics conversions as a function of phosphorus content. Reaction conditions: 360 °C, 6 MPa, LHSV = 1 h−1, H2/oil ratio 1000![[thin space (1/6-em)]](https://www.rsc.org/images/entities/char_2009.gif) : :![[thin space (1/6-em)]](https://www.rsc.org/images/entities/char_2009.gif) 1. 1. | ||
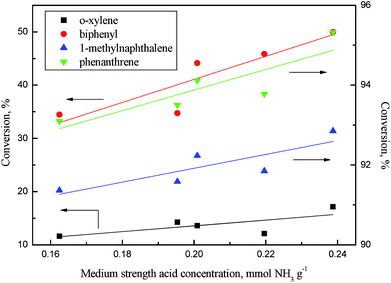
As revealed in Table 6, the acid concentrations on catalysts were impacted by the addition of phosphorus. Fig. 14 shows the relation of the aromatics conversion over NiWP and Ni6W20 catalysts and the medium acid concentration on catalysts. It can be clearly seen from Fig. 14 that the conversions of monoaromatics, diaromatics, and triaromatics were all linear with the medium acid concentration on catalysts. NiWP-0.8 had the highest medium acid concentration (see Table 6), showing the best performance on aromatic hydrogenation. The results indicated that the medium acid site on the NiW catalysts was probably the active site for the hydrogenation of aromatic ring. The conversion of aromatics and other compounds, whose reaction network included a rate-controlling step of aromatic ring hydrogenation, would be improved with the increase of medium acid concentration. Therefore, increased medium acid concentration was valuable to increasing the activity of hydrotreated LTCTO, since aromatic compounds were dominant in the coal tar oil. With regard to NiW sulfide catalysts for LTCTO hydrotreatment, performance could be improved by addition of phosphorus with an optimal content of 0.8 wt%.
4 Conclusions
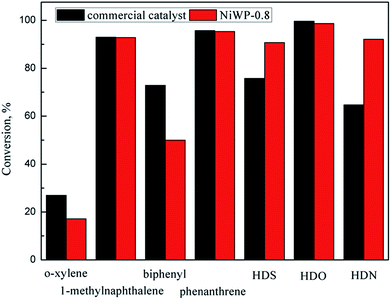
The hydrotreatment performance of eight model compounds that simulate LTCTO using NiW/Al2O3 and NiWP/Al2O3 catalysts was examined. HDO, HDS, and HDN conversion showed different trends when Ni/W ratio changed since main pathways in their reaction networks were not the same. Higher Ni/W ratios facilitated the reduction of metal oxides on the catalysts. Aromatic hydrogenation conversions on Ni4W20 and Ni6W20 were higher than that on Ni2W20 and Ni8W20 because shorter and thicker multilayer slabs were formed on Ni4W20 and Ni6W20 samples. The addition of phosphorus changed the acid concentrations and acid types on the catalysts. NiWP-0.8 exhibited the best hydrotreatment performance among all catalysts, with a 5% improvement of monoaromatics and diaromatics conversions than the catalysts without phosphorus. Further addition of phosphorus would inhibit the reduction of catalyst precursor and decrease the acid concentration and BET surface area of the catalysts. The linear relation between aromatics conversion and the medium acid concentration on catalysts suggested that medium acid was probably the active site for the hydrogenation of aromatic rings. NiWP-0.8 showed higher HDS and HDN conversion than a commercial catalyst, indicating that NiWP-0.8 was a promising catalyst for LTCTO hydrotreatment.Conflicts of interest
There are no conflicts to declare.Acknowledgements
This work was supported by the National Science Foundation of China (No. 51661125012), the program of Introducing Talents of Discipline to University (No. B08026) and the Fundamental Research Funds for the Central Universities.References
- Z. Guo, Q. Wang, M. Fang, Z. Luo and K. Cen, Appl. Energy, 2014, 113, 1301–1314 CrossRef CAS.
- T. Kan, H. Wang, H. He, C. Li and S. Zhang, Fuel, 2011, 90, 3404–3409 CrossRef CAS.
- K. Tao, X. Sun, H. Wang, C. Li and U. Muhammad, Energy Fuels, 2012, 26, 3604–3611 CrossRef.
- J. Kusy, L. Andel, M. Safarova, J. Vales and K. Ciahotny, Fuel, 2012, 101, 38–44 CrossRef CAS.
- D. Li, Z. Li, W. Li, Q. Liu, Z. Feng and Z. Fan, J. Anal. Appl. Pyrolysis, 2013, 100, 245–252 CrossRef CAS.
- H. Wang, Y. Cao, D. Li, U. Muhammad, C. Li, Z. Li and S. Zhang, J. Renewable Sustainable Energy, 2013, 5, 13101 CrossRef.
- P. Na, D. Cui, R. Li, S. Quan, K. H. Chung, H. Long, Y. Li, Y. Zhang, S. Zhao and C. Xu, Energy Fuels, 2012, 26, 5719–5728 CrossRef.
- R. Wandas, J. Surygala and E. Śliwka, Fuel, 1996, 75, 687–694 CrossRef CAS.
- J. L. Lemberton, M. Touzeyidio and M. Guisnet, Appl. Catal., 1989, 54, 91–100 CrossRef CAS.
- J. L. Lemberton, M. Touzeyidio and M. Guisnet, Appl. Catal., 1989, 54, 101–109 CrossRef CAS.
- J. L. Lemberton, M. Touzeyidio and M. Guisnet, Appl. Catal., A, 1991, 79, 115–126 CrossRef CAS.
- Y. G. Wang, H. Y. Zhang, P. Z. Zhang, D. P. Xu, K. Zhao and F. J. Wang, J. Fuel Chem. Technol., 2012, 40, 12014 Search PubMed.
- H. Y. Zhang, Y. G. Wang, P. Z. Zhang, X. C. Lin and Y. F. Zhu, J. Fuel Chem. Technol., 2013, 41, 1085–1091 CrossRef CAS.
- W. Cui, W. Li, R. Gao, H. Ma, D. Li, M. Niu and X. Lei, Energy Fuels, 2017, 31, 3768–3783 CrossRef CAS.
- W. H. Wiser, S. Singh, S. A. Qader and G. R. Hill, Prepr. Pap. - Am. Chem. Soc., Div. Fuel Chem., 1969, 13(4), 350–357 Search PubMed.
- R. Rosal, F. V. Diez and H. Sastre, Ind. Eng. Chem. Res., 1992, 31, 1007–1012 CrossRef CAS.
- M. J. Girgis and B. C. Gates, Ind. Eng. Chem. Res., 1994, 33(5), 1098–1106 CrossRef CAS.
- M. J. Girgis and B. C. Gates, Ind. Eng. Chem. Res., 1994, 33(10), 1098–1106 CrossRef CAS.
- M. Sun, X. X. Ma, Q. X. Yao, R. C. Wang, Y. X. Ma, G. Feng, J. X. Shang, L. Xu and Y. H. Yang, Energy Fuels, 2015, 25, 1140–1145 CrossRef.
- C. Li and K. Suzuki, Resour., Conserv. Recycl., 2010, 54, 905–915 CrossRef.
- W. Tang, M. Fang, H. Wang, P. Yu, Q. Wang and Z. Luo, Chem. Eng. J., 2014, 236, 529–537 CrossRef CAS.
- A. Duan, Z. Gao, Q. Huo, C. Wang, D. Zhang, M. Jin, G. Jiang, Z. Zhao, H. Pan and K. Chung, Energy Fuels, 2010, 24, 796–803 CrossRef CAS.
- X. Zhu, S. Liu, Y. Song and L. Xu, Appl. Catal., A, 2005, 288, 134–142 CrossRef CAS.
- S. Qu, G. Liu, F. Meng, L. Wang and X. Zhang, Energy Fuels, 2011, 25, 2808–2814 CrossRef CAS.
- M. Göhlich, W. Reschetilowski and S. Paasch, Microporous Mesoporous Mater., 2011, 142, 178–183 CrossRef.
- J. Horáček, G. Šťávová, V. Kelbichová and D. Kubička, Catal. Today, 2013, 204, 38–45 CrossRef.
- D. Valencia and T. Klimova, Catal. Commun., 2012, 21, 77–81 CrossRef CAS.
- O. Y. Gutiérrez, A. Hrabar, J. Hein, Y. Yu, J. Han and J. A. Lercher, J. Catal., 2012, 295, 155–168 CrossRef.
- Y. Saih and K. Segawa, Appl. Catal., A, 2009, 353, 258–265 CrossRef CAS.
- S. Yao, Y. Zheng, S. Ng, L. Ding and H. Yang, Appl. Catal., A, 2012, 435–436, 61–67 CrossRef CAS.
- L. Wang, B. Shen, F. Fang, F. Wang, R. Tian, Z. Zhang and L. Cui, Catal. Today, 2010, 158, 343–347 CrossRef CAS.
- L. Vradman, M. V. Landau and M. Herskowitz, Fuel, 2003, 82, 633–639 CrossRef CAS.
- L. Vradman, M. V. Landau, M. Herskowitz, V. Ezersky, M. Talianker, S. Nikitenko, Y. Koltypin and A. Gedanken, J. Catal., 2003, 213, 163–175 CrossRef CAS.
- P. Atanasova, T. Tabakova, C. Vladov, T. Halachev and A. L. Agudo, Appl. Catal., A, 1997, 161, 105–119 CrossRef CAS.
- P. M. Mortensen, J. D. Grunwaldt, P. A. Jensen, K. G. Knudsen and A. D. Jensen, Appl. Catal., A, 2011, 407, 1–19 CrossRef CAS.
| This journal is © The Royal Society of Chemistry 2017 |

