DOI:
10.1039/C7RA10083C
(Paper)
RSC Adv., 2017,
7, 48501-48511
Simple and green route for preparation of tin phosphate catalysts by solid-state grinding for dehydration of glucose to 5-hydroxymethylfurfural (HMF)†
Received
11th September 2017
, Accepted 11th October 2017
First published on 17th October 2017
Abstract
This work demonstrated a simple and green method for the synthesis of tin phosphate (SnP) catalysts for glucose to HMF transformation. In this process, SnP catalysts with various P/Sn mole ratios were prepared by solid-state grinding of a mixture of SnCl4·5H2O and NaH2PO4·2H2O at room temperature, followed by drying with or without calcination. Physicochemical properties of the obtained SnP catalysts were investigated using N2-physisorption, XRD, FT-IR, Py-IR, NH3-TPD, and XPS techniques. The characterization studies showed that varying P/Sn ratio affected the textural and surface acid properties of the SnP catalysts. The activity of these catalysts was evaluated for dehydration of glucose for HMF production in water using recyclable low boiling point organic solvent THF as HMF extracting solvent. The experimental results revealed that the catalytic activity of SnP catalysts depended on the P/Sn ratio. Under the optimized reaction conditions, 98% glucose conversion, and 61% HMF yield were achieved over as-synthesized SnP-1 catalyst with P/Sn mole ratio of 1.0. The high catalytic activity of the SnP-1 catalyst can be attributed to its high acidity and the presence of water tolerant Brønsted and Lewis acid sites. Furthermore, the catalytic activity of SnP-1 catalyst is retained even after four cycles indicating its good catalytic stability.
1. Introduction
With fast depletion of fossil deposits, increased demand for energy and chemicals, and growing environmental concerns, finding sustainable and economical methods for the synthesis of chemicals and fuels is one of the key challenges across the globe.1 Biomass, a carbon neutral renewable energy resource, is widely available on earth with an annual production of 170 billion metric tons.2 Lignocellulose biomass consists of cellulose, hemicellulose and lignin as its main constituents. Lignocellulose biomass has long been a main energy source for mankind, but it can also be a renewable chemical source. For example, polysaccharides in cellulose and hemicellulose can undergo hydrolysis to yield sugar monomers that can be converted into platform chemicals such as 5-hydroxymethylfurfural (HMF) and furfural by acid catalyzed dehydration reactions.3,4 5-HMF has been identified as one of the top 14 most promising high-value bio-based chemicals by the US Department of Energy,5 which can be used as a versatile platform molecule for production of polymers, fuel and value added chemicals through different chemical reactions.6 For instance, oxidation of 5-HMF produces 2,5-furandicarboxylic acid (FDCA), a monomer for the production of bio-based polyethylene furandicarboxylate (PEF) polymer, a promising bio-replacement for polyethylene terephthalate (PET) PET plastic.6 Furthermore, HMF can be upgraded to bio-fuels such as 2,5-dimethylfuran (DMF) and 5-ethoxymethylfurfural (EMF), by hydrogenation and etherification, respectively.3,7 HMF also can be used for the production of C7–C15 liquid alkanes via a series of aldol condensation, dehydration and hydrogenation reactions.8 Recently, our group reported a one-pot synthesis of phenol-hydroxymethyl furfural (PHMF) resin by reacting phenol with HMF derived from glucose in situ in the presence of CrCl2/CrCl3 and tetraethylammonium chloride catalysts.9
According to literature review,6 catalytic conversion of glucose to HMF involves tandem process. In the first step, glucose isomerizes to fructose in the presence of base, enzymes or Lewis acids and while Brønsted acid facilitate the dehydration of fructose to HMF. Up to now, innumerable homogeneous and heterogeneous catalysts have been developed for glucose to HMF conversion. Homogeneous catalysts including ionic liquids,10 lanthanide salts in ionic liquids,11 metal salts with mineral acids.12 Despite the advantages, there are certain drawbacks associated with these processes, such as difficult catalyst recovery, high cost of ionic liquids, and corrosion when mineral acids are used. To overcome these challenges inexpensive heterogeneous bi-functional solid acid catalysts are more desirable for large scale industrial applications from the perspectives of simple recovery and reusability of the catalysts, and low cost compared to homogeneous catalysts. In addition, processes using heterogeneous catalysts and water as a reaction medium for glucose to HMF conversion, are more cost effective and environmentally benign. Watanabe et al. reported titanium and zirconium oxide catalysts for the dehydration of glucose at 200 °C, where HMF yields were below 20%.13 HMF yield of 53% was obtained with glucose using Sn-beta zeolite and HCl catalysts in a THF/H2O–NaCl bi-phasic system.14 As high as 49% and 58% HMF yield was obtained using modified niobium and tantalum oxide catalyst, respectively, with glucose at different reaction temperatures.15,16 Nijhuis et al. reported HMF selectivity in the range of 30–60% obtained with glucose using aluminium, zirconium, titanium and niobium based phosphate catalysts again in a water/MIBK (or 2-methyltetrahydrofuran) biphasic system.17 Titanium hydrogenphosphate was reported to catalyze glucose to HMF in water/THF bi-phasic system, producing HMF at a yield 35% at 60% glucose conversion.18 Atanda et al. reported HMF yields of 81% at glucose conversion of 97% using phosphate TiO2 catalyst at 175 °C in water-butanol bi-phasic system.19 HMF yield of 63% from glucose in DMSO was obtained at 140 °C using chromium phosphate catalyst.20 Very recently various other heterogeneous bi-functional solid acid catalysts including SO42−/Al2O3–SnO2,21 Nb-SBA-15,22 ordered mesoporous Nb–W oxide,23 SAPO-34,24 and calcium phosphate,25 have been exploited for HMF production. Although, all these catalysts were efficient for HMF production but the preparation of these catalysts often have disadvantages such as multistep processing, need for the delicate pH control and generation of vast amount of environmental waste. In view of this, simple and environmental benign process for synthesis of highly efficient bi-functional solid acid catalyst for production of 5-HMF from glucose is highly attractive.
Heterogeneous tin phosphate (SnP) catalyst containing both Brønsted and Lewis acid sites are efficient for dehydration of glucose to HMF.26,27 Generally, tin phosphates were prepared using a conventional wet-chemistry route. Compared with the wet-chemistry route, simple solid-state grinding at a low temperature is more attractive and greener catalyst preparation route for synthesis of tin phosphate catalysts. In some recent studies, solid heterogeneous catalysts prepared via the solid-state grinding method, demonstrated better activities than those prepared by wet-chemistry route.28,29 To the best of our knowledge, there is no report on preparation of tin phosphate catalysts with the solid-state grinding route for conversion of glucose to HMF.
In the present work, tin phosphate catalysts were prepared using solid state grinding as a simple and green catalyst preparation method. The catalytic performance of the catalysts was evaluated for the production of HMF from glucose in a water/THF biphasic system. Effects of the P/Sn ratio and other reaction parameters such as reaction time, temperature, and catalyst loading on glucose conversion and HMF selectivity were investigated.
2. Materials and methods
2.1 Materials
Reagent grade SnCl4·5H2O (98%), NaH2PO4·2H2O (99%), D-glucose (99.9%), 5-hydroxymethyl furfural (99%), trimethylamine (>99%) and micro crystalline cellulose were purchased from Sigma-Aldrich. Tetrahydrofuran (THF, HPLC grade), water (HPLC grade), acetonitrile (HPLC grade) were obtained from Caledon Laboratories. All reagents were used as received without any further purification.
2.2 Methods
2.2.1. Catalyst preparation. A series of tin phosphate catalysts, abbreviated as SnP catalysts, with different P/Sn mole ratios, was prepared by solid-state grinding. In a typical synthesis, a mixture of 3.506 g SnCl4·5H2O and 1.56 g of NaH2PO4·2H2O was ground manually in a mortar for 15 min at room temperature. The resulting mixture was then oven dried in air at 100 °C for 12 h. The obtained white solid was then washed with deionized water followed by oven drying again at 100 °C for 12 h. This as-synthesized catalysts were denoted as SnP-1. Similarly, other SnP catalysts by varying the P/Sn mole ratio (0.5, 1.5 and 2.0) were synthesized in the same procedure as described above, and denoted as SnP-0.5, SnP-1.5, and SnP-2. All as-synthesized catalysts were directly used without any further treatment. It was proved that extraction of as-synthesized SnP catalysts with dilute HCl did not remove any tin from the samples, confirming the absence of Sn2+ ions and the presence of Sn4+ ions in as-synthesized catalysts samples. Moreover, the SnP-1 catalyst was also calcined at various calcination temperatures (300–500°), denoted as SnP-1-300, SnP-1-400 and SnP-1-500. For comparison, SnP-1 catalyst was also prepared using the wet-chemical method reported elsewhere.30 This catalyst was denoted as SnP-1-L.
2.2.2. Catalyst characterization. Powder X-ray diffraction (XRD) patterns of the catalysts were measured using an X-ray diffractometer (Rigaku RINT 2500, Tokyo, Japan) with Ni-filtered Cu Kα radiation (λ = 1.5406 Å) with a scan speed of 2° min−1 and a scan range of 2–80° at 30 kV and 15 mA. N2 physisorption was performed using Quadrasorb SI automated surface area and pore size analyzer. Prior to N2 adsorption measurement, the sample was degassed at 200 °C until a stable static vacuum of less than 5 × 10⁻³ Torr was achieved. Subsequently, N2 adsorption was performed at −196 °C. The surface area of the catalysts was measured using multi point BET in the relative pressure range of 0.05–0.3. The total pore volume was estimated at a relative pressure of 0.99.Fourier transform infrared (FT-IR) spectra of the catalysts were recorded on a PerkinElmer IR spectrometer using the KBr disc method. The nature of acid sites (Brønsted and Lewis) of the catalysts was determined by pyridine adsorbed FT-IR spectroscopy. Prior to the pyridine adsorption, the catalysts samples were dried at 150 °C for 1 h. To the dried samples (∼50 mg each) in a glass vial, 0.1 mL of pyridine was added directly. Then, the excess pyridine was removed by heating the sample at 120 °C for 1 h. After cooling the sample to room temperature, FT-IR spectra of pyridine adsorbed catalysts samples were recorded. X-ray photo electron spectroscopy (XPS) measurements were conducted on an Axis Nova spectrometer using a monochromatic Al K (alpha) source (15 mA, 14 kV). The XPS instrument was calibrated using Au as standard. For energy calibration, the carbon 1s photoelectron lines were used. The carbon 1s binding energy was taken as 285 eV. The Kratos charge neutralizer system was used on all specimens.
Total acidity of the catalysts was measured by NH3-TPD. NH3-TPD measurement was carried out on a ChemBET Pulsar TPR/TPD automated chemisorption analyzer. In a typical experiment, about 0.1 g of the sample was pre-treated at 300 °C for 1 h under a flow of helium (99.9%, 120 mL min−1). After pretreatment, the sample was saturated with anhydrous ammonia at 100 °C for 10 min and subsequently flushed with He at the same temperature to remove any physisorbed ammonia. Then, TPD analysis was carried out from ambient temperature to 500 °C with a heating rate of 10 °C min−1 and the desorbed ammonia was measured by thermal conductivity detector.
2.2.3. Catalytic activity tests. The dehydration experiments of glucose was carried out in a two-phase reaction system consisting of water/THF (1![[thin space (1/6-em)]](https://www.rsc.org/images/entities/char_2009.gif) :
:![[thin space (1/6-em)]](https://www.rsc.org/images/entities/char_2009.gif) 3 v/v). NaCl was added to the reaction medium to sustain a biphasic reaction medium as well as improve the efficiency of HMF extraction by the organic layer.31 In a typical experiment, a custom-made micro scale reactor was charged with 0.06 g of catalyst, 0.15 g of glucose substrate in NaCl saturated water (3 mL) and THF (9 mL). The temperature of the reaction was maintained at 155–185 °C. Upon completion of the reaction, the reaction mixture was rapidly quenched to room temperature, the catalyst was separated by centrifugation and the supernatant liquid of both phases was collected for analysis. Both the aqueous and the organic phases were analyzed using high performance liquid chromatography (HPLC) (Waters 2690 HPLC) equipped with refractive index detector (Waters 410) and UV detectors (Waters 484) using a XBridge Amide, 3.5 μm, 4.6 × 250 mm analytical column. 80/20 acetonitrile/water with 0.2% triethylamine was used as mobile phase with a flow rate of 0.6 mL min−1. The column temperature was maintained at 35 °C. Glucose conversion, HMF selectivity and yield were calculated according to the following equations.
3 v/v). NaCl was added to the reaction medium to sustain a biphasic reaction medium as well as improve the efficiency of HMF extraction by the organic layer.31 In a typical experiment, a custom-made micro scale reactor was charged with 0.06 g of catalyst, 0.15 g of glucose substrate in NaCl saturated water (3 mL) and THF (9 mL). The temperature of the reaction was maintained at 155–185 °C. Upon completion of the reaction, the reaction mixture was rapidly quenched to room temperature, the catalyst was separated by centrifugation and the supernatant liquid of both phases was collected for analysis. Both the aqueous and the organic phases were analyzed using high performance liquid chromatography (HPLC) (Waters 2690 HPLC) equipped with refractive index detector (Waters 410) and UV detectors (Waters 484) using a XBridge Amide, 3.5 μm, 4.6 × 250 mm analytical column. 80/20 acetonitrile/water with 0.2% triethylamine was used as mobile phase with a flow rate of 0.6 mL min−1. The column temperature was maintained at 35 °C. Glucose conversion, HMF selectivity and yield were calculated according to the following equations.| |
 | (1) |
| |
 | (2) |
| |
 | (3) |
3. Results and discussion
3.1 N2 physisorption
Specific surface area of a heterogeneous catalyst plays a pivotal role in its activity since catalytic reactions normally take place on the surface of the catalyst. Besides, the total pore volume of the catalyst is also an important factor affecting the reaction rate. Table 1 represents the BET surface area and total pore volume of various SnP catalysts prepared by solid-state grinding method. It can be seen that the as-synthesized SnP catalysts with a P/Sn mole ratio ranging from 0.5 to 2.0 exhibit relatively low specific surface areas (<40 m2 g−1). Among them, the SnP-1 catalyst with P/Sn mole ratio of 1.0 exhibits the highest specific surface area of 38 m2 g−1. The SnP-0.5 catalyst has similar BET specific surface area (34 m2 g−1) as the SnP-1 catalyst, and further increasing the P/Sn mole ratio from 1.0 to 1.5 and 2.0 decreases the surface area of the catalyst. The total pore volume of the catalysts also follows the same trend. The decrease in surface area and total pore volume of the SnP catalysts at higher P/Sn mole ratio (>1) is likely due to an excess phosphate content, which might block the pores of the catalyst, as also observed by Khder et al.32 Liu et al. reported effects of P/Al mole ratio on thermal stability, surface area and pore volume of the aluminum phosphate (AlPO) catalysts,33 where a higher P/Al ratio (>1.1) led to significant decreases in surface area, pore volume and thermal stability of AlPO catalysts.
Table 1 Physicochemical properties of as-synthesized and calcined SnP catalysts
| Catalyst |
P/Sn mole ratio |
BET surface area (m2 g−1) |
Total pore volume (cm3 g−1) |
Total acidity (mmol g−1) |
B/L ratio (I1535/I1455) |
| SnP-0.5 |
0.5 |
34 |
0.07 |
0.98 |
0.448 |
| SnP-1 |
1 |
38 |
0.13 |
1.23 |
0.542 |
| SnP-1.5 |
1.5 |
15 |
0.09 |
0.67 |
0.295 |
| SnP-2 |
2 |
9 |
0.07 |
0.52 |
0.152 |
| SnP-1-300 |
1 |
34 |
0.13 |
1.13 |
0.402 |
| SnP-1-400 |
1 |
34 |
0.11 |
0.58 |
0.323 |
| SnP-1-500 |
1 |
32 |
0.16 |
0.29 |
0.113 |
The calcined SnP-1 catalysts obtained at various calcination temperatures (300–500°), have a similar BET surface area (32–34 m2 g−1), although slightly lower than that of the as-synthesized SnP-1 catalyst (38 m2 g−1). The slight decrease in surface area at an increased calcination temperature might be due to an increase in the catalyst's crystallinity.
3.2 FT-IR
The structural evaluation of SnP catalysts was characterized by FT-IR spectroscopy. FT-IR results of the as-synthesized SnP catalysts with different P/Sn mole ratios are presented in Fig. 1. The sharp FT-IR band observed at 1060 cm−1 is corresponding to the asymmetric stretching of Sn–O–P bond vibration.34 A broad IR band appeared between 3300–3700 cm−1 is attributed to the asymmetric stretching vibrations of O–H groups, arising from the interlayer water and P–OH groups.35,36 As such, it is expected that the intensity of the band at 3500 cm−1 increases with increasing the P/Sn mole ratio from 0.5 to 1. While further increasing P/Sn mole ratio from 1 to 1.5 and 2, however, there is a slight decrease in intensity of the peak of asymmetric stretching vibrations of O–H (the interlayer water and P–OH groups), which might be caused by the increase in crystallinity of the catalysts forming Sn–O–P structure with the increase of P/Sn mole ratio, as evidenced by the XRD results (Fig. 2). The sharp band at 1630 cm−1 is ascribed to water H–O–H bending vibration of water molecules coordinated with the phosphate groups.36 Similarly, and the intensity of this band decreased when the P/Sn ratio > 1, likely due to the increase in crystallinity of the catalysts. The peak at 2400 cm−1 is attributed to P–O–H stretching vibration responsible for Brønsted acidity of the SnP catalysts.37 The peak intensifies while increasing P/Sn mole ratio from 0.5 to 1.0, but levels off at P/Sn mole ratio > 1.0. The FT-IR bands between 700–450 cm−1 can be ascribed to the Sn–O bond vibrations in Sn–O–P matrix.38 Besides, there are no IR bands between 900–700 cm−1, suggesting the absence of P–O–P bond in the catalysts. Thus, the FT-IR measurements of the as-synthesized SnP catalysts with various P/Sn ratios from 0.5 to 2, prove the successful formation of the metal phosphate Sn–O–P framework by solid-state grinding method. Furthermore, it was found that the calcined SnP-1 catalyst exhibits a similar FT-IR spectrum as that of the as-synthesized SnP-1 catalyst (Fig. S1†), while the intensity of the bands decreases with the increase of calcination temperature of the catalyst particularly at 3500 and 1630 cm−1 (related to water and O–H groups), which can be due to the loss of surface adsorbed and crystallized water molecules in calcination.
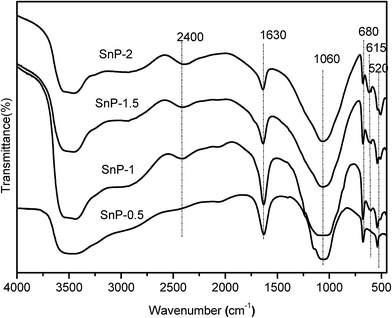 |
| | Fig. 1 FT-IR spectra of as-synthesized SnP catalysts. | |
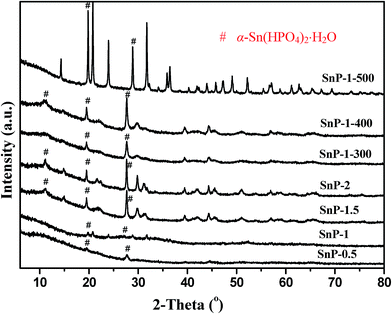 |
| | Fig. 2 XRD pattern of SnP catalysts. # α-Sn(HPO4)2·H2O. | |
3.3 XRD
Powder X-ray diffraction (XRD) was employed to elucidate the crystalline structure analysis of the catalyst samples. Fig. 2 shows the XRD patterns of as-synthesized SnP catalysts with different P/Sn ratios, as compared with the calcined SnP-1 catalysts at different temperatures. It can be seen that as-synthesized SnP-0.5 and SnP-1 catalysts do not exhibit strong characteristic crystalline peaks, indicating amorphous nature of these catalysts, accounting for their higher BET surface areas (Table 1). The diffraction lines ascribed to the Sn–O–P compounds such as α-Sn(HPO4)2·H2O in SnP-1.5 and SnP-2 catalysts are stronger those of the SnP-0.5 and SnP-1 catalysts, suggesting increased crystallinity of these as-synthesized catalysts at higher P/Sn mole ratio.35,39 As reported by Chen et al., the formation of α-Sn(HPO4)2·H2O was confirmed by solid state reaction of SnCl4·5H2O and P2O5 at lower temperatures.40 In the present study, the characteristic crystalline XRD peaks were observed at 2θ equal to 10, 20 and 27° in SnP-1.5 and SnP-2 catalysts corresponding to layered structure of tin phosphate was reported in the literature.36 The increase in crystallinity of the catalysts at higher P/Sn ratio (>1) may cause a decrease in surface area of the catalysts, as evidenced by the BET results (Table 1). The surface hydroxyl groups and amorphous nature of the catalyst would affect the acidity of the catalysts, hence play an important role in the catalytic dehydration of glucose. As clearly shown in Fig. 2, increasing P/Sn ratio (>1) or calcination temperature results in an increase in crystallinity of the catalyst relative to the as-synthesized SnP-1 catalyst, likely due to loss of adsorbed and crystallized water molecules, as confirmed by the FT-IR results (Fig. 1 and S1†) where the IR bands at 3500 and 1630 cm−1 corresponding to the stretching and bending vibrational modes of water molecules both decrease in intensity with increasing the P/Sn ratio or calcination temperature. Thus, a higher P/Sn ratio (>1) or higher calcination temperature would negatively influence the activities of the SnP catalysts. On the other hand, there is no indication of formation of pyrophosphate phase although the catalyst was calcined at 500 °C indicating the thermal stability of the as-synthesized SnP catalysts. Furthermore, there are no diffraction lines related to either SnCl4·5H2O or NaH2PO4 observed in the as-synthesized SnP catalysts, indicating that the tin phosphate species (Sn–O–P) were successfully synthesized through the solid-state grinding method.
3.4 NH3-TPD
As widely reported, the total acidity of a catalyst plays a prominent role in determining its catalytic performance in glucose to HMF conversion.14–21 The NH3-TPD patterns of as-synthesized SnP catalysts with different P/Sn mole ratios are shown in Fig. 3, where the NH3-TPD measurements were carried out in the temperature range of 100–600 °C. The total acidity of these catalysts was calculated by integration of the NH3 desorption peaks, and the values are presented in Table 1. In the case of SnP-0.5 catalyst, only one broad NH3 desorption peak was detected in the range of 120–450 °C, peaked at about 225 °C (Tmax), representing the presence of weak-to-medium acidity. For SnP-1 catalyst, the Tmax is slightly shifted to a higher temperature region with marked increase in the peak intensity, indicating a much greater total acidity (1.23 mmol g−1 for SnP-1 vs. 0.98 mmol g−1 for SnP-0.5, as shown in Table 1). With SnP-1.5 and SnP-2 catalysts, a further increase in the P/Sn ratio from 1 to 2, two ammonia desorption peaks with lower intensity peaks were observed between the temperature range of 150–550 °C. Whereas, compared with that of SnP-1, the total acidity of the SnP-1.5 and SnP-2 catalysts decrease significantly, which could be due to their increased crystallinity (Fig. 1 and 2). Combining the results of NH3-TPD and FT-IR, it can be concluded that there is a strong relationship between the total acidity and the P–OH groups on catalyst surface. It is apparent that the P–OH groups on the surface of SnP catalysts are the main source of acidic sites, which was actually supported by the highest activity for the as-synthesized SnP-1 catalyst among all catalysts testes (to be discussed later). The acidity values for all catalysts are presented in Table 1 and the NH3-TPD desorption profiles for the calcined SnP-1 catalyst are shown in Fig. S2.† The total acidity of the catalyst decreased with increasing the calcination temperature, as similarly reported by another study using tin phosphate catalyst.41 Similar observation (a higher calcination temperature led to a decrease in the intensity of the Brønsted and Lewis acid sites) was obtained from the pyridine FT-IR measurements to be presented in the subsequent section.
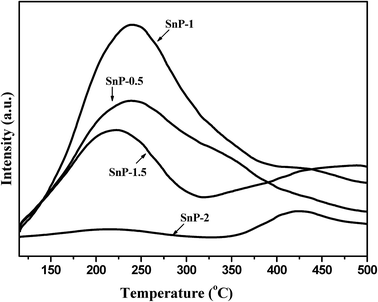 |
| | Fig. 3 NH3-TPD pattern of as-synthesized SnP catalysts. | |
3.5 Pyridine-adsorbed FT-IR
FT-IR spectra of pyridine adsorption were recorded to probe accessible surface acid sites. Fig. 4 shows the pyridine-adsorbed FT-IR spectra of the as-synthesized SnP catalysts with different P/Sn mole ratios. The presence of lone pair of electrons on nitrogen in a pyridine molecule can coordinate with both metal atom and acidic proton on the catalyst surface to show different characteristic FT-IR stretching vibrations in the finger print region of 1400–1600 cm−1.42 The FT-IR band at 1536 cm−1 is assigned to characteristic protonation of pyridine molecule onto Brønsted acidic sites, while the IR band at 1458 cm−1 is assigned to pyridine molecule coordinated to Lewis acidic metal atom.41 The presence of strong band at 1488 cm−1 is due to pyridine adsorbed onto both Brønsted and Lewis acidic sites.43 The Brønsted acidity arises from the presence of geminal P–OH groups, whereas Lewis acidity originates from the electron deficient Sn4+ sites. As shown in Fig. 4, the as-synthesized SnP-0.5 and SnP-1 catalysts exhibit strong Brønsted and Lewis acidity compared to SnP-1.5 and SnP-2 catalysts with a higher P/Sn mole ratio, which is in a good agreement with the total acidity of the catalysts quantified by NH3-TPD measurements (Fig. 3 and Table 1). The decrease in acidity of the SnP catalysts with a too high P/Sn mole ratio is possibly due to loss of surface hydroxyl groups as evidenced from FT-IR results (Fig. 1). The B/L ratios are calculated and presented in Table 1 based on the intensity of Brønsted (B) and Lewis acid (L) sites obtained from the absorbance at 1536 and 1458 cm−1, respectively. The B/L ratio is maximum for the as-synthesized SnP-1 catalyst and decrease thereafter with a further increase in P/Sn mole ratio. Fig. S3† illustrates the pyridine-adsorbed FT-IR spectra of the SnP-1 catalyst calcined at different temperatures, revealing decreases in both Brønsted and Lewis acidic sites with increasing the calcination temperature.
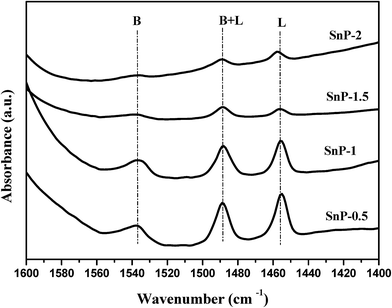 |
| | Fig. 4 Pyridine adsorbed FT-IR spectra of as-synthesized SnP catalysts. | |
3.6 XPS
XPS measurements were performed to examine the valence states of individual elements presented in the catalyst samples and the surface atomic composition. The XPS spectra of tin, phosphorus and oxygen for the as-synthesized SnP-1 catalyst are shown in Fig. 5. The core level spectra of Sn 3d consist of two broad but distinct binding energy peaks, at 480–488 eV and 488.5–497 eV, corresponding to 3d5/2 and 3d3/2, respectively. These two peaks are characteristic of tetravalent Sn4+.44 The O 1s spectra of the SnP-1 catalyst show a broad peak between 524–533 eV which could be attributed to oxygen bonded to both tin and phosphorous.30 The broad peak of O 1s spectra might also be attributed to the surface hydroxyl groups, contributing to the total acidity of the catalyst.45 Similarly, the photoelectron spectra of P 2p also shows a broad peak (126–134 eV), resulted from the P–O bonds on the surface that can be enhanced by the phosphorus atoms bonded to the hydroxyl groups, contributing to the acid sites on the catalyst surface.44 However, the binding energy of Sn 3d, O 1s and P 2p shifted slightly towards lower values compared to that reported in the literature.44 This might be due to the possible influence of residual sodium and chloride ions on the catalyst surface. The surface atomic composition of as-synthesized SnP-1 catalyst is presented in Table 2, determined based on XPS peak areas of individual elements on the catalyst surface. The surface P/Sn atomic ratio was calculated accordingly for both fresh and spent catalysts, and the ratio is 0.72 (fresh SnP-1) and 0.86 (spent SnP-1), both slightly lower than 1.0 (the bulk P/Sn mole ratio) though.
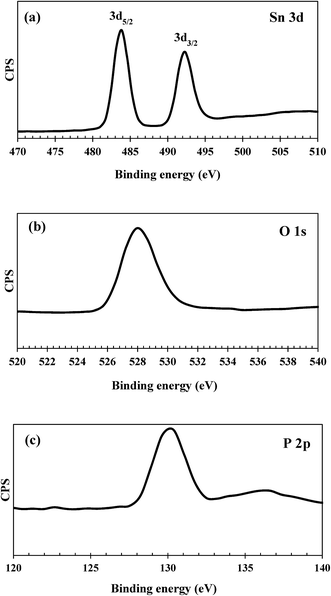 |
| | Fig. 5 (a) Sn 3d, (b) O 1s and (c) P 2p XPS spectra of the as-synthesized SnP-1 catalyst. | |
Table 2 Surface atomic composition of the SnP-1 catalyst determined by XPS
| Catalyst |
Surface atomic composition (atom%) |
P/Sn mole ratio |
| Sn |
P |
O |
Na |
Cl |
| SnP-1 (fresh) |
12.5 |
9.0 |
51.5 |
3.5 |
8.4 |
0.72 |
| SnP-1 (spent) |
10.7 |
9.3 |
58.3 |
4.6 |
13.6 |
0.86 |
4. Catalytic activity
The catalytic performance of the as-synthesized SnP catalysts prepared by solid-state grinding method at low temperatures was evaluated for dehydration of glucose to HMF in a water/THF biphasic system. A biphasic solvent system has several advantages over most of the single-phase organic solvent systems for HMF production.46 Since the boiling point of THF is low (normal boiling point 66 °C), it can easily be recovered by simple evaporation after reaction. Moreover, the bi-phasic solvent system can avoid the HMF degradation and prevent formation of soluble and insoluble humins through reactions of HMF with the reaction intermediates from glucose. These secondary reactions would decrease the HMF yield and selectivity.
4.1 Effects of reaction temperature
With the as-synthesized SnP-1 catalyst, the effects of reaction temperature on glucose conversion and HMF yield were evaluated at various temperatures from 155–185 °C at a specific reaction time (1 h), and the results are shown in Fig. 6. The reaction temperature had played a very significant role on both glucose conversion and HMF selectivity and yield. At 155 °C, only 66.5% of glucose conversion and 22% HMF yield was obtained. As presented in Fig. 7, besides HMF, fructose was also considerably detected in the reaction products at temperatures below 175 °C, suggesting the reaction proceeds through first isomerization of glucose to fructose over Lewis acidic Sn4+ sites followed by fructose dehydration to HMF on Brønsted acidic sites.47–49 Fructose was not identified at 185 °C probably due to its complete transformation to HMF. It has also been reported that levulinic acid and formic acid formed by rehydration of HMF could be produced during the dehydration of glucose to HMF.49 However, in the present work these by-products were not detected, possibly due to the fact that the acidity of the SnP acid catalyst is not strong enough to catalyze rehydration of HMF. This was verified by conducting a control experiment with HMF and the same quantity of catalyst at 175 °C for 1 h, in the same biphasic reaction medium, and levulinic acid was not detected either, suggesting that rehydration of HMF is negligible with the as-synthesized SnP-1 catalyst. This result is supported by a study by Jimenez-Morales et al. where HMF was not rehydrated over a mesoporous tantalum phosphate catalyst.50 The carbon balance is below 100% over SnP-1 catalyst, beside HMF and fructose, the other by-products are organic phase soluble and insoluble humin substances which are not detected by HPLC analysis.
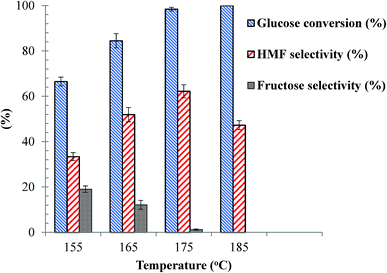 |
| | Fig. 6 Effects of reaction temperature on glucose dehydration over SnP-1 catalyst. Other reaction conditions: glucose/catalyst 2.5![[thin space (1/6-em)]](https://www.rsc.org/images/entities/char_2009.gif) : :![[thin space (1/6-em)]](https://www.rsc.org/images/entities/char_2009.gif) 1 w/w, NaCl 0.525 g, water 3 mL, THF 9 mL, 1 h. 1 w/w, NaCl 0.525 g, water 3 mL, THF 9 mL, 1 h. | |
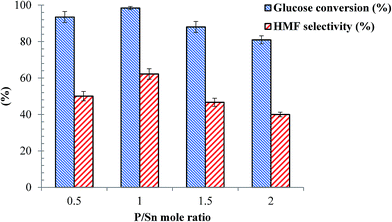 |
| | Fig. 7 Effects of P/Sn mole ratio for the SnP catalysts on dehydration reaction of glucose. Other reaction conditions: glucose/catalyst 2.5![[thin space (1/6-em)]](https://www.rsc.org/images/entities/char_2009.gif) : :![[thin space (1/6-em)]](https://www.rsc.org/images/entities/char_2009.gif) 1 w/w, NaCl 0.525 g, water 3 mL, THF 9 mL, 175 °C, 1 h. 1 w/w, NaCl 0.525 g, water 3 mL, THF 9 mL, 175 °C, 1 h. | |
As clearly shown in the Fig. 6, when increasing the temperature from 155 to 175 °C the conversion of glucose and HMF selectivity and yield all increased simultaneously, while the performance of the catalyst declined as the reaction temperature increased further to 185 °C. The maximum HMF yield (61%) was obtained with the for the SnP-1 catalyst at 175 °C. Therefore, 175 °C was selected as the reaction temperature to study the effects of other process parameters.
4.2 Effects of P/Sn mole ratio and calcination temperature of the catalyst
Effects of the P/Sn mole ratio for the as-synthesized SnP catalysts was tested for glucose dehydration to HMF at 175 °C at 1 h reaction time, and the results are presented in Fig. 8. From the figure, clearly the catalytic activity of these catalysts, in particular their HMF selectivity, is considerably influenced by the P/Sn mole ratio. As shown in Fig. 7, high glucose conversion (95–100%) and HMF selectivity (50–65%) were achieved over the SnP-0.5 and SnP-1 catalysts with a P/Sn mole ratio of 0.5 and 1, respectively. The conversion of glucose as well as HMF selectivity decreased with further increase of P/Sn ratio to 1.5 and 2.0. The maximum glucose conversion (98%) and HMF selectivity (>60%) were obtained with the as-synthesized SnP-1 catalyst (P/Sn = 1), leading to the maximum HMF yield 61% and highest ever reported on SnP catalysts in spite of high catalyst loading in the present protocol.26,27 The variation in catalytic activity with the P/Sn mole ratio for the SnP catalysts could be explained based on the characteristics of the catalysts as discussed in the previous sections, in particular with respect to the acidity of the catalysts. As presented previously (Table 1, Fig. 3 and 4), the as-synthesized SnP-1 catalyst has high concentration of total acid sites and the presence of strong Brønsted and Lewis acidic sites on the catalyst surface, which may account for its high catalytic activity (in terms of glucose conversion and HMF selectivity). The reduced HMF yield at a higher P/Sn ratio (>1) might be due to the decrease in surface area, low IB/IL ratio, and low acidity on the catalyst surface (Table 1). Moreover, in situ generated SnP catalyst was also tested under present experimental conditions by adding tin salt (SnCl4·5H2O) phosphorus salt (NaH2PO4·2H2O) with mole ratio of P/Sn equal to 1, afforded 27% HMF yield from the total conversion of glucose, illustrating that ex situ prepared SnP catalyst was more active than in situ generated SnP catalyst.
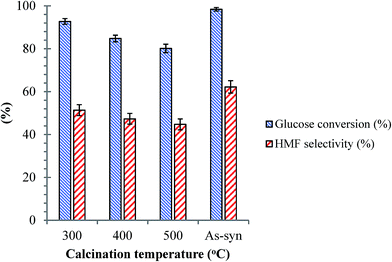 |
| | Fig. 8 Effects of calcination temperature for the SnP-1 catalyst on dehydration of glucose. Other reaction conditions: glucose/catalyst 2.5![[thin space (1/6-em)]](https://www.rsc.org/images/entities/char_2009.gif) : :![[thin space (1/6-em)]](https://www.rsc.org/images/entities/char_2009.gif) 1 w/w, NaCl 0.525 g, water 3 mL, THF 9 mL, 175 °C, 1 h. 1 w/w, NaCl 0.525 g, water 3 mL, THF 9 mL, 175 °C, 1 h. | |
As discussed previously, the surface hydroxyl groups on SnP catalysts are the main source of Brønsted acid sites. The surface hydroxyl groups on SnP catalysts are temperature sensitive, and they could diminish by calcination, influencing the catalysts' activity. The catalytic performance of the SnP-1 catalyst calcined at different temperatures between 300 to 500 °C is compared with that of the as-synthesized catalyst, as shown in Fig. 8. It can be seen that the HMF selectivity decreased with increasing calcination temperature of the catalyst, and the glucose conversion dropped from 98 to 80% and HMF yield decreased from 61 to 35% after calcination of the as-synthesized SnP catalyst at 500 °C. This proves that Brønsted acidic sites (associated with the hydroxyl groups) on the catalyst surface played a significant role in dehydration of glucose to HMF.
4.3 Effects of reaction time, catalyst loading and initial glucose concentration
Influence of reaction time on dehydration of glucose over the as-synthesized SnP-1 catalyst was investigated under the following reaction conditions: glucose/cat. 2.5![[thin space (1/6-em)]](https://www.rsc.org/images/entities/char_2009.gif) :
:![[thin space (1/6-em)]](https://www.rsc.org/images/entities/char_2009.gif) 1 w/w, NaCl (0.525 g), H2O (3 mL), THF (9 mL) and 175 °C. The results are illustrated in Fig. 9. Clearly, the reaction time has a marked effect on both glucose conversion and HMF yield. The results demonstrated that although the glucose conversion increased with increasing reaction time, both the HMF selectivity and yield maximized at approx. 60 min. With a longer reaction time, secondary reactions were likely promoted, to form by-products such as soluble/non-soluble humins, although not detectable by HPLC, leading to substantial decreases in both HMF selectivity and yield. As shown in the figure, the HMF yield decreased from 61 to 45% as the reaction time increased from 60 to 90 min. According to these results, the best reaction time for HMF production with the as-synthesized SnP-1catalyst at 175 °C was approx. 60 min.
1 w/w, NaCl (0.525 g), H2O (3 mL), THF (9 mL) and 175 °C. The results are illustrated in Fig. 9. Clearly, the reaction time has a marked effect on both glucose conversion and HMF yield. The results demonstrated that although the glucose conversion increased with increasing reaction time, both the HMF selectivity and yield maximized at approx. 60 min. With a longer reaction time, secondary reactions were likely promoted, to form by-products such as soluble/non-soluble humins, although not detectable by HPLC, leading to substantial decreases in both HMF selectivity and yield. As shown in the figure, the HMF yield decreased from 61 to 45% as the reaction time increased from 60 to 90 min. According to these results, the best reaction time for HMF production with the as-synthesized SnP-1catalyst at 175 °C was approx. 60 min.
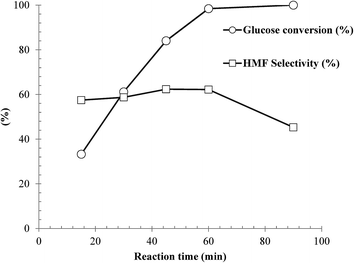 |
| | Fig. 9 Influence of reaction time on dehydration of glucose over the as-synthesized SnP-1 catalyst. Other reaction conditions: glucose/catalyst 2.5![[thin space (1/6-em)]](https://www.rsc.org/images/entities/char_2009.gif) : :![[thin space (1/6-em)]](https://www.rsc.org/images/entities/char_2009.gif) 1 w/w, NaCl 0.525 g, water 3 mL, THF 9 mL, 175 °C. 1 w/w, NaCl 0.525 g, water 3 mL, THF 9 mL, 175 °C. | |
Furthermore, we examined the effects of catalyst loading on glucose conversion and HMF selectivity and yield during glucose dehydration over the as-synthesized SnP-1 catalyst at 175 °C and 1 h. As shown in Fig. S4,† varying the catalyst loading, by changing the glucose/catalyst weight ratio (w/w) remarkably influenced both glucose conversion and HMF selectivity and yield. As shown in the figure, with increasing glucose/catalyst weight ratio from 2.0 to 3.0, or in other words decreasing catalyst loading, glucose conversion decreases continuously as expected. Whereas, there is an optimal catalyst loading for HMF selectivity and yield, corresponding to glucose/catalyst weight ratio of 2.5. Above this optimum value, a higher catalyst loading or more catalytic active sites led to a decreased HMF selectivity and yield, which might be caused by the promoted side-reactions between the HMF and glucose or other reaction intermediates, resulting in the formation of humin substances.51 More investigation on the possible cause of the optimal catalyst loading and effective measures to restrict the side-reactions will be of one of our future research interests.
Next, effects of initial glucose concentration (or substrate concentration) were examined with the as-synthesized SnP-1 catalyst under the best conditions obtained by far (glucose/catalyst 2.5![[thin space (1/6-em)]](https://www.rsc.org/images/entities/char_2009.gif) :
:![[thin space (1/6-em)]](https://www.rsc.org/images/entities/char_2009.gif) 1 w/w, NaCl 0.525 g, H2O 3 mL, THF 9 mL, 175 °C, and 1 h). From an economical and industrial point of view, it is of interest to employ a higher substrate concentration for higher HMF productivity and process throughput. As such, two levels of substrate concentration (wt% glucose in water) were tested, 5 wt% and 10 wt%, and the results are presented in Fig. S5.† As clearly shown in the figure, when the reaction was performed with 10 wt% glucose concentration, the HMF yield was decreased to 42% compared with >60% HMF yield with 5 wt% glucose concentration although approx. 100% glucose conversion was obtained under both substrate concentrations (Fig. 12). Such sharp decrease in the catalyst's HMF selectivity again may be due to the formation of humins via condensation polymerization of HMF with glucose and other reactive intermediates.52
1 w/w, NaCl 0.525 g, H2O 3 mL, THF 9 mL, 175 °C, and 1 h). From an economical and industrial point of view, it is of interest to employ a higher substrate concentration for higher HMF productivity and process throughput. As such, two levels of substrate concentration (wt% glucose in water) were tested, 5 wt% and 10 wt%, and the results are presented in Fig. S5.† As clearly shown in the figure, when the reaction was performed with 10 wt% glucose concentration, the HMF yield was decreased to 42% compared with >60% HMF yield with 5 wt% glucose concentration although approx. 100% glucose conversion was obtained under both substrate concentrations (Fig. 12). Such sharp decrease in the catalyst's HMF selectivity again may be due to the formation of humins via condensation polymerization of HMF with glucose and other reactive intermediates.52
4.4 Effect of catalyst preparation method
Encouraged by the efficacy of solid-state synthesis of SnP-1 catalyst for converting glucose to 5-HMF, we compared the catalytic activity of SnP-1 catalyst prepared by the conventional liquid-state as a reference catalyst with solid-state SnP-1 catalyst. As shown in Fig. 10, there is a marginal difference in catalytic activity between these catalysts, indicating the superiority of SnP-1 catalyst prepared via solid-state method to the SnP-1 catalyst prepared by liquid-state method. The difference in catalytic activity was mainly attributed to the difference in acid properties of the catalysts. The total acidity of the catalysts was measured by NH3-TPD as shown in Fig. S6.† It reveals that SnP-1-L catalyst showed a lower concentration of total acid sites (0.64 mmol g−1), compared to SnP-1 catalyst prepared by solid-state method (Table 1). The structural properties of SnP-1-L catalyst was well reported in the literature and the total acidity of SnP-1-L catalyst is comparable to that reported in the literature.30
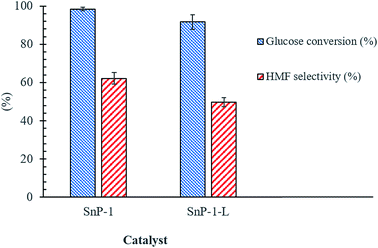 |
| | Fig. 10 Effect of catalyst preparation method on glucose to HMF conversion. Other reaction conditions: glucose/catalyst 2.5![[thin space (1/6-em)]](https://www.rsc.org/images/entities/char_2009.gif) : :![[thin space (1/6-em)]](https://www.rsc.org/images/entities/char_2009.gif) 1 w/w, NaCl 0.525 g, water 3 mL, THF 9 mL, 175 °C, 1 h. 1 w/w, NaCl 0.525 g, water 3 mL, THF 9 mL, 175 °C, 1 h. | |
4.5 One-pot conversion of micro crystalline cellulose to HMF
Compared with glucose, cellulose or raw lignocellulosic biomass is certainly more economical substrate for HMF production as it is the most abundant naturally occurring feedstock.53 In the present study, we tested the catalytic efficiency of the as-synthesized SnP-1 catalyst toward hydrolysis-dehydration of microcrystalline cellulose for HMF production. Under the same glucose dehydration reaction conditions as described above (i.e., substrate/catalyst 2.5![[thin space (1/6-em)]](https://www.rsc.org/images/entities/char_2009.gif) :
:![[thin space (1/6-em)]](https://www.rsc.org/images/entities/char_2009.gif) 1 w/w, NaCl 0.525 g, water 3 mL, THF 9 mL, 175 °C and 1 h), conversion of microcrystalline cellulose with the as-synthesized SnP-1 catalyst was very poor, producing only 10% HMF yield (Fig. 11). The poor reactivity of cellulose may be due to the ineffective depolymerization (hydrolysis) of cellulose at 175 °C with the SnP-1 catalyst. Indeed, when the reaction temperature was increased to 190 °C, HMF yield increased significantly to 24%, suggesting that the SnP-1 catalyst could be promising catalyst for one-pot conversion of cellulose or other complex carbohydrates into HMF, while the reaction conditions need to be optimized.
1 w/w, NaCl 0.525 g, water 3 mL, THF 9 mL, 175 °C and 1 h), conversion of microcrystalline cellulose with the as-synthesized SnP-1 catalyst was very poor, producing only 10% HMF yield (Fig. 11). The poor reactivity of cellulose may be due to the ineffective depolymerization (hydrolysis) of cellulose at 175 °C with the SnP-1 catalyst. Indeed, when the reaction temperature was increased to 190 °C, HMF yield increased significantly to 24%, suggesting that the SnP-1 catalyst could be promising catalyst for one-pot conversion of cellulose or other complex carbohydrates into HMF, while the reaction conditions need to be optimized.
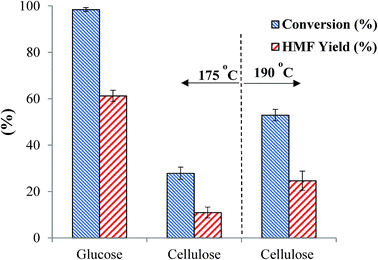 |
| | Fig. 11 Comparison of catalytic performance of the as-synthesized SnP-1 catalyst in the conversion of glucose or cellulose to HMF. Other reaction conditions: substrate/catalyst 2.5![[thin space (1/6-em)]](https://www.rsc.org/images/entities/char_2009.gif) : :![[thin space (1/6-em)]](https://www.rsc.org/images/entities/char_2009.gif) 1 w/w, NaCl 0.525 g, water 3 mL, THF 9 mL, 175 °C or 190 °C, 1 h. 1 w/w, NaCl 0.525 g, water 3 mL, THF 9 mL, 175 °C or 190 °C, 1 h. | |
4.6 Catalyst recyclability
The advantage of using a heterogeneous catalysis for chemical process is the recyclability of the catalyst. In this work, the recyclability of the as-synthesized SnP-1 catalyst was evaluated according to reported procedure in the literature.19,54 After initial glucose dehydration reaction (glucose/catalyst 2.5![[thin space (1/6-em)]](https://www.rsc.org/images/entities/char_2009.gif) :
:![[thin space (1/6-em)]](https://www.rsc.org/images/entities/char_2009.gif) 1 w/w, NaCl 0.525 g, H2O 3 mL, THF 9 mL, 175 °C, 1 h), the catalyst was recovered by centrifugation, washed first with methanol and then with water for three to four times and then oven dried at 100 °C for more than 12 hours. The retrieved catalyst was reused without any post treatment. Repeating the same catalyst recycling-reuse cycles for 5 times and the results are shown in Fig. 12. Both aqueous and organic phases of the reaction solution were analyzed to quantify the total amount of HMF formation in each run. During all these experiments, no fresh catalyst was supplied to compensate the loss of recovery. It can be observed from the figure that the catalytic activity of the as-synthesized SnP-1 catalyst in terms of HMF yield slightly decreases from ∼60% to ∼52% after five cycles. Although leaching of the Sn4+ ions in the catalyst is unavoidable in the process, the above results on recyclability of the catalyst demonstrate that the metal ions leached into the reaction medium was insignificant.
1 w/w, NaCl 0.525 g, H2O 3 mL, THF 9 mL, 175 °C, 1 h), the catalyst was recovered by centrifugation, washed first with methanol and then with water for three to four times and then oven dried at 100 °C for more than 12 hours. The retrieved catalyst was reused without any post treatment. Repeating the same catalyst recycling-reuse cycles for 5 times and the results are shown in Fig. 12. Both aqueous and organic phases of the reaction solution were analyzed to quantify the total amount of HMF formation in each run. During all these experiments, no fresh catalyst was supplied to compensate the loss of recovery. It can be observed from the figure that the catalytic activity of the as-synthesized SnP-1 catalyst in terms of HMF yield slightly decreases from ∼60% to ∼52% after five cycles. Although leaching of the Sn4+ ions in the catalyst is unavoidable in the process, the above results on recyclability of the catalyst demonstrate that the metal ions leached into the reaction medium was insignificant.
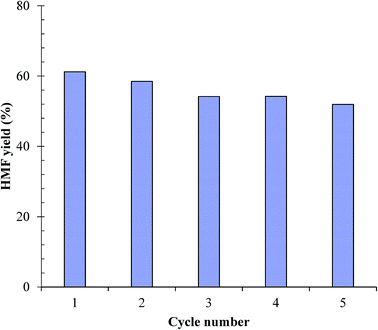 |
| | Fig. 12 Recyclability of the SnP-1 catalyst for conversion of glucose to HMF. Other reaction conditions: glucose/catalyst 2.5![[thin space (1/6-em)]](https://www.rsc.org/images/entities/char_2009.gif) : :![[thin space (1/6-em)]](https://www.rsc.org/images/entities/char_2009.gif) 1 w/w, NaCl 0.525 g, water 3 mL, THF 9 mL, 175 °C, 1 h. 1 w/w, NaCl 0.525 g, water 3 mL, THF 9 mL, 175 °C, 1 h. | |
4.7 Performance of the as-synthesized SnP-1 catalyst compared with some solid acid catalysts reported in the literature
The catalytic performance of the as-synthesized SnP-1 catalyst for dehydration of glucose to HMF in a biphasic reaction medium is compared with that of a few solid acid catalysts reported in the literature. The use of Sn-beta zeolite catalyst in combination with HCl achieved good yield for HMF (56.8%) but comparatively low glucose conversion (79%).14 Moreover, the use of homogeneous HCl catalyst led to product contamination and hence tedious clean up procedure was required to purify the product. The activities of mesoporous tantalum oxide and phosphate catalysts are much poorer, with HMF yield of only 23% and 32.8% and glucose conversion of 69% and 56.3%, respectively.50,52 Conversely, mesoporous aluminium doped MCM-41 catalyst realized good glucose conversion (87%), but exhibited low HMF yield (36%).51 As shown in Table 3, phosphated TiO2 (P–TiO2) catalyst exhibited very high glucose conversion (97%) and HMF yield (81%) but at a much longer reaction time (180 min),19 as compared with the glucose conversion (98%) and HMF yield (61%) at a much shorter reaction time (60 min) with the as-synthesized SnP-1 catalyst in this work. Mesoporous AlSiO catalyst55 and Nb-SBA-15 catalyst22 obtained similarly high HMF yield (62–63%) and glucose conversion (92–94%) at 160–165 °C for a longer time (90 and 190 min, respectively). Although, these catalysts showed good catalytic performance, preparation of these catalysts involved wet impregnation and high-temperature calcination for activation of the catalysts. In contrast, the as synthesized SnP-1 catalyst in this work is simple to prepare without the need of high-temperature activation process.
Table 3 Comparison of catalytic activity of the prepared SnP-1 catalyst with some solid acid catalysts reported in the literature
| Catalysts |
Solvents |
Temp. (°C) |
Time (min) |
Glucose conversion (%) |
HMF yield (%) |
Ref. |
| SnP-1 |
H2O/THF |
175 |
60 |
98 |
61 |
This work |
| Sn-beta, HCl |
H2O/THF |
180 |
70 |
79 |
56.8 |
14 |
| meso-Tantalum oxide |
H2O/MIBK |
175 |
90 |
69 |
23 |
52 |
| meso-Tantalum phosphate |
H2O/MIBK |
170 |
120 |
56.3 |
32.8 |
50 |
| meso-Al-MCM-41 |
H2O/MIBK |
195 |
150 |
87 |
36 |
51 |
| P–TiO2 |
H2O/butanol |
175 |
180 |
97 |
81 |
19 |
| meso-AlSiO |
H2O/THF |
160 |
90 |
91.7 |
63.1 |
53 |
| Nb-SBA-15 |
H2O/THF |
165 |
180 |
93.5 |
61.5 |
22 |
5. Conclusions
A simple and green method was demonstrated for synthesis of tin phosphate (SnP) catalysts with various P/Sn mole ratios via solid-state grinding of a mixture of SnCl4·5H2O and NaH2PO4·2H2O at room temperature. The SnP catalysts proved to be active for glucose dehydration to HMF. The P/Sn mole ratio for an as-synthesized catalyst can affect the physico-chemical properties of the catalyst, such as its specific surface area, crystallinity, total acidity and the nature of the acidic sites. The presence of strong Brønsted and Lewis acid sites on the as-synthesized SnP-1 catalyst with P/Sn mole ratio of 1.0 was confirmed by pyridine-adsorbed FT-IR spectroscopy, which accounts for its high activity for the conversion of glucose to HMF. With the as-synthesized SnP-1 catalyst, the HMF selectivity and yield were found to strongly depend on the reaction temperature, reaction time, catalyst loading, and the substrate concentration. The experimental results revealed that the catalytic activity of SnP catalysts depended on the P/Sn ratio. Under the best reaction conditions (glucose/catalyst 2.5![[thin space (1/6-em)]](https://www.rsc.org/images/entities/char_2009.gif) :
:![[thin space (1/6-em)]](https://www.rsc.org/images/entities/char_2009.gif) 1 w/w, NaCl 0.525 g, H2O 3 mL, THF 9 mL, 175 °C, 1 h), 98% glucose conversion, and 61% HMF yield were achieved over the as-synthesized SnP-1 catalyst (without calcination). This work demonstrated that highly effective SnP catalysts for conversion of glucose into HMF could be prepared by a simple, efficient and green method via solid-state grinding without need of energy-intensive calcination treatment. The new preparation method for SnP catalysts is easy to scale up and these catalysts could be useful for large scale continuous production of 5-HMF from glucose, which is currently under study in our laboratory.
1 w/w, NaCl 0.525 g, H2O 3 mL, THF 9 mL, 175 °C, 1 h), 98% glucose conversion, and 61% HMF yield were achieved over the as-synthesized SnP-1 catalyst (without calcination). This work demonstrated that highly effective SnP catalysts for conversion of glucose into HMF could be prepared by a simple, efficient and green method via solid-state grinding without need of energy-intensive calcination treatment. The new preparation method for SnP catalysts is easy to scale up and these catalysts could be useful for large scale continuous production of 5-HMF from glucose, which is currently under study in our laboratory.
Conflicts of interest
There are no conflicts to declare.
Acknowledgements
The authors acknowledge the financial support from NSERC Discovery Grants and the funding from BioFuelNet Canada, a Network of Centres of Excellence. One of the authors (C. X.) also gratefully acknowledges the funding from NSERC/FPInnovations Industrial Research Chair program and the ORF-RE Program in Forest Biorefinery.
References
- P. Lanzafame, G. Centi and S. Perathoner, Chem. Soc. Rev., 2014, 43, 7562–7580 RSC.
- A. Corma, S. Iborra and A. Velty, Chem. Rev., 2007, 107, 2411–2502 CrossRef CAS PubMed.
- T. Wang, M. W. Noltea and B. H. Shanks, Green Chem., 2014, 16, 548–572 RSC.
- I. Agirrezabal-Telleria, I. Gandarias and P. L. Arias, Catal. Today, 2014, 234, 42–58 CrossRef CAS.
- M. E. Zakrzewska, E. Bogel-Lukasik and R. Bogel-Lukasik, Chem. Soc. Rev., 2011, 111, 397–417 CrossRef CAS PubMed.
- R.-J. van Putten, J. C. van der Waal, E. de Jong, C. B. Rasrendra, H. J. Heeres and J. G. de Vries, Chem. Rev., 2013, 113, 1499–1597 CrossRef CAS PubMed.
- Z. Zhang and K. Deng, ACS Catal., 2015, 5, 6529–6544 CrossRef CAS.
- J. C. Serrano-Ruiz and J. A. Dumesic, Energy Environ. Sci., 2011, 4, 83–99 CAS.
- Z. Yuan, Y. Zhang and C. Xu, RSC Adv., 2014, 4, 31829–31835 RSC.
- S. Hu, Z. Zhang, Y. Zhou, H. Fan, W. Li, J. Song and Y. Xie, Green Chem., 2008, 10, 1280–1283 RSC.
- T. Stalhberg, M. G. Sorensen and A. Riisager, Green Chem., 2010, 12, 321–325 RSC.
- H. Zhao, J. E. Holladay, H. Brown and Z. C. Zhang, Science, 2007, 316, 1597–1599 CrossRef CAS PubMed.
- M. Watanabe, Y. Aizawa, T. Iida, R. Nishimura and H. Inomata, Appl. Catal., A, 2005, 295, 150–160 CrossRef CAS.
- E. Nikolla, Y. Roman-Leshkov, M. Moliner and M. E. Davis, ACS Catal., 2011, 1, 408–410 CrossRef CAS.
- F. Yang, Q. Liu, X. Bai and Y. Du, Bioresour. Technol., 2011, 102, 3424–3429 CrossRef CAS PubMed.
- F. Yang, Q. Liu, M. X. Bai and Y. Du, Chem. Commun., 2011, 47, 4469–4471 RSC.
- V. V. Ordomsky, V. L. Sushkevich, J. C. Schouten, J. van der Schaaf and T. A. Nijhuis, J. Catal., 2013, 300, 37–46 CrossRef CAS.
- M. I. Alam, S. De, B. Singh, B. Saha and M. M. Abu-Omar, Appl. Catal., A, 2014, 486, 42–48 CrossRef CAS.
- L. Atanda, S. Mukundan, A. Shrotri, Q. Ma and J. Beltramini, ChemCatChem, 2015, 7, 781–790 CrossRef CAS.
- S. Xu, X. Yan, Q. Bu and H. Xia, RSC Adv., 2016, 6, 8048–8052 RSC.
- M. Lopes, K. Dussan, J. J. Leahy and V. T. da Silva, Catal. Today, 2017, 279, 233–243 CrossRef CAS.
- K. Peng, X. Li, X. Liu and Y. Wang, Mol. Catal., 2017, 441, 72–80 CrossRef.
- J. Guoa, S. Zhua, Y. Cena, Z. Qina, J. Wanga and W. Fana, Appl. Catal., B, 2017, 200, 611–699 CrossRef.
- L. Zhang, G. Xi, Z. Chen, Z. Qi and X. Wang, Chem. Eng. J., 2017, 307, 877–883 CrossRef CAS.
- N. Mimura, O. Sato, M. Shirai and A. Yamaguchi, ChemistrySelect, 2017, 2, 1305–1310 CrossRef CAS.
- A. Dutta, D. Gupta, A. K. Patra, B. Saha and A. Bhaumik, ChemSusChem, 2014, 7, 925–933 CrossRef CAS PubMed.
- M. Zhang, X. Tong, R. Ma and Y. Li, Catal. Today, 2016, 264, 131–135 CrossRef CAS.
- H. Zhu, D. C. Rosenfeld, D. H. Anjum, V. Caps and J.-M. Basset, ChemSusChem, 2015, 8, 1254–1263 CrossRef CAS PubMed.
- L. C. Wang, Y. M. Liu, M. Chen, Y. Cao, H. Y. He, G. S. Wu, W. L. Dai and K. N. Fan, J. Catal., 2007, 246, 193–204 CrossRef CAS.
- R. Weingarten, Y. T. Kim, G. A. Tompsett, A. Fernández, K. S. Han, E. W. Hagaman, W. C. Conner Jr, J. A. Dumesic and G. W. Huber, J. Catal., 2013, 304, 123–134 CrossRef CAS.
- L. Atanda, A. Shrotri, S. Mukundan, Q. Ma, M. Konarova and J. Beltramini, ChemSusChem, 2015, 8, 2907–2916 CrossRef CAS PubMed.
- A. E. R. S. Khder, S. A. Ahmed and H. M. Altass, React. Kinet., Mech. Catal., 2016, 117, 745–759 CrossRef CAS.
- G. Liu, Z. Wang, M. Jia, X. Zou, X. Zhu, W. Zhang and D. Jiang, J. Phys. Chem. B, 2006, 110, 16953–16960 CrossRef CAS PubMed.
- A. Dutta, A. K. Patra, S. Dutta, B. Saha and A. Bhaumik, J. Mater. Chem., 2012, 22, 14094–14100 RSC.
- C. Velasquez, F. Rojas, V. H. Lara and A. Campero, Phys. Chem. Chem. Phys., 2004, 6, 4714–4721 RSC.
- H. Qiao, F. Jia, Z. Ai, Z. Lib and L. Zhang, Chem. Commun., 2006, 2033–2035 RSC.
- A. Sinhamahapatra, N. Sutradhar, B. Roy, A. Tarafdar, H. C. Bajaj and A. B. Panda, Appl. Catal., A, 2010, 385, 22–30 CrossRef CAS.
- M. Pramanik and A. Bhaumik, J. Mater. Chem. A, 2013, 1, 11210–11220 CAS.
- S. Bruque, M. A. G. Aranda, E. R. Losilla, P. Olivera-Pastor and P. Maireles-Torres, Inorg. Chem., 1995, 34, 893–899 CrossRef CAS.
- J. Chen, M. Liu, H. Pan, S. Lin and X. Xin, J. Solid State Chem., 2001, 159, 130–133 CrossRef CAS.
- X. Wang, F. Liang, C. Huang, Y. Li and B. Chen, Catal. Sci. Technol., 2015, 5, 4410–4421 CAS.
- K. Jagadeeswaraiah, C. Ramesh Kumar, P. S. Sai Prasad and N. Lingaiah, Catal. Sci. Technol., 2014, 4, 2969–2977 CAS.
- J. Li, X. Wang, W. Zhu and F. Cao, ChemSusChem, 2009, 2, 177–183 CrossRef CAS PubMed.
- X. Wang, F. Liang, C. Huang, Y. Lia and B. Chena, Catal. Sci. Technol., 2015, 5, 4410–4421 CAS.
- J. L. Colon, D. S. Thakur, C. Y. Yang, A. Clearfield and C. R. Martini, J. Catal., 1990, 124, 148–159 CrossRef CAS.
- Y. Roman-Leshkov, J. N. Chheda and J. A. Dumesic, Science, 2006, 312, 1933–1937 CrossRef CAS PubMed.
- J. M. J. M. Ravasco, J. A. S. Coelho, S. P. Simeonov and C. A. M. Afonso, RSC Adv., 2017, 7, 7555–7559 RSC.
- B. Liu and Z. Zhang, ChemSuschem, 2016, 9, 2015–2036 CrossRef CAS PubMed.
- B. Saha and M. M. Abu-Omar, Green Chem., 2014, 16, 24–38 RSC.
- I. Jiménez-Morales, A. Teckchandani-Ortiz, J. Santamaría-González, P. Maireles-Torres and A. Jiménez-López, Appl. Catal., B, 2014, 144, 22–28 CrossRef.
- I. Jiménez-Morales, A. Teckchandani, J. Santamaría-González, P. Maireles-Torres and A. Jiménez-López, Appl. Catal., B, 2015, 164, 70–76 CrossRef.
- I. Jiménez-Morales, M. Moreno-Recio, J. Santamaría-González, P. Maireles-Torres and A. Jiménez-López, Appl. Catal., B, 2014, 154–155, 190–196 CrossRef.
- S. P. Teong, G. Yi and Y. Zhang, Green Chem., 2014, 16, 2015–2026 RSC.
- N. K. Gupta, A. Fukuoka and K. Nakajima, ACS Catal., 2017, 7, 2430–2436 CrossRef CAS.
- X. X. Li, Q. Xia, V. C. Nguyen, K. Peng, X. Liu, N. Essayemb and Y. Wang, Catal. Sci. Technol., 2016, 6, 7586–7596 CAS.
Footnote |
| † Electronic supplementary information (ESI) available. See DOI: 10.1039/c7ra10083c |
|
| This journal is © The Royal Society of Chemistry 2017 |
Click here to see how this site uses Cookies. View our privacy policy here.  Open Access Article
 *
*
![[thin space (1/6-em)]](https://www.rsc.org/images/entities/char_2009.gif) :
:![[thin space (1/6-em)]](https://www.rsc.org/images/entities/char_2009.gif) 3 v/v). NaCl was added to the reaction medium to sustain a biphasic reaction medium as well as improve the efficiency of HMF extraction by the organic layer.31 In a typical experiment, a custom-made micro scale reactor was charged with 0.06 g of catalyst, 0.15 g of glucose substrate in NaCl saturated water (3 mL) and THF (9 mL). The temperature of the reaction was maintained at 155–185 °C. Upon completion of the reaction, the reaction mixture was rapidly quenched to room temperature, the catalyst was separated by centrifugation and the supernatant liquid of both phases was collected for analysis. Both the aqueous and the organic phases were analyzed using high performance liquid chromatography (HPLC) (Waters 2690 HPLC) equipped with refractive index detector (Waters 410) and UV detectors (Waters 484) using a XBridge Amide, 3.5 μm, 4.6 × 250 mm analytical column. 80/20 acetonitrile/water with 0.2% triethylamine was used as mobile phase with a flow rate of 0.6 mL min−1. The column temperature was maintained at 35 °C. Glucose conversion, HMF selectivity and yield were calculated according to the following equations.
3 v/v). NaCl was added to the reaction medium to sustain a biphasic reaction medium as well as improve the efficiency of HMF extraction by the organic layer.31 In a typical experiment, a custom-made micro scale reactor was charged with 0.06 g of catalyst, 0.15 g of glucose substrate in NaCl saturated water (3 mL) and THF (9 mL). The temperature of the reaction was maintained at 155–185 °C. Upon completion of the reaction, the reaction mixture was rapidly quenched to room temperature, the catalyst was separated by centrifugation and the supernatant liquid of both phases was collected for analysis. Both the aqueous and the organic phases were analyzed using high performance liquid chromatography (HPLC) (Waters 2690 HPLC) equipped with refractive index detector (Waters 410) and UV detectors (Waters 484) using a XBridge Amide, 3.5 μm, 4.6 × 250 mm analytical column. 80/20 acetonitrile/water with 0.2% triethylamine was used as mobile phase with a flow rate of 0.6 mL min−1. The column temperature was maintained at 35 °C. Glucose conversion, HMF selectivity and yield were calculated according to the following equations.


![[thin space (1/6-em)]](https://www.rsc.org/images/entities/char_2009.gif) :
:![[thin space (1/6-em)]](https://www.rsc.org/images/entities/char_2009.gif) 1 w/w, NaCl 0.525 g, water 3 mL, THF 9 mL, 1 h.
1 w/w, NaCl 0.525 g, water 3 mL, THF 9 mL, 1 h.
![[thin space (1/6-em)]](https://www.rsc.org/images/entities/char_2009.gif) :
:![[thin space (1/6-em)]](https://www.rsc.org/images/entities/char_2009.gif) 1 w/w, NaCl 0.525 g, water 3 mL, THF 9 mL, 175 °C, 1 h.
1 w/w, NaCl 0.525 g, water 3 mL, THF 9 mL, 175 °C, 1 h.
![[thin space (1/6-em)]](https://www.rsc.org/images/entities/char_2009.gif) :
:![[thin space (1/6-em)]](https://www.rsc.org/images/entities/char_2009.gif) 1 w/w, NaCl 0.525 g, water 3 mL, THF 9 mL, 175 °C, 1 h.
1 w/w, NaCl 0.525 g, water 3 mL, THF 9 mL, 175 °C, 1 h.![[thin space (1/6-em)]](https://www.rsc.org/images/entities/char_2009.gif) :
:![[thin space (1/6-em)]](https://www.rsc.org/images/entities/char_2009.gif) 1 w/w, NaCl (0.525 g), H2O (3 mL), THF (9 mL) and 175 °C. The results are illustrated in Fig. 9. Clearly, the reaction time has a marked effect on both glucose conversion and HMF yield. The results demonstrated that although the glucose conversion increased with increasing reaction time, both the HMF selectivity and yield maximized at approx. 60 min. With a longer reaction time, secondary reactions were likely promoted, to form by-products such as soluble/non-soluble humins, although not detectable by HPLC, leading to substantial decreases in both HMF selectivity and yield. As shown in the figure, the HMF yield decreased from 61 to 45% as the reaction time increased from 60 to 90 min. According to these results, the best reaction time for HMF production with the as-synthesized SnP-1catalyst at 175 °C was approx. 60 min.
1 w/w, NaCl (0.525 g), H2O (3 mL), THF (9 mL) and 175 °C. The results are illustrated in Fig. 9. Clearly, the reaction time has a marked effect on both glucose conversion and HMF yield. The results demonstrated that although the glucose conversion increased with increasing reaction time, both the HMF selectivity and yield maximized at approx. 60 min. With a longer reaction time, secondary reactions were likely promoted, to form by-products such as soluble/non-soluble humins, although not detectable by HPLC, leading to substantial decreases in both HMF selectivity and yield. As shown in the figure, the HMF yield decreased from 61 to 45% as the reaction time increased from 60 to 90 min. According to these results, the best reaction time for HMF production with the as-synthesized SnP-1catalyst at 175 °C was approx. 60 min.

![[thin space (1/6-em)]](https://www.rsc.org/images/entities/char_2009.gif) :
:![[thin space (1/6-em)]](https://www.rsc.org/images/entities/char_2009.gif) 1 w/w, NaCl 0.525 g, water 3 mL, THF 9 mL, 175 °C.
1 w/w, NaCl 0.525 g, water 3 mL, THF 9 mL, 175 °C.![[thin space (1/6-em)]](https://www.rsc.org/images/entities/char_2009.gif) :
:![[thin space (1/6-em)]](https://www.rsc.org/images/entities/char_2009.gif) 1 w/w, NaCl 0.525 g, H2O 3 mL, THF 9 mL, 175 °C, and 1 h). From an economical and industrial point of view, it is of interest to employ a higher substrate concentration for higher HMF productivity and process throughput. As such, two levels of substrate concentration (wt% glucose in water) were tested, 5 wt% and 10 wt%, and the results are presented in Fig. S5.† As clearly shown in the figure, when the reaction was performed with 10 wt% glucose concentration, the HMF yield was decreased to 42% compared with >60% HMF yield with 5 wt% glucose concentration although approx. 100% glucose conversion was obtained under both substrate concentrations (Fig. 12). Such sharp decrease in the catalyst's HMF selectivity again may be due to the formation of humins via condensation polymerization of HMF with glucose and other reactive intermediates.52
1 w/w, NaCl 0.525 g, H2O 3 mL, THF 9 mL, 175 °C, and 1 h). From an economical and industrial point of view, it is of interest to employ a higher substrate concentration for higher HMF productivity and process throughput. As such, two levels of substrate concentration (wt% glucose in water) were tested, 5 wt% and 10 wt%, and the results are presented in Fig. S5.† As clearly shown in the figure, when the reaction was performed with 10 wt% glucose concentration, the HMF yield was decreased to 42% compared with >60% HMF yield with 5 wt% glucose concentration although approx. 100% glucose conversion was obtained under both substrate concentrations (Fig. 12). Such sharp decrease in the catalyst's HMF selectivity again may be due to the formation of humins via condensation polymerization of HMF with glucose and other reactive intermediates.52
![[thin space (1/6-em)]](https://www.rsc.org/images/entities/char_2009.gif) :
:![[thin space (1/6-em)]](https://www.rsc.org/images/entities/char_2009.gif) 1 w/w, NaCl 0.525 g, water 3 mL, THF 9 mL, 175 °C, 1 h.
1 w/w, NaCl 0.525 g, water 3 mL, THF 9 mL, 175 °C, 1 h.![[thin space (1/6-em)]](https://www.rsc.org/images/entities/char_2009.gif) :
:![[thin space (1/6-em)]](https://www.rsc.org/images/entities/char_2009.gif) 1 w/w, NaCl 0.525 g, water 3 mL, THF 9 mL, 175 °C and 1 h), conversion of microcrystalline cellulose with the as-synthesized SnP-1 catalyst was very poor, producing only 10% HMF yield (Fig. 11). The poor reactivity of cellulose may be due to the ineffective depolymerization (hydrolysis) of cellulose at 175 °C with the SnP-1 catalyst. Indeed, when the reaction temperature was increased to 190 °C, HMF yield increased significantly to 24%, suggesting that the SnP-1 catalyst could be promising catalyst for one-pot conversion of cellulose or other complex carbohydrates into HMF, while the reaction conditions need to be optimized.
1 w/w, NaCl 0.525 g, water 3 mL, THF 9 mL, 175 °C and 1 h), conversion of microcrystalline cellulose with the as-synthesized SnP-1 catalyst was very poor, producing only 10% HMF yield (Fig. 11). The poor reactivity of cellulose may be due to the ineffective depolymerization (hydrolysis) of cellulose at 175 °C with the SnP-1 catalyst. Indeed, when the reaction temperature was increased to 190 °C, HMF yield increased significantly to 24%, suggesting that the SnP-1 catalyst could be promising catalyst for one-pot conversion of cellulose or other complex carbohydrates into HMF, while the reaction conditions need to be optimized.
![[thin space (1/6-em)]](https://www.rsc.org/images/entities/char_2009.gif) :
:![[thin space (1/6-em)]](https://www.rsc.org/images/entities/char_2009.gif) 1 w/w, NaCl 0.525 g, H2O 3 mL, THF 9 mL, 175 °C, 1 h), the catalyst was recovered by centrifugation, washed first with methanol and then with water for three to four times and then oven dried at 100 °C for more than 12 hours. The retrieved catalyst was reused without any post treatment. Repeating the same catalyst recycling-reuse cycles for 5 times and the results are shown in Fig. 12. Both aqueous and organic phases of the reaction solution were analyzed to quantify the total amount of HMF formation in each run. During all these experiments, no fresh catalyst was supplied to compensate the loss of recovery. It can be observed from the figure that the catalytic activity of the as-synthesized SnP-1 catalyst in terms of HMF yield slightly decreases from ∼60% to ∼52% after five cycles. Although leaching of the Sn4+ ions in the catalyst is unavoidable in the process, the above results on recyclability of the catalyst demonstrate that the metal ions leached into the reaction medium was insignificant.
1 w/w, NaCl 0.525 g, H2O 3 mL, THF 9 mL, 175 °C, 1 h), the catalyst was recovered by centrifugation, washed first with methanol and then with water for three to four times and then oven dried at 100 °C for more than 12 hours. The retrieved catalyst was reused without any post treatment. Repeating the same catalyst recycling-reuse cycles for 5 times and the results are shown in Fig. 12. Both aqueous and organic phases of the reaction solution were analyzed to quantify the total amount of HMF formation in each run. During all these experiments, no fresh catalyst was supplied to compensate the loss of recovery. It can be observed from the figure that the catalytic activity of the as-synthesized SnP-1 catalyst in terms of HMF yield slightly decreases from ∼60% to ∼52% after five cycles. Although leaching of the Sn4+ ions in the catalyst is unavoidable in the process, the above results on recyclability of the catalyst demonstrate that the metal ions leached into the reaction medium was insignificant.

![[thin space (1/6-em)]](https://www.rsc.org/images/entities/char_2009.gif) :
:![[thin space (1/6-em)]](https://www.rsc.org/images/entities/char_2009.gif) 1 w/w, NaCl 0.525 g, water 3 mL, THF 9 mL, 175 °C, 1 h.
1 w/w, NaCl 0.525 g, water 3 mL, THF 9 mL, 175 °C, 1 h.![[thin space (1/6-em)]](https://www.rsc.org/images/entities/char_2009.gif) :
:![[thin space (1/6-em)]](https://www.rsc.org/images/entities/char_2009.gif) 1 w/w, NaCl 0.525 g, H2O 3 mL, THF 9 mL, 175 °C, 1 h), 98% glucose conversion, and 61% HMF yield were achieved over the as-synthesized SnP-1 catalyst (without calcination). This work demonstrated that highly effective SnP catalysts for conversion of glucose into HMF could be prepared by a simple, efficient and green method via solid-state grinding without need of energy-intensive calcination treatment. The new preparation method for SnP catalysts is easy to scale up and these catalysts could be useful for large scale continuous production of 5-HMF from glucose, which is currently under study in our laboratory.
1 w/w, NaCl 0.525 g, H2O 3 mL, THF 9 mL, 175 °C, 1 h), 98% glucose conversion, and 61% HMF yield were achieved over the as-synthesized SnP-1 catalyst (without calcination). This work demonstrated that highly effective SnP catalysts for conversion of glucose into HMF could be prepared by a simple, efficient and green method via solid-state grinding without need of energy-intensive calcination treatment. The new preparation method for SnP catalysts is easy to scale up and these catalysts could be useful for large scale continuous production of 5-HMF from glucose, which is currently under study in our laboratory.


