 Open Access Article
Creative Commons Attribution 3.0 Unported Licence
Revealing the dependence of the physiochemical and mechanical properties of cement composites on graphene oxide concentration†
Aliakbar Gholampour a,
Meisam Valizadeh Kiamahalleh
 bc,
Diana N. H. Tran
 bd,
Togay Ozbakkaloglu
 *a and
Dusan Losic
 *bd
*bd
aSchool of Civil, Environmental and Mining Engineering, The University of Adelaide, South Australia 5005, Australia. E-mail: togay.ozbakkaloglu@adelaide.edu.au
bSchool of Chemical Engineering, The University of Adelaide, South Australia, 5005 Australia. E-mail: dusan.losic@adelaide.edu.au
cDepartment of Process Engineering, International Maritime College Oman, Falaj Al Qabail, Sohar, 322 Oman
dARC Research Hub for Graphene Enabled Industry Transformation, The University of Adelaide, South Australia, 5005 Australia
First published on 5th December 2017
Abstract
This paper presents a comprehensive study to evaluate the influence of graphene oxide (GO) concentration on the physiochemical and mechanical properties of cement mortar composites. Scanning electron micrographs (SEM), energy-dispersive X-ray spectroscopy (EDX), X-ray diffraction (XRD), thermogravimetric analysis (TGA), and Fourier transform infrared spectroscopy (FTIR) characterizations were performed to understand the correlation between physicochemical and observed axial tension and compression properties of GO–cement mortar composites. The results show considerable concentration dependence, with the optimum concentration of 0.1% GO that increases the tensile and compressive strength of the composite by 37.5% and 77.7%, respectively. These results are explained by the stronger bonding of calcium silicate hydrate (C–S–H) components in the cement matrix in the presence of GO sheets and the dependence of their dispersions and possible aggregation.
1. Introduction
Cementitious materials are the most widely used construction materials throughout the world. Although this type of material has relatively good compressive strength, brittleness, very low tensile strength and strain, and low flexural strength are their weaknesses.1,2 Many researchers have tried to improve the mechanical properties of cementitious materials using different types of fibers and additives.3,4 Recently, the use of nanoparticles in cementitious materials to improve their mechanical properties by controlling nanoscale crack formation has received widespread attention.A large number of studies conducted to date have shown that the use of nanoparticles in cementitious materials results in the delay of nanoscale cracks (at the initial stage of loading) in the material before generation of microscale cracks.3,5–8 As was reported by Chang et al.7 and Madani et al.,8 a high specific surface area of nanoparticles (e.g. nanosilica and nanoclay) could result in the accelerated transformation of C–S–H surrounding the cement particles to the stable form through fast pozzolanic activity. This produces additional C–S–H gel, which improves internal paste-to-aggregate binding. The development of graphene as a new type of carbon and 2-d materials with a unique 2-d structure, e.g. high surface area, good chemical, mechanical, and thermodynamic properties, presented a new opportunity to further improve properties of cementitious materials.9–12 Graphene is usually prepared by exfoliating the graphite in water using sonication and with oxidation using strong oxidizing agents. Graphite oxide is separated into several single layers, as graphene oxide (GO), which is easily dispersible in water. Another form of graphene is reduced graphene oxide (rGO) prepared by reducing oxygen groups of pristine graphene, which is obtained directly from graphite. Graphene has an intrinsic strength and Young's modulus of up to 130 GPa and 1 TPa, respectively.13,14 The surface area of the GO layer is theoretically 2600 m2 g−1, which is higher than those of carbon nanotube and nanosilica (i.e. 1000 and 300 m2 g−1, respectively).15
In recent years, several studies have proposed the significant potential of GO for enhancing mechanical properties of cementitious materials and designing new composites for specific applications.5,6,10,16–21 These studies indicated that GO can be dispersed in the cement matrix more homogeneously than graphene and graphite. The microstructure and mechanical properties of the GO–cement mortar have been studied by Lv et al.5 and the results showed that the inclusion of GO in the cement mortar results in enhancements in its tensile, compressive, and flexural strengths through formation of the flower-like hydration crystals. Alkhateb et al.16 showed that 0.5% addition of functionalized graphene nano-platelets in the cement paste resulted in a 23% increase in the elastic modulus. Fakhim et al.17 reported that the tensile strength of the cement mortar increased by 48% after the addition of the optimum amount of 1.5% GO in the composite. Sharma and Kothiyal18 found that inclusion of GO sheets with an average size of 900 nm at a rate of 1% results in 63% increase in the compressive strength of cement mortar composites. Slightly different results are reported by Pan et al.6 showing that the addition of 0.05% GO improves the compressive strength and flexural strength of the GO–cement paste by 33% and 58%, respectively. Gong et al.19 found that the degree of hydration of the cement paste is enhanced by addition of GO amount. They also reported that 0.03% GO in the cement composite exhibits 13.5% lower porosity than the normal cement paste. The addition of GO is confirmed to lower fluidity and improved compressive and flexural strengths for the GO–cement mortar composite in comparison with the conventional cement mortar.20 Lu et al.21 investigated the effect of the GO on the mechanical behavior of strain hardening cementitious composites, showing that addition of 0.08% GO by weight results in 24.8%, 37.7%, 80.6%, and 105% increases in the compressive strength, tensile strength, flexural strength, and flexural toughness of the cement mortar composite, respectively. The electrical behavior of the GO–cement paste was also investigated by Singh et al.10 showing that the addition of GO with an appropriate amount of ferrofluid results in an increase in the electrical conductivity of the cement paste. As evident from the results of the existing studies, improved mechanical and electrical properties along with the accessible source and highly dispersible properties in water, makes GO a promising material in the preparation of high performance cement mortar composites.6
However, although significant progress has been made in previous studies, there is considerable inconsistency in these reports showing different effects of GO on the mechanical properties of composite due to the use of different GO materials and preparation conditions, neither properly characterized. These studies were mainly focused on conducting mechanical tests to show the effect of GO on the mechanical properties of composite without presenting or exploring how properties of used GO materials including the concentration, size, number of layers, defects, and density of oxygen groups could influence these properties. As cementitious materials are complex mixtures involving many components and interactions, the study of the influence of the GO parameters on the molecular bonds, crystalline phases, and hydration degree of the composites is essential to understand and explain the observed impact on mechanical properties. The study of the effect of these GO parameters on the mechanical properties of cement mortar composites is currently missing and it is highly important to understand the mechanisms and fundamental aspects behind the improvements observed in the mechanical properties. Our research team is exploring the parameters of GO including concentration, size, chemistry, and surface modifications in order to improve existing knowledge and better understanding their influence at molecular-, nano-, and micro-scale on mechanical properties of cementitious materials.
In this paper, we present the first in series of studies, with the aim of investigating the influence of GO contents on the physiochemical and mechanical properties of cement mortar composites. To find these correlations, GO–cement mortar composites were prepared using a broad range of GO dosages (i.e. 0–0.5% by weight of cement) and their physical, structural, chemical, and mechanical properties were comprehensively characterized using scanning electron micrographs (SEM), energy-dispersive X-ray spectroscopy (EDX), X-ray diffraction (XRD), thermogravimetric analysis (TGA), Fourier transform infrared spectroscopy (FTIR), and axial compression and tension tests. The results were used to find the optimal GO concentration that provides the best mechanical performance and to help us to gain better understanding of the mechanisms behind the improvements. Promising results from this study indicate that properties of cement mortar composites can be significantly enhanced by GO and potentially tailored in combination with other additives for specific applications.
2. Experimental section
2.1 Materials
![[thin space (1/6-em)]](https://www.rsc.org/images/entities/char_2009.gif) :
:![[thin space (1/6-em)]](https://www.rsc.org/images/entities/char_2009.gif) 1 mixture of concentrated sulphuric acid and phosphoric acid (120
1 mixture of concentrated sulphuric acid and phosphoric acid (120![[thin space (1/6-em)]](https://www.rsc.org/images/entities/char_2009.gif) :
:![[thin space (1/6-em)]](https://www.rsc.org/images/entities/char_2009.gif) 13 ml) was cooled overnight to 4 °C. The cooled acid mixture was slowly added to the graphite powder (1 g) and potassium permanganate (6 g) during stirring at room temperature. Then, the mixture was heated to 50 °C for about 12 hours to form a thick paste. After the completion of the reaction, the paste was cooled down to room temperature and quickly poured onto the ice cubes (150 ml) with 30% hydrogen peroxide (1 ml) for an hour. The mixture was then washed and filtered with distilled water and hydrochloric acid (32%), followed by repeated washing with ethanol and eventually with Milli-Q water. For each wash, the obtained brown dispersion was centrifuged at 4400 rpm for two hours to remove residual salts and any un-exfoliated graphite oxide. The obtained GO was vacuum dried overnight at room temperature. Fig. S1 (see ESI†) shows the graphite powder and final GO solution.
13 ml) was cooled overnight to 4 °C. The cooled acid mixture was slowly added to the graphite powder (1 g) and potassium permanganate (6 g) during stirring at room temperature. Then, the mixture was heated to 50 °C for about 12 hours to form a thick paste. After the completion of the reaction, the paste was cooled down to room temperature and quickly poured onto the ice cubes (150 ml) with 30% hydrogen peroxide (1 ml) for an hour. The mixture was then washed and filtered with distilled water and hydrochloric acid (32%), followed by repeated washing with ethanol and eventually with Milli-Q water. For each wash, the obtained brown dispersion was centrifuged at 4400 rpm for two hours to remove residual salts and any un-exfoliated graphite oxide. The obtained GO was vacuum dried overnight at room temperature. Fig. S1 (see ESI†) shows the graphite powder and final GO solution.Graphite flakes were obtained from Valence Industries Ltd. Australia. Other chemicals, including 98% sulfuric acid (H2SO4, Sigma-Aldrich), 85% phosphoric acid (H3PO4, Chem-Supply), potassium permanganate (KMnO4, Sigma-Aldrich), 30% hydrogen peroxide (H2O2, Chem-Supply), 35% hydrochloric acid (HCl, Merck), and ethanol (Chem-Supply) were used. Milli-Q water (Purelab option-Q, 18.2 MΩ cm at 25 °C and a pH of 5.6) was used in all aqueous solutions.
In order to improve the dispersion of GO in the mortar mixture, the following procedure was adopted: firstly, cement and sand were mixed together at a low speed of 40 rpm for 2 min. Then, superplasticizer was added to the GO solution and the mixture was sonicated for 10 min. Finally, GO solution was gradually added to the mix and the materials were mixed for 5 min before the mixtures were poured into the moulds. Once the specimens were demolded, they were cured in the fog room at a constant temperature of 23 ± 2 °C until the test days. Fig. S2 (see ESI†) shows the samples used in the direct tension and compression tests.
2.2 Characterizations
In the TGA, two parameters of evaporable (free) and non-evaporable (bound) water contents are determined. The content of the evaporable water, which is the water on the outer surface of the composite particles, is recorded as a percentage of the weight loss for temperatures that ranged from room temperature to 145 °C. The content of non-evaporable water is determined as the percentage of the weight loss from 145 °C to 1000 °C, minus the weight loss from 600 °C and 800 °C, as a result of the CO2 release by the calcite decomposition.19,26–29 The non-evaporable water content of GO–cement composite is used to calculate the hydration degree of the sample (i.e. αTGA(t)) using the following equation:26
| αTGA(t)(%) = (Wn(t))/(Mc × Wn(∞)) × 100 | (1) |
3. Results and discussion
3.1 Physical and chemical characterization of GO–cement mortar composites
Fig. 1 shows the characterization results of GO sheets used for making cement mortar composites. Fig. 1(a) shows a typical TEM image of GO sheets showing their irregular shape and amorphous nature with a paper-like appearance with an approximate thickness of 1 nm, attributing to be a single layer sheet (see Fig. S1 in ESI†). The crystal structure of GO was evaluated by XRD showing the characteristic 002 reflection peak at 2θ (scattering angle) = 11.1° (d-spacing = 0.79 nm, Fig. 1(b)) and TGA (Fig. 1(c)) confirmed the typical decomposition pattern of GO related to its oxygen functional groups.31–34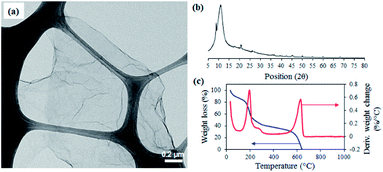 | ||
| Fig. 1 (a) TEM image, (b) XRD, and (c) TGA plots of GO material exfoliated from graphite and used for composite preparation. | ||
In order to explain the influence of the GO content on the mechanical behavior of the cement mortar composite, SEM, EDX, XRD, TGA, and FTIR tests were performed on the composites with GO dosages of 0% (as the control sample), 0.03% (as representative effective low dosage), 0.1% (as the optimum dosage obtained from mechanical results), and 0.5% (as the maximum dosage).
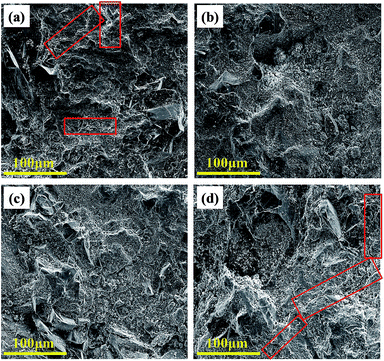
Fig. 2 shows the cracking patterns of the prepared cement mortar composites with GO contents of 0%, 0.03%, 0.1%, and 0.5% using low magnification SEM images. As shown in Fig. 2, the density of micro-cracks attributed to the poor bonding between the microparticles (sand and cementitious particles) in both cement mortar composites with 0% and 0.5% of GO incorporation is higher than those with 0.03% and 0.1% GO incorporation. This behavior is attributed to the high dispersibility of GO sheets in the composite at up to an optimum GO concentration, which make them efficient in reinforcing the bridge of the micro-cracks and control the crack propagation from nanoscale to microscale.3,35 Fig. S4 (see ESI†) shows the enlarged cracks in cement mortar composites containing 0% and 0.5% GO.
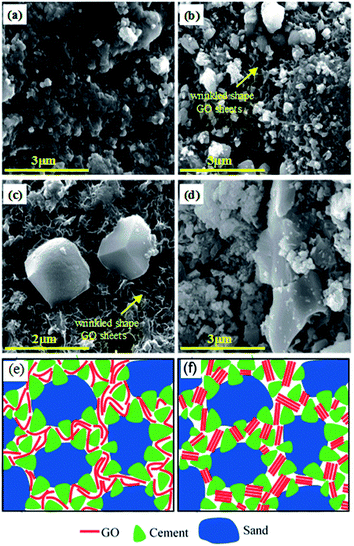
Fig. 3 shows high magnification SEM images at the surface of the samples with GO contents of 0%, 0.03%, 0.1%, and 0.5%. Fig. S5 (see ESI†) shows the enlarged SEM images of GO dispersion in cement mortar composites. As can be seen in Fig. 3(a), after hydration the plain mortar consists of pores, which were partially filled with the cement paste, and some gaps, which yet remained between the particles. By increasing the GO content to 0.03% and 0.1% (Fig. 3(b) and (c), respectively), the GO sheets were uniformly dispersed between the mortar materials without any aggregation in the cementitious mortar matrix. In these GO contents, the GO sheets were found to be embedded as an individual sheet in the paste that were strongly anchored on the particles and acted as bridges between hydrates and across the composite particles. It can be seen from Fig. 3(d) that, with an increase in the GO content up to 0.5%, GO sheets are re-stacked and re-agglomerated to platelets, which resulted in the poor bond, interparticle interaction, and bridging in the mortar microstructure. This behavior is attributed to the trapping of most of the GO in-plane oxygen groups between the GO layers that prevents them from being able to contribute to the hydration and interaction with the C–S–H bonds.16,36 The scheme to visualize the two stages with uniformly dispersed and aggregated GO sheets as a result of different GO concentration is presented in Fig. 3(e) (left and right, respectively). This is the first observation and report of the threshold GO concentration in cement composites. Considering that observed aggregation of GO sheets in cement mortar composites is not only dependent on GO concentration but also potentially on other parameters including the size of GO, their charge, condition of their mixing with mortar, and composition of mortar composites, this could explain the large discrepancy in results on the mechanical properties of these composites in previous reports.
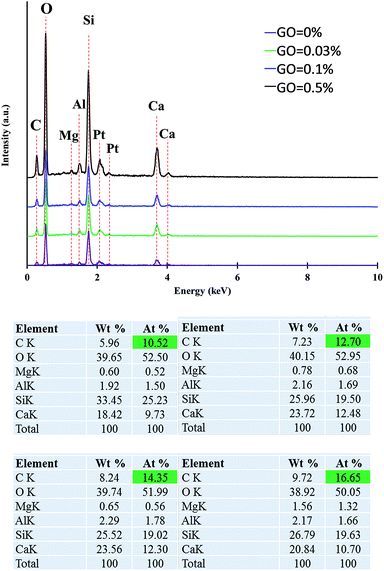
Fig. 4 shows the EDX analysis results of prepared cement samples showing the changes of elemental composition using different dosages of GO. As can be seen in the figure, although plain cement mortar does not have any GO, there is a noteworthy amount of carbon in its composite. This is due to the presence of carbon in superplasticiser added as an additive to improve mixing. As can be seen in Fig. 4, the carbon content of the cement mortar composite increased with an increase in the GO concentration.
The influence of the GO concentration on the hydration degree of the GO–cement composites is shown in Fig. 5. The hydration degree values were calculated using eqn (1). Each term of the equation was derived from the TGA plots provided in Fig. S6 (see ESI†). Fig. 5 shows that the hydration degree of the samples increases with an increase in the curing time from 7 to 28 days regardless of the GO content in the cement paste composite. This observation is in agreement with the previous study by Gong et al.19 In addition, it is observed that the certain level of GO concentration in the composite plays a significant role in the hydration degree. The results show that the hydration degree increased by 8.2% and 11.9% at 28 days compared to the plain composite by increasing the GO dosages to 0.03% and 0.1%, respectively. Maximum wettability was achieved by 0.1% GO content, which is proportional to the hydration degree of the composite. This can be attributed to the direct interaction of the GO individual sheets with the cement constituents. By increasing the GO dosage up to 0.5%, the wettability and hydration properties of the cement composite decreased due to the agglomeration of the GO sheets. The stacked GO sheets restricted the penetration of the water molecules into the GO interlayers.
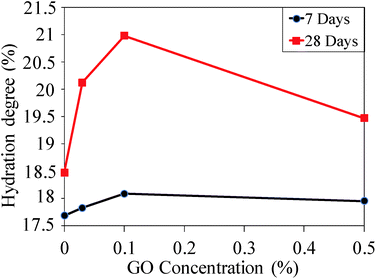 | ||
| Fig. 5 Hydration degree of the GO–cement composites prepared with different GO concentrations cured for 7 and 28 days. | ||
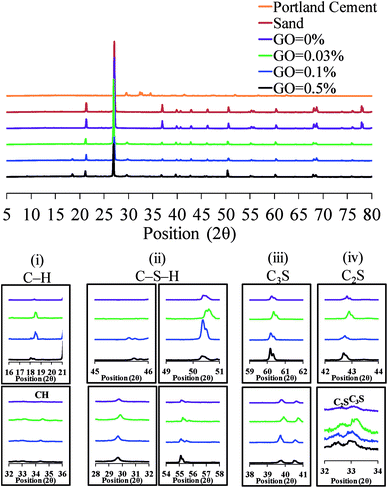
Comparative XRD spectra of Portland cement, sand, and GO–cement mortar mixes are shown in Fig. 6. As can be seen in the figure, the most dominant peaks detected in the XRD patterns are at the scattering angles (2θ) of 22° and 28° which are indicative from the quartz as this is the only crystalline phase of the sand.37,38 It can be seen from the insets (iii) and (iv) in Fig. 6 that after the formation of the tricalcium silicate C3S (Ca3SiO5) and dicalcium silicate C2S (Ca2SiO4), the hydration process continued to create the cement paste containing portlandite Ca(OH)2 and calcium silicate hydrate (C–S–H).39 This hydration process contributes to the enhancement of the strength and volume stability of the cementitious materials.40 The XRD peaks shown in inset (i) at the scattering angles of about 18° and 34° correspond to the formation of Ca(OH)2.39,41,42 As can be seen in inset (i), the Ca(OH)2 peaks were intensified by an increase in the GO concentration up to 0.1%. A similar trend was also observed for the C–S–H as shown in inset (ii), where the cumulative intensity at 2θ of 29.6°, 45.7°, 50.3°, and 55.2° was the maximum for the cement mortar composite with 0.1% GO concentration. This further confirms that increasing the GO content in the cementitious composites enhances the wettability and hydration of the composite, which results in a higher strength. The increased wettability of the composite with GO dosage of up to 0.1% can be attributed to the increase in the density of the oxygen functional groups (hydrophilic) located on the GO surface. With an increase in GO concentration in the composite beyond a certain level (i.e. 0.1%), the highly strong interlayer hydrogen bonds help the GO sheets to stack and agglomerate. Therefore, the GO interlayer distance drops to 6 Å and the water molecules are hardly able to diffuse into the GO layers.43
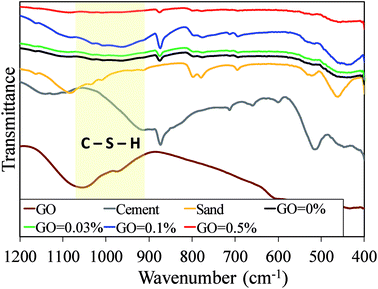
In order to investigate the influence of the GO incorporation into the hydration of the cement mortar mix, the FTIR analysis was conducted on the specimens and composite ingredients (i.e. GO, cement, and sand). Fig. S7† shows the FTIR analysis results in transmittance mode. Major peaks for the GO are: the O–H stretching vibrations from 3000 cm−1 to 3500 cm−1 as a broad peak and at 1413 cm−1 as a narrow peak; the stretching vibrations of C![[double bond, length as m-dash]](https://www.rsc.org/images/entities/char_e001.gif) O in carbonyl and carboxyl group at 1720 cm−1; the in-plane C
O in carbonyl and carboxyl group at 1720 cm−1; the in-plane C![[double bond, length as m-dash]](https://www.rsc.org/images/entities/char_e001.gif) C (sp2 carbon) skeletal stretching vibrations at 1616 cm−1; and the stretching peaks at 1225 cm−1 and 1050 cm−1 for the C–O (epoxy and alkoxy groups). These peaks are in agreement with those reported in the previous studies.31,32 The FTIR spectra of the sand with its major stretching vibrations peaks of νas(Si–O–Si), νs(Si–O–Si), and (Si–OH) are also consistent with those reported in literature.44,45 For the Portland cement, the major stretching vibration bands are observed at about 875 cm−1 and 1410 cm−1, which is attributed to the presence of CO3 from CaCO3.46 The peaks at the stretching bands of 450 cm−1 and 1080 cm−1 correspond to ν4(O–Si–O) and ν3(Si–O) stretching vibration, respectively, in SiO4 tetrahedron.6 The minor vibration band at about 3640 cm−1 corresponds to the O–H stretching band from Ca(OH)2. This peak exists in all cement mortar composites spectra. These observations are also in agreement with the XRD analysis results in Fig. 6, which shows the formation of Ca(OH)2 with the scattering angle of 18°.
C (sp2 carbon) skeletal stretching vibrations at 1616 cm−1; and the stretching peaks at 1225 cm−1 and 1050 cm−1 for the C–O (epoxy and alkoxy groups). These peaks are in agreement with those reported in the previous studies.31,32 The FTIR spectra of the sand with its major stretching vibrations peaks of νas(Si–O–Si), νs(Si–O–Si), and (Si–OH) are also consistent with those reported in literature.44,45 For the Portland cement, the major stretching vibration bands are observed at about 875 cm−1 and 1410 cm−1, which is attributed to the presence of CO3 from CaCO3.46 The peaks at the stretching bands of 450 cm−1 and 1080 cm−1 correspond to ν4(O–Si–O) and ν3(Si–O) stretching vibration, respectively, in SiO4 tetrahedron.6 The minor vibration band at about 3640 cm−1 corresponds to the O–H stretching band from Ca(OH)2. This peak exists in all cement mortar composites spectra. These observations are also in agreement with the XRD analysis results in Fig. 6, which shows the formation of Ca(OH)2 with the scattering angle of 18°.
As can be seen in Fig. 7, the most significant difference between the cement mortar composites, GO, cement, and sand particles is the creation of a new broad band at about 980 cm−1. This change can be attributed to the formation of the C–S–H phases in the Portland cement as well as the anhydrous phase and/or (Si–O) absorption bands of C2SH2.47 With regard to the GO–cement mortar composites, the intensity of the O–H stretching vibrations was increased compared to that of the plain cement mortar and the C![[double bond, length as m-dash]](https://www.rsc.org/images/entities/char_e001.gif) O stretching band shifted toward the right side (i.e. lower wavenumber). In other words, the addition of the GO into the plain cement mortar lets the –OH and –COOH groups interact preferentially with C3S, C2S, and tricalcium aluminate C3A (Ca3Al2O6), which results in the growth of the hydration products of C–S–H.5
O stretching band shifted toward the right side (i.e. lower wavenumber). In other words, the addition of the GO into the plain cement mortar lets the –OH and –COOH groups interact preferentially with C3S, C2S, and tricalcium aluminate C3A (Ca3Al2O6), which results in the growth of the hydration products of C–S–H.5
As can be seen from Fig. S7,† the O–H stretching broad band at 3400 cm−1 and C![[double bond, length as m-dash]](https://www.rsc.org/images/entities/char_e001.gif) O band at 1640 cm−1 intensified with an increase in GO content up to 0.1%. This is not only due to the increase in the number of the oxygen groups interacting through the hydrogen bonds to the calcium silicate hydrate,21 but also because of the increase in the intercalated water in the well-dispersed GO in the cement mortar matrix.48 It is also notable that the oxygen functional groups of the graphitic carbon allow the cement C–S–H components to be deposited on the graphitic surface and form a strong interaction between them. This can result in the improvement of the mechanical strength by enhancing the load transfer efficiency as well as the bond strength between the two surfaces (i.e. C–S–H and graphitic surfaces). The highest intensity of the O–H and C
O band at 1640 cm−1 intensified with an increase in GO content up to 0.1%. This is not only due to the increase in the number of the oxygen groups interacting through the hydrogen bonds to the calcium silicate hydrate,21 but also because of the increase in the intercalated water in the well-dispersed GO in the cement mortar matrix.48 It is also notable that the oxygen functional groups of the graphitic carbon allow the cement C–S–H components to be deposited on the graphitic surface and form a strong interaction between them. This can result in the improvement of the mechanical strength by enhancing the load transfer efficiency as well as the bond strength between the two surfaces (i.e. C–S–H and graphitic surfaces). The highest intensity of the O–H and C![[double bond, length as m-dash]](https://www.rsc.org/images/entities/char_e001.gif) O stretching peaks was found in the cement mortar mix with GO dosage of 0.1%. This also confirms the highest accessibility of the water to both the GO oxygen functional groups and the cement C–S–H phase, which resulted in the highest hydration degree for the mortar matrix and thus notable enhancements in the mechanical properties of GO–cement mortar composites.
O stretching peaks was found in the cement mortar mix with GO dosage of 0.1%. This also confirms the highest accessibility of the water to both the GO oxygen functional groups and the cement C–S–H phase, which resulted in the highest hydration degree for the mortar matrix and thus notable enhancements in the mechanical properties of GO–cement mortar composites.
In the case of the cement mortar composite with GO dosage of 0.5%, it can be seen from the Fig. S7† that the O–H and C![[double bond, length as m-dash]](https://www.rsc.org/images/entities/char_e001.gif) O stretching bands disappear. This behavior is attributed to the diminution of GO and C–S–H intermolecular interaction. This result confirms the SEM observation that the in-plane oxygen functional groups of the highly concentrated GO sheets have the least exposure to the water molecules and almost no contact with the C–S–H phase. This further indicates the poor interaction between the GO oxygen functional groups and the C–S–H phase of the cement in the mortar matrix.
O stretching bands disappear. This behavior is attributed to the diminution of GO and C–S–H intermolecular interaction. This result confirms the SEM observation that the in-plane oxygen functional groups of the highly concentrated GO sheets have the least exposure to the water molecules and almost no contact with the C–S–H phase. This further indicates the poor interaction between the GO oxygen functional groups and the C–S–H phase of the cement in the mortar matrix.
3.2 Mechanical behavior of GO–cement mortar composites
The results of the tension and compression tests are summarized in Fig. 8 and 9, respectively, to investigate the influence of the GO concentration on the mechanical behavior of the cement mortar composite. It can be seen from Fig. 8 that the inclusion of GO in the cement mortar results in an increase in the 7 and 28 days tensile strength of the composite. The tensile strength of the specimens also steadily increases with the addition of GO up to 0.1%, then beyond this level the strength starts to decrease. The strength enhancement of the mix containing 0.1% GO reached 44.4% at 7 days and 37.5% at 28 days. This observation is consistent with previous studies by Lv et al.5 and Fakhim et al.17 on the GO–cement mortar composite.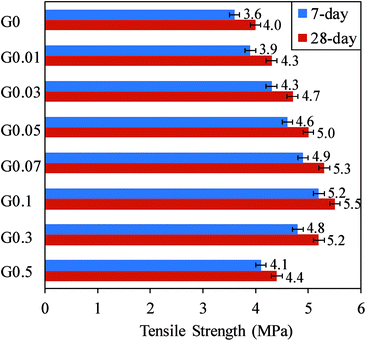 | ||
| Fig. 8 Variation of 7 and 28 days tensile strength of GO–cement mortar with different GO contents (0–0.5%). Number after letter G shows GO content of the mix in percentage. | ||
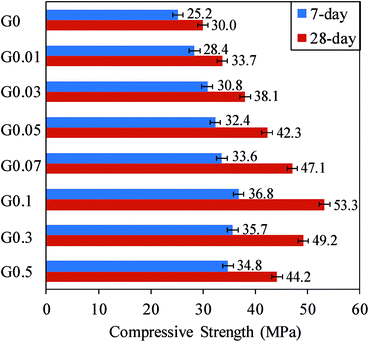 | ||
| Fig. 9 Variation of 7 and 28 days compressive strength of GO–cement mortar with different GO contents (0–0.5%). | ||
The improvement in the tensile strength at the optimum concentration of GO in the cement mortar composites can be attributed to the improved bonding between the cement matrix and GO particles owing to the high dispersibility of GO sheets (as appearing like individual sheets) in the composite at the optimum GO concentration (see Fig. 3). High GO dispersion in the composite results in the interaction of cement hydration products (i.e. C–S–H) with higher surface area GO sheets, leading to the enhanced interfacial load transfer between the GO sheets and cement matrix during the fiber pull out from the matrix.5,6,21 However, further increase in the amount of GO results in the GO re-stacking due to van der Waals force, which results in poor dispersion of the GO in the matrix and reduction in the bonding and internal friction within the composite as indicated in scheme in Fig. 3(e). This in turn reduces the strength of the composite.6,21
Fig. 9 shows the 7 and 28 days compression test results of different mixes. It can be seen from the figure that the compressive strength of the specimens steadily increased with the GO addition up to a concentration of 0.1%, and the strength decreased with a further increase in the GO content. This trend is consistent with those reported by Cao et al.20 and Du and Pang48 on the GO–cement mortar composite. The compressive strength enhancement of the mix containing 0.1% GO reached 46% at 7 days and 77.7% at 28 days. It is worth noting that the maximum enhancement seen at the 28 days compressive strength is larger than those in previous studies by Lv et al.5 (47.9%), Pan et al.6 (24%), Cao et al.20 (20.3%), and Lu et al.21 (24.1%) on the GO–cement mortar composite. Comparison of Fig. 8 and 9 reveals that, for a given mix, compressive strength enhancements seen in GO mixes from 7 to 28 days are higher than those of tensile strength, indicating that the effect of GO on the tensile strength is mostly up to 7 days, whereas the compressive strength enhancement is more progressive and continues beyond the 7 days to 28 days curing age.
The enhancement of the compressive strength is attributed to the good dispersibility of GO sheets in the composite that leads to the better interlocking behavior between the GO and cement mortar and increased crack tip toughness, resulting in the prevention of the crack propagation from nanoscale to microscale.6,18,21 However, an increase in the GO content over the optimum amount results in the aggregation of the GO in the matrix that provides poor dispersion and change in the thickness of the GO to multi layers.18,21 Multi-layer GO obtains poor interlocking cohesion between GO and the cement mortar, consequently reducing the strength of the composite.21
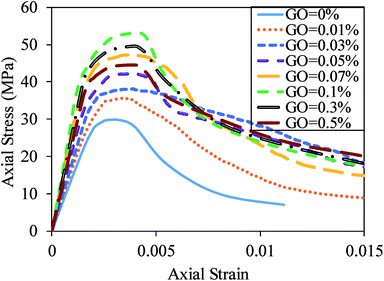
Fig. 10 shows the relationship between the axial compressive stress and strain for cement mortar composites with different GO concentrations at 28 days. The curves indicate that an increase in the GO content up to 0.1% results in an increase in the compressive strength of the composite. It is also notable from the figure that the elastic modulus and axial strain corresponding to the compressive strength of the cement mortars increased with an increase in the GO content up to 0.1%. The elastic modulus and axial strain corresponding to compressive strength enhancements of the mix containing 0.1% GO reached 109.6% and 41.9%, respectively. These increases are attributed to the well-known relationship between the compressive strength, elastic modulus, and axial strain corresponding to the compressive strength.
4. Conclusions
In this work, the influence of GO concentration on physicochemical and mechanical properties of GO–cement mortar composites and how and why different GO concentrations affect these properties have been investigated. The results showed that the optimal percentage (i.e. 0.1%) of GO in the composite leads to a 37.5% and 77.7% increase in the 28 days tensile and compressive strengths of GO–cement mortar composites compared to the plain cement mortar composite. Study revealed that GO not only prevents the crack propagation from the nanoscale to microscale and increases the hydration degree of the cement mortar composites, but also improves accessibility of the water to the GO oxygen functional groups and cement C–S–H component, indicating the importance of having appropriate GO concentrations. We also discovered that there is a critical GO concentration (i.e. 0.1%) and increasing the amount of GO above this concentration leads to detrimental effects as observed by many micro-cracks related to restacking and aggregation of GO sheets in cement matrix. These observations with obtained mechanical properties that were validated by SEM, TGA, XRD, and FTIR analyses provide an essential link between structural, chemical, and mechanical properties and help to better understand the influence of GO parameters. The positive influence of GO, as a promising additive for use as a nano reinforcement, and different oxygen functional groups on the phase composition and intermolecular interaction of cementitious materials to help early-age hydration characteristics of the composite is clearly demonstrated in this work. Further investigations on the effect of other GO parameters including particle size and surface chemistry on the properties of cement mortar composites are currently underway and will be presented as a separate study. Considering scalable production and low cost availability of GO, there is strong expectation for this material to be commercially applied for the development of a new generation of cementitious and construction materials with advanced performance for broad applications.Conflicts of interest
There are no conflicts to declare.Acknowledgements
The authors gratefully acknowledge the support of the Australian Research Council through ARC IH 150100003 (ARC Research Hub for Graphene Enabled Industry Transformation). The authors also thank Schools of Chemical Engineering and Civil, Environmental and Mining Engineering at the University of Adelaide for supporting this work.Notes and references
- C. Soranakom and B. Mobasher, Cem. Concr. Compos., 2008, 30(6), 465–477 CrossRef CAS.
- S. H. Park, D. J. Kim, G. S. Ryu and K. T. Koh, Cem. Concr. Compos., 2012, 34(2), 172–184 CrossRef CAS.
- S. Chuah, Z. Pan, J. G. Sanjayan, C. M. Wang and W. H. Duan, Constr. Build. Mater., 2014, 73, 113–124 CrossRef.
- Z. Wu, C. Shi and K. H. Khayat, Cem. Concr. Compos., 2016, 71, 97–109 CrossRef CAS.
- S. Lv, Y. Ma, C. Qiu, T. Sun, J. Liu and Q. Zhou, Constr. Build. Mater., 2013, 49, 121–127 CrossRef.
- Z. Pan, L. He, L. Qiu, A. Habibnejad Korayem, G. Li, J. W. Zhu, F. Collins, D. Li, W. H. Duan and M. C. Wang, Cem. Concr. Compos., 2015, 58, 140–147 CrossRef CAS.
- T. P. Chang, J. Y. Shih, K. Yang and T. C. Hsiao, J. Mater. Sci., 2007, 42(17), 7478–7487 CrossRef CAS.
- H. Madani, A. Bagheri and T. Parhizkar, Cem. Concr. Res., 2012, 42(12), 1563–1570 CrossRef CAS.
- A. K. Geim and K. S. Novoselov, The rise of graphene, Nat. Mater., 2007, 6(3), 183–191 CrossRef CAS PubMed.
- A. P. Singh, M. Mishra, A. Chandra and S. K. Dhawan, Nanotechnology, 2011, 22(46), 465701 CrossRef PubMed.
- N. Ranjbar, M. Mehrali, M. Mehrali, U. J. Alengaram and M. Z. Jumaat, Cem. Concr. Res., 2015, 76, 222–231 CrossRef CAS.
- S. H. Lv, L. J. Deng, W. Q. Yang, Q. F. Zhou and Y. Y. Cui, Cem. Concr. Compos., 2016, 66, 1–9 CrossRef CAS.
- C. Lee, X. Wei, J. W. Kysar and J. Hone, Science, 2008, 321(5887), 385–388 CrossRef CAS PubMed.
- H. Y. Chu, J. Y. Jiang, W. Sun and M. Zhang, Cem. Concr. Compos., 2017, 82, 252–264 CrossRef CAS.
- T. N. Lambert, C. A. Chavez, B. Hernandez-Sanchez, P. Lu, N. S. Bell, A. Ambrosini, T. Friedman, T. J. Boyle, D. R. Wheeler and D. L. Huber, J. Phys. Chem. C, 2009, 113(46), 19812–19823 CAS.
- H. Alkhateb, A. Al-Ostsaz, A. Cheng and X. Li, J. Nanomech. Micromech., 2013, 3(3), 67–77 CrossRef.
- B. Fakhim, A. Hassani, A. Rashidi and P. Ghodousi, Sci. World J., 2014, 1–10 Search PubMed.
- S. Sharma and N. C. Kothiyal, RSC Adv., 2015, 5, 52642–52657 RSC.
- K. Gong, Z. Pan, A. H. Korayem, L. Qiu, D. Li, F. Collins, C. M. Wang and W. H. Duan, J. Mater. Civ. Eng., 2014, 27, A4014010 CrossRef.
- M. L. Cao, H. X. Zhang and C. Zhang, J. Cent. South Univ., 2016, 23, 919–925 CrossRef CAS.
- C. Lu, Z. Lu, Z. Li and C. K. Y. Leung, Constr. Build. Mater., 2016, 120, 457–464 CrossRef CAS.
- D. C. Marcano, D. V. Kosynkin, J. M. Berlin, A. Sinitskii, Z. Sun, A. Slesarev, L. B. Alemany, W. Lu and J. M. Tour, ACS Nano, 2010, 4, 4806–4814 CrossRef CAS PubMed.
- ASTM C1437, Standard test method for flow of hydraulic cement mortar, ASTM International, PA, USA, 2015 Search PubMed.
- ASTM C307-03, Standard test method for tensile strength of chemical-resistant mortar, grouts, and monolithic surfacings, ASTM International, 2012 Search PubMed.
- ASTM C109/C109M-16a, Standard test method for compressive strength of hydraulic cement mortars, ASTM International, USA, 2008 Search PubMed.
- P. Mounanga, A. Khelidj, A. Loukili and V. Baroghel-Bouny, Cem. Concr. Res., 2004, 34, 255–265 CrossRef CAS.
- B. Lothenbach, G. L. Saout, E. Gallucci and K. Scrivener, Cem. Concr. Res., 2008, 38, 848–860 CrossRef CAS.
- B. Z. Dilnesa, E. Wieland, B. Lothenbach, R. Dahn and K. L. Scrivener, Cem. Concr. Res., 2014, 58, 45–55 CrossRef CAS.
- K. Scrivener, R. Snellings and B. Lothenbach, A Practical Guide to Microstructural Analysis of Cementitious Materials, CRC Press, 2016, ISBN: 9781138747234 Search PubMed.
- W. Czernin, Cementkemi för Byggare, Svesnka Cement Föreningen, 1959 Search PubMed.
- D. N. H. Tran, S. Kabiri and D. Losic, Carbon, 2014, 76, 193–202 CrossRef CAS.
- M. J. Nine, M. A. Cole, L. Johnson, D. N. H. Tran and D. Losic, ACS Appl. Mater. Interfaces, 2015, 7, 28482–28493 CAS.
- S. Kabiri, D. N. H. Tran, S. Azari and D. Losic, ACS Appl. Mater. Interfaces, 2015, 7, 11815–11823 CAS.
- S. Kabiri, D. N. H. Tran, M. A. Cole and D. Losic, Environ. Sci.: Water Res. Technol., 2016, 2, 390–402 CAS.
- A. Sedaghat, M. K. Ram, A. Zayed, R. Kamal and N. Shanahan, Open J. Compos. Mater., 2014, 4(1), 12–21 CrossRef.
- L. Nicoleau, T. Gadt, L. Chitu, G. Maier and O. Paris, Soft Matter, 2013, 9, 4864–4874 RSC.
- F. Raupp-Pereira, D. Hotza, A. M. Segadaes and J. A. Labrincha, Ceram. Int., 2006, 32, 173–179 CrossRef CAS.
- N. U. Amin, S. Alam and S. Gul, RSC Adv., 2015, 5, 6079–6084 RSC.
- R. Wang, L. Yao and P. Wang, Constr. Build. Mater., 2013, 41, 538–544 CrossRef.
- R. Alizadeh, L. Raki, J. M. Makar, J. J. Beaudoin and I. Moudrakovski, J. Mater. Chem., 2009, 19, 7937–7946 RSC.
- N. Yang and W. Yue, Handbook of a collection of illustrative plates of inorganic nonmetal materials, Wuhan University of Technology Publishing Company, Wuhan, 2000 Search PubMed.
- E. Tkaczewska, Open J. Civ. Eng., 2013, 3(2a), 54–68 CrossRef.
- A. Buchsteiner, A. Lerf and J. Pieper, J. Phys. Chem. B, 2006, 110, 22328–22338 CrossRef CAS PubMed.
- A. Mourhly, M. Khachani, A. El Hamidi, M. Kacimi, M. Halim and S. Arsalane, Nanomater. Nanotechnol., 2015, 5(35), 1–7 Search PubMed.
- A. Bera, T. Kumar, K. Ojha and A. Mandal, Appl. Surf. Sci., 2013, 284, 87–99 CrossRef CAS.
- G. Y. Li, P. M. Wang and X. Zhao, Carbon, 2005, 43, 1239–1245 CrossRef CAS.
- S. Cerveny, F. Barroso-Bujans, Á. Alegria and J. Colmenero, J. Phys. Chem. C, 2010, 114, 2604–2612 CAS.
- H. Du and S. D. Pang, Cem. Concr. Res., 2015, 76, 10–19 CrossRef CAS.
Footnote |
| † Electronic supplementary information (ESI) available: Experimental details, mechanical testing, SEM data, XRD, and TGA results. See DOI: 10.1039/c7ra10066c |
| This journal is © The Royal Society of Chemistry 2017 |

