 Open Access Article
Creative Commons Attribution 3.0 Unported Licence
A novel gas conductor–gas barrier (GC–GB) blending membrane with adjustable gas separation capacity
Qi He a,
Xiaoyue Xiaob,
Wenxia Wang
 a,
Yanbo Huanga,
Jiapeng Hea and
Kaijun Xiao*a
aSchool of Food Science and Technology, South China University of Technology, Guangzhou, China. E-mail: fekjxiao@scut.edu.cn; Tel: +86 20 87113843
bDepartment of Water Resource and Environmental Engineering, Tamkang University, Taipei, China
First published on 23rd November 2017
Abstract
A promising avenue to preserve harvested fruits and vegetables can be achieved by designing a “breathable” membrane named as equilibrium modified atmosphere packaging (EMAP). In this work, such “breathable” packaging was prepared using a gas conductor –gas barrier (GC–GB) blending membrane (BM). The miscibility between the GC and GB in the BM was displayed using structural scanning and thermal analysis, and the physicochemical properties of the BM were characterized by a series of assays. By changing the SPEEK content in the BM, CO2 permeabilities of the BM in pure gas can be adjusted from 105 to 1494 kPa, while the O2 permeabilities can be adjusted from 19 to 297 kPa. Thus, the CO2/N2 and O2/N2 ideal selectivity of the BMs were 20.48–33.95 and 5.38–6.75, respectively. On this basis, the membrane was used to preserve oranges and cauliflower. The equilibrium internal atmospheres included 4.6–7.9% of CO2 + 7.8–4.4% of O2 (p/p) and 3.6–8.7% of CO2 + 9.2–4.2% of O2 (p/p), which were respectively recommended to preserve the stored products. The results indicated such adjustable membranes will have promising applications to preserve different kinds of fresh products.
1. Introduction
Recently, increasing attention has been paid to developing an effective approach to preserve harvested vegetables or fruits.1 Since preserved produce is alive, it still needs to consume nutrients and exchange gases through respiration behavior after it is harvested.2 Thus, more CO2 and less O2 in the storage atmosphere are usually advantageous because these conditions can significantly reduce respiratory intensity and nutrient consumption of the products. However, minimal O2 should be kept in case the living products “suffocate” to death.2A promising strategy can be achieved by designing a “breathable” membrane named as equilibrium modified atmosphere packaging (EMAP).3 Its internal atmosphere can be kept in a relatively stable state by balancing the gradient-induced gas transport through the membrane (O2 entering the packaging and CO2 leaving) against the gas exchange caused by respiration of the products (O2 uptake and CO2 production).4 On this basis, the major goal to design an EMAP is to achieve ideal selectivity and permeability. It can be achieved by selecting suitable membrane materials according to the chemical structure, crystallinity and morphology of materials.5
Extensive research has focused on tailoring polymeric membranes to achieve superior separation properties, especially some approaches to improve polymers that can hardly fulfill the required properties. For example, Tin et al.6 performed a room-temperature chemical cross-linking modification on Matrimid as gas separate membrane. Results showed that the permeability of CO2 through the membrane in mixed gas (40% CO2 in CH4, 35 °C and 1.01 × 10⁶ Pa) reduced from 6.72 bar to 3.26 bar after 7 days of treatment. Ammar et al.7 loaded 0–3 wt% of C30B into polysulfone/polyimide mixed film. The O2 permeation of the prepared films at 1 atm and 23 °C roughly reduced by half. Khan et al.8 aimed to gas separation using polysulfone acrylate–zeolite mixed matrix membranes. The mixed gas selectivity for H2/CO2 separation increased from 1.53 for pure polysulfone to 3.57 at 40% zeolite loading.
Poly vinylidene fluoride (PVDF) is generally considered as a promising gas barrier (GB) polymer because of its remarkable economic feasibility, chemical compatibility, thermal stability, mechanical strength but low gases permeability.9,10 However, its performance is often limited by its hydrophobic nature that associates with pervasive fouling.11 To counter these challenges, this study used sulfonated poly ether ether ketone (SPEEK) as a charged gas conductor (GC) additive into PVDF. A series of assays revealed that the introduction of SPEEK as additive agent in PVDF had at least three advantages compared to other competitors. The first one is miscibility, represented by that SPEEK had free compatible with SPEEK at free percentage. Secondly, the gas separation performance of the composite membranes had widely adjustable gas selectivity, so that they can be applied as EMAP for different preserved products.12,13 Last but not least, traditional PVDF based materials as hydrophobic polymers are prone to be fouled, while the introduction of –SO3 groups in SPEEK can significantly enhance its hydrophilicity.14 As the results, the composite membranes will be a promising candidate as EMAP to preserve different harvest products.
2. Experimental
2.1. Materials
PEEK (Victrek450G) was obtained from Victrek, UK. PVDF (FR904) was obtained from New Materials Co. Ltd., China. H2SO4 solution (98 wt%) and N,N-dimethylformamide (DMF) were obtained from Donghong Chemical Plant, China. Microbiology agars were obtained from Huankai Microbe Company, China. Escherichia coli, Pseudomonas aeruginosa and Staphylococcus aureus strains were obtained from Guangdong Province Bacteria Collection Center, China. Chemicals in this study were used without further purification.2.2. PEEK sulfonation
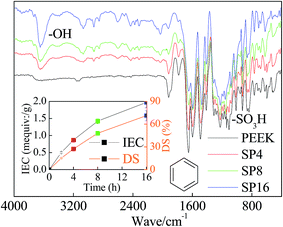
PEEK was sulfonated by thoroughly dissolving into 98 wt% H2SO4 (10 g/200 mL).12 The mixture was heated to 60 °C and kept under mechanical stirring at nitrogen atmosphere for 16 h. Then, the resulting solution was slowly injected into a glass tank with ice water. The raw SPEEK material was obtained by the precipitate. It was adequately washed and dried under vacuum at 60 °C for 48 h.Functional groups in the SPEEK were investigated using a Fourier transform infra-red spectrum (FTIR) analyzer (Vector 33, Brucker Company, Germany).15 Ion exchange capacity (IEC) and the degree of sulfonation (DS) of the prepared SPEEK were determined by H+ release amount. For this, minced SPEEK (∼1 g) was suspended in 2 M NaCl solution (100 mL) for 24 h. The resulting solution was titrated using 0.1 M NaOH solution with phenolphthalein as indicator. The results were calculated by eqn (1) and (2):16
 | (1) |
 | (2) |
2.3. Preparation and characterization of the membranes
Pure PVDF and SPEEK solutions were respectively prepared by dissolving ∼15 wt% of corresponding polymer into DMF solvent. On this basis, the casting solutions of blending membrane (BM) were prepared by mixing the pure solutions in different radio (for the samples of BM25, BM50, and BM75, 25 v/v%, 50 v/v% and 75 v/v% of SPEEK were blended into PVDF, respectively). Each solution was centrifuged at 4000 rpm for 3 min to eliminate foam. Then they were casted on a clear glass plate (360 mm × 300 mm) at ∼20 °C and ∼75% relative humidity. The casted glass plates were dried at 60 °C for 24 hours to evaporate solvent and form membranes.12Each prepared membrane was characterized by a series of assays. Micro-structure was scanned using a scanning electron microscope (SEM, Nova Nano 450, US) operated at 20 kV and 80 mA.17 Thermal behavior was reflected using a differential scanning calorimeter (DSC, TGA/DSC-1/1100, Mettler-Toledo Co. Ltd., Switzerland).18 Hydrophilicity was determined using a contact angle (CA) goniometer (OCA15, Dataphysics Company, Germany).19 Anti-biofouling capability was assessed through the inhibiting ring on inoculated agars.18 Porosity was measured by a Brunauer–Emmett–Teller (BET) nitrogen adsorber (JW-BK222, JWGB, China).20 Internal void space was examined via water-absorption porosities values (ε).21
2.4. Gas permeation measurements
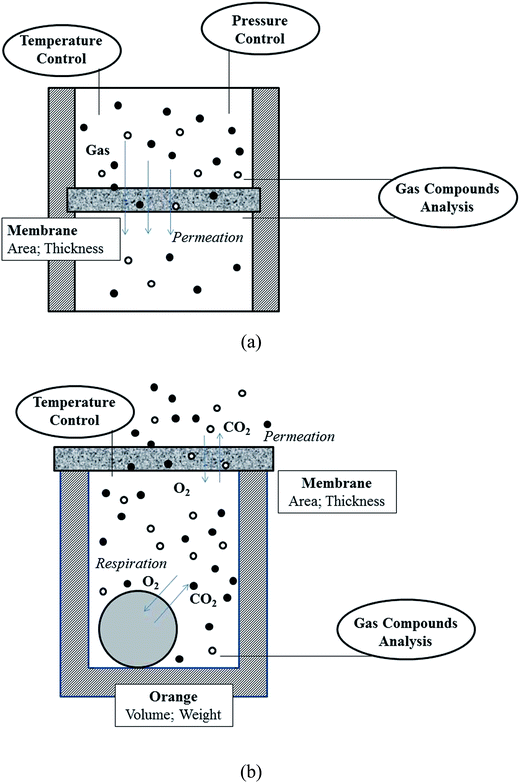
An air-tight system (as Fig. 1a) was established for gas analysis.22 The gas selectivities and permeabilities of the membrane were determined by comparing the gas composition at both sides of the membranes using a compact gas chromatograph (CGC, Interscience, Fran). Using pure gases, gas permeability (P) and ideal selectivity (S) were determined from the rate of pressure increase (dP/dt) obtained when permeation reached steady state, as the following equations:22
 | (3) |
 | (4) |
When it came to mixed-gas, the selectivity (α) was calculated by the ratio of mole fraction of the gases, as eqn (5):22
 | (5) |
2.5. Actual applications
The evaluation of the applicability and feasibility of gas separation membranes requires the performance testing under actual conditions. In this study, navel orange (Citrus sinensis) and cauliflower (Brassica oleracea L. var. botrytis) obtained from local farmers were used as experimental samples. Their average individual weight was ∼300 g. Each sample was assayed within three hours after harvested.A cylindrical measure chamber (φ 15 cm × 12 cm) was set up to preserve sample in the assay (as Fig. 1b). Its wall and bottom were made by glass that can thoroughly isolate air, while its opened bottom tightly attached a prepared membrane (pure PVDF, BM25, BM50, BM75, or pure SPEEK) for analysis. Additionally, two control groups were set up for comparison. C1 used a glass cover on the chamber bottom that can thoroughly isolate air. C2 let the bottom of the chamber expose to the air without a shield.
3. Results and discussion
3.1. Sulfonated behaviors of PEEK
PEEK sulfonation can be considered as a process in which –SO3H groups are grafted into available –H sites.23 During this reaction, DS of SPEEK showed increasing trends, but such growth would slow down gradually and tended to equilibrium with increasing time.Fig. 2 illustrated FTIR results. The peaks presented at ∼1600 cm−1 can be attributed to vibration of the aromatic ring skeleton, whereas that around ∼1200 cm−1 was primarily due to the presence of aryl oxide.24 Meanwhile, the sulfonation behavior can be represented by the characteristic peaks of –SO3H around ∼1100 cm−1. Another noteworthy peak was around ∼3200 cm−1 caused by –OH.24 It is a typical sign caused by hydration, suggesting the hydrophilicity of materials was significantly improved during the sulfonation process.25
3.2. Blends miscibility
PVDF has a neatly arranged main chain alternating –CH2– and –CF2–. In this chain, H (1s1) atoms are prone to lose its only electron, and F (1s2 2s2 2p5) atoms tend to absorb one electron to fill their empty 2p-orbital. Meanwhile, SPEEK has an aromatic backbone contains a lot of oxidative phenyl O (1s2 2s2 2p5) and reductive phenyl H (1s1). The graft of –SO3H groups increased the number of activated O atoms further.12 When these two components were mixed, possible interactions between two components are shown in Fig. 3a.23,26 As it shown, H atoms from the aromatic ring of SPEEK can loss its only electron to occupy the empty 2p-orbital of F from PVDF. O atoms from SPEEK can also form 2 lone-pairs coordination bond with H atoms from PVDF.27 On this basis, the blending materials can maintain a stable state.To verify the miscibility between PVDF and SPEEK, an initial indication was that all casting solutions and prepared polymers were transparent and homogeneous.22 More obvious details were illustrated by SEM analysis (as Fig. 3b). No individual matrix or mixed interface can be found in the surface and crossing-section structure of the BMs. Additionally, further criterion was given by DSC results that obtained the existence of single glass transition temperature (Tg), by using the Fox equation, given as:22
 | (6) |
3.3. Antifouling and porosities
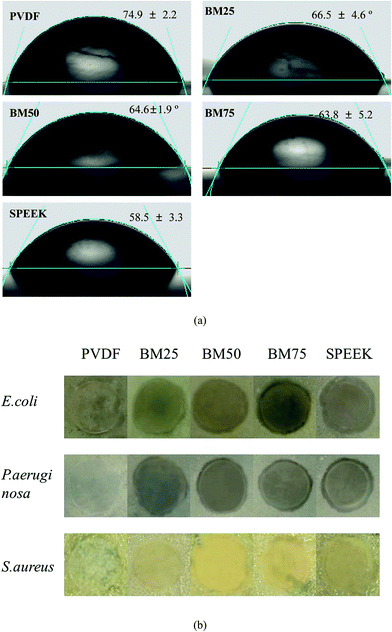
Surface hydrophilicity can enhance membranes' fouling resistance, because it can improve membranes' wettability to suppress the effects of concentration polarization.5 PVDF, as a polymer formed by nonpolar monomers, is a relatively hydrophobic material. Therefore, as shown in Fig. 4a, the CA of pure PVDF was measured as ∼75°. By comparison, the CA of pure SPEEK was ∼60°, with a lot of hydrophilic –SO3H groups on its main chain.28 On this basis, the CA of the BMs can be theoretically set up to a range from 60° to 75°.Additionally, an important effect that was effective in the BM's anti-biofouling capacity was the antimicrobial capacity of SPEEK, attributed to the –SO3H groups.29 As shown in Fig. 4b, the pure PVDF cannot make any effects toward the growth of each microbial species, but the BMs with introduction of SPEEK showed inhibiting rings around the membrane disks. Obviously, the SPEEK concentration in the BMs dictated the width of the rings.
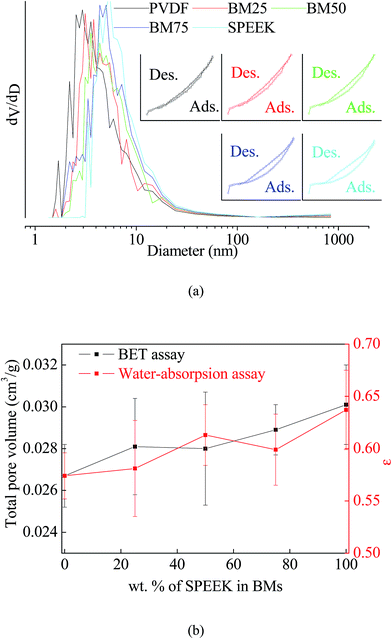
When it came to the porosities, Fig. 5a exhibited the results of BET analysis. As it shown, each membrane showed similar N2 adsorption–desorption isotherms with a convex upward that matches the type I isotherm.30 Compared to SPEEK, PVDF has much sharper N2 curve with relatively smaller average pore diameter. Thus, more SPEEK compounds in the BMs can slightly improve the average pore size (as Fig. 5a), as well as total pore volume and water-absorption porosities values ε (as Fig. 5b).
3.4. Pure gas transport
Generally, major component in internal atmosphere of a packaging is N2. It is often considered as a chemically inert gas. The followed gases are O2 and CO2, both of which determine the respiration rate of the stored products. Table 1a summarizes permeabilities and ideal selectivities of pure SPEEK membrane with different DS for pure gas separation. It displayed that the increase of DS can improve the permeabilities of all gases. The reason can be attributed to the introduction of the polar –SO3 groups in the polymeric chains can improve the solubility coefficients of the gas particles.12 Compared to N2 or O2, CO2 had a larger quadrupole moment so that it showed more obvious increase in solubility coefficient, resulting in that the ideal selectivity increased more significantly.12| (a) | ||||||
|---|---|---|---|---|---|---|
| Membr. | DS (%) | Permeability (kPa) | Ideal selectivity | |||
| CO2 | O2 | N2 | CO2/N2 | O2/N2 | ||
| a The study was operated at 293 K and 1000 kPa of feed pressure. | ||||||
| PEEK | 0 | 430 ± 63 | 113 ± 14 | 21 ± 5 | 20.48 | 5.38 |
| SP4 | 27.4 | 6650 ± 65 | 147 ± 12 | 27 ± 2 | 24.63 | 5.44 |
| SP8 | 48.0 | 1018 ± 107 | 212 ± 47 | 35 ± 6 | 29.09 | 6.06 |
| SP16 | 71.2 | 1494 ± 207 | 297 ± 54 | 44 ± 9 | 33.95 | 6.75 |
| (b) | |||||
|---|---|---|---|---|---|
| Membr. | Permeability (kPa) | Ideal selectivity | |||
| CO2 | O2 | N2 | CO2/N2 | O2/N2 | |
| PVDF | 105 ± 39 | 19 ± 5 | 5 ± 1 | 21.00 | 3.80 |
| BM25 | 602 ± 68 | 121 ± 20 | 23 ± 6 | 26.17 | 5.26 |
| BM50 | 942 ± 106 | 185 ± 24 | 33 ± 7 | 28.55 | 5.61 |
| BM75 | 1300 ± 72 | 249 ± 33 | 41 ± 4 | 31.71 | 6.07 |
| SPEEK | 1494 ± 207 | 297 ± 54 | 44 ± 9 | 33.95 | 6.75 |
Additionally, Table 1b revealed the gas separation properties of the BMs. Unlike SPEEK, pure PVDF has an apolar main chain that can hardly produce interaction with gas particles. Thus, PVDF can hardly permeate almost all gases so that it is often considered as a gas barrier. In this study, the incorporation of SPEEK in the BMs improved their polar, in addition to the dissolution towards the penetrant molecules. As a result, both permeabilities and ideal selectivities increased with more SPEEK concentration (DS = 71.2%) in the BMs.
3.5. CO2 plasticization
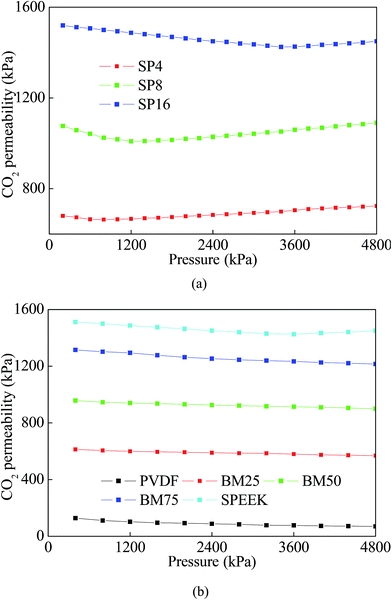
As a highly condensable gas, CO2 can plasticize the polymer matrix and lead to a drastic turning point in permeability at a certain partial pressure named as plasticization pressure.31 During the gas particles go through a polymeric membrane, CO2 plasticization will make significant influences to evaluate a membrane's performance.22 This effect can be suppressed by chemical cross-linking,6 thermal treatment32 or blending with less plasticizable polymers.33In this study, the change in CO2 permeation with respect to CO2 partial pressure was analyzed according to the study of Khan et al.22 As shown in Fig. 6a, the initial CO2 permeability decreased with increasing feed pressure, which was in agreement with the permeation of gases through glassy polymeric membranes. As the pressure exceeded plasticization pressure, the gas permeability started to increase with pressure exhibiting CO2 plasticization. On this basis, SP4 membrane with the lowest DS (27.4%) showed a slight decrease in the CO2 permeability with increase in pressure until ∼600 kPa. SP8 with higher DS (48.0%) improved the plasticization performance by shifting the plasticization pressure to ∼1200 kPa. The SP16 (DS = 71.2%) had the highest plasticization pressure of ∼3500 kPa. The increase of plasticization pressure can be possibly attributed to increase in chain stiffness induced by the higher content of sulfonic groups.12
On this basis, plasticization effects in the prepared BMs were demonstrated in Fig. 6b. As it shown, no obvious sign of plasticization can be found in the each membrane until 50 bar. Further investigation at higher pressures was not possible due to limitations of the applied gas permeation system. These results indicated that blending with PVDF could significantly help in suppressing the CO2 plasticization by increasing the plasticization pressure.
3.6. Binary mixed gas permeations
When using a membrane for mixed gas, an important effect that should be addressed is the competitive sorption of the penetrate gas molecules. It dictates the difference between the ideal and mixed gas selectivities, especially when the gas has a high sorption in the polymer.34 Table 2 displayed the permeabilities of the BMs for different kinds of binary mixed gases (1![[thin space (1/6-em)]](https://www.rsc.org/images/entities/char_2009.gif) :
:![[thin space (1/6-em)]](https://www.rsc.org/images/entities/char_2009.gif) 1). As the results, permeability of each gas in the mixed gas assays was lower than that in the pure gas measurements. Relatively, the decrease in CO2 permeability was more significant in comparison to that of N2, resulting in decreasing CO2/N2 selectivity. This decrease can be ascribed to competitive sorption of the slower permeating N2.
1). As the results, permeability of each gas in the mixed gas assays was lower than that in the pure gas measurements. Relatively, the decrease in CO2 permeability was more significant in comparison to that of N2, resulting in decreasing CO2/N2 selectivity. This decrease can be ascribed to competitive sorption of the slower permeating N2.
![[thin space (1/6-em)]](https://www.rsc.org/images/entities/char_2009.gif) :
:![[thin space (1/6-em)]](https://www.rsc.org/images/entities/char_2009.gif) 1) permeabilities and selectivities of the prepared BMsa
1) permeabilities and selectivities of the prepared BMsa
| Membr. | Permeability (kPa) | α | Permeability (kPa) | α | ||
|---|---|---|---|---|---|---|
| CO2 | N2 | O2 | N2 | |||
| a The study was operated at 293 K and 1000 kPa of feed pressure. | ||||||
| PVDF | 99 ± 16 | 5 ± 0 | 19.80 | 14 ± 3 | 4 ± 1 | 3.50 |
| BM25 | 532 ± 53 | 23 ± 6 | 23.13 | 106 ± 18 | 22 ± 3 | 4.82 |
| BM50 | 817 ± 76 | 32 ± 3 | 25.53 | 142 ± 14 | 28 ± 3 | 5.07 |
| BM75 | 1048 ± 120 | 39 ± 2 | 26.87 | 196 ± 30 | 37 ± 6 | 5.30 |
| SPEEK | 1243 ± 87 | 43 ± 4 | 28.91 | 230 ± 31 | 42 ± 5 | 5.48 |
3.7. Ternary simulated gas permeations
Respiration effect of stored products will consume O2 and release CO2 in the packaging, while a simultaneous effect was gas exchange through the membrane caused by difference in gas concentration. Generally, the internal atmosphere of an ideal EMAP will show a trend that reducing O2 composition is replaced by N2 and CO2 until the internal atmosphere get into equilibrium. As a result, O2 concentration in the atmosphere would decrease from ∼21% to ∼5% (p/p). N2 would increase from ∼78% to ∼90% (p/p). CO2 would increase from ∼0.4% to ∼6% and then decrease to ∼5% (p/p).1In this study, 4 ternary mixed gases (MG1, MG2, MG3 and MG4) were prepared to simulate the atmosphere in different stage of products storage to analyze CO2 and O2 selectivities. As shown in Fig. 7, because difference in the compounds of simulated gases was slight, the difference in different gases is not very obvious. However, such difference reasonably plays an important role for equilibrium atmosphere in the packaging during the products storage.
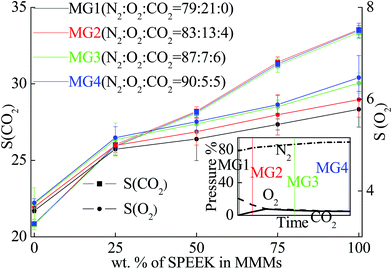 | ||
| Fig. 7 CO2 and O2 selectivities of the BMs in simulated ternary mixed gas at 293 K and 1000 kPa of feed pressure. | ||
3.8. Modified atmosphere assays
As shown in Fig. 8a, using the prepared BMs to preserve orange, CO2 concentration inside the packaging got into an equilibrium state after 11.1–23.8 h. The final concentration reached and kept at 4.6–7.9% (p/p). Meanwhile, O2 concentration got into the equilibrium concentration of 4.4–7.8% (p/p) after 16.2–24.4 h (as Fig. 8b). Similarly, when the BMs were used to preserve cauliflower, the CO2 concentration arrived at 3.6–8.7% (p/p) after 3.7–9.1 h of storage (as Fig. 9a), while the O2 concentration for cauliflower arrived in 4.2–9.2% (p/p) after 5.5–9.6 h (as Fig. 9b). The results indicated a phenomenon that more SPEEK compound in BMs led to shorter equilibrium time, with an equilibrium atmosphere included lower CO2 concentration and higher O2 concentration.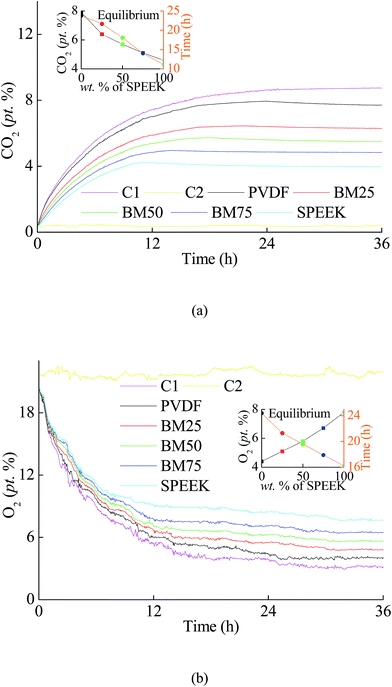 | ||
| Fig. 8 The variations in (a) CO2 concentration and (b) O2 concentration during the storage of orange using the BMs. | ||
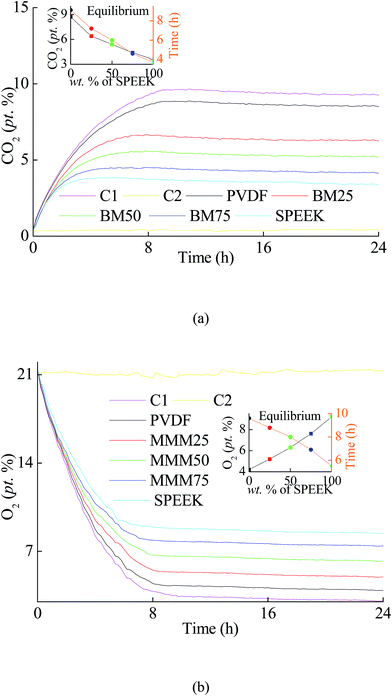 | ||
| Fig. 9 The variations in (a) CO2 concentration and (b) O2 concentration during the storage of cauliflower using the BMs. | ||
Stored vegetables or fruits need to respire as long as there are gases available. Suitable stored atmosphere can significantly prolong the shelf life of stored products by reducing their loss in stored energy reserves through lowering the respiration rate. Because of the biological difference, the optimum O2 and CO2 concentrations of different product species vary a lot. As reported, Table 3 shows the recommended concentration of CO2 and O2 in storage atmosphere that is suitable for many common fruits and vegetables.1 Accordingly, the BMs packaging aren't only suitable for both orange and cauliflower, it can be also offers a suitable atmosphere to preserve many other fruits and vegetable species.
| Fruits | O2 (%) | CO2 (%) | Vegetables | O2 (%) | CO2 (%) |
|---|---|---|---|---|---|
| a These vegetable and fruit species may be suitable for storage using the BMs. | |||||
| Apple | 1–2 | 1–3 | Artichoke | 2–3 | 2–3 |
| Apricot | 2–3 | 2–3 | Snap beans | 2–3 | 5–10 |
| Avocadoa | 2–5 | 3–10 | Broccoli | 1–2 | 5–10 |
| Bananaa | 2–5 | 2–5 | Sprouts | 1–2 | 5–7 |
| Grape | 2–5 | 1–3 | Cabbagea | 2–3 | 3–6 |
| Grapefruita | 3–10 | 5–10 | Carrota | 5 | 3–4 |
| Kiwifruit | 1–2 | 3–5 | Cauliflowera | 2–5 | 2–5 |
| Lemona | 5–10 | 0–10 | Chili peppera | 3 | 5 |
| Mangoa | 3–7 | 5–8 | Sweet corna | 2–4 | 10–20 |
| Orangea | 5–10 | 0–5 | Cucumber | 3–5 | 0 |
| Papayaa | 2–5 | 5–8 | Lettuce | 1–3 | 0 |
| Peach | 1–2 | 3–5 | Mushrooma | 3–21 | 5–15 |
| Pear | 2–3 | 0–1 | Spinach | Air | 10–20 |
| Pineapplea | 2–5 | 5–10 | Tomato | 3–5 | 0 |
| Strawberry | 5–10 | 15–20 | Onion | 1–2 | 0 |
Last but not least, another notable effect for harvested fruits and vegetables is the transpiration effect, by which they will be detached from the source of water. Actually, a loss in weight of only 5% will cause many vegetables to appear wilted or shriveled. Without the correct packaging, this can happen in a few hours.2 Luckily, both PEEK and PVDF have relatively low water vapour transmission rate,13,35,36 so that both of them can effectively stop the fluids loss from products' transpiration. Reasonably, the prepared BMs, which are mixed those two fluids barrier, will be effective in the fresh-keeping of the stored products by keeping their moisture. This effect will be studied in further studies.
4. Conclusions
In this study, a novel GC (SPEEK)–GB (PVDF) blending membrane with adjustable gas separation performance was prepared. The miscibility between SPEEK and PVDF was evidenced by structural scan and thermal analysis. SPEEK can significantly enhance antifouling and optimize the porosities of the BM, while PVDF can effectively suppress the CO2 plasticization. The blending polymer was used for gas permeations. Its CO2 and O2 permeabilities in pure gas can be adjusted at the ranges of 105–1494 kPa and 19–297 kPa, respectively. Thus the ideal selectivity of CO2/N2 and O2/N2 were 20.48–33.95 and 5.38–6.75, respectively. Similarly, in binary mixed gas with 50% of N2, the CO2 and O2 permeabilities can be adjusted at the ranges of 99–1243 kPa and 14–230 kPa, respectively. Thus the CO2/N2 and O2/N2 selectivity were 19.80–28.91 and 3.50–5.48. When the blending polymer was used for orange storage, the atmosphere inside the packaging finally got into an equilibrium state that included 4.6–7.9% of CO2 and 7.8–4.4% of O2 (p/p). Meanwhile, the equilibrium state for cauliflower storage included 3.6–8.7% of CO2 and 9.2–4.2% of O2 (p/p). The results indicated this packaging can offer recommended atmosphere for both orange and cauliflower. The atmosphere was also suitable for many other fruits and vegetable species. Consequently, the prepared blending polymer will have a promising application as MA packaging to preserve fresh products.Conflicts of interest
There are no conflicts to declare.Acknowledgements
The authors are grateful for financially supported by the financial support by Guangzhou Science and Technology Program Key Projects (201508020086), Science and Technology Equipment Mobilization Project of Guangdong Province (x2skB2160440), Applied Science and Technology Research and Development Special Project of Guangdong Province (2015B020230001), the Project of Technology Research Center for Lingnan Characteristic Fruits & Vegetables Processing and Application Engineering of Guangdong Province (No. [2015]1487) and the Project of Food Science Innovation Team of Guangdong Higher Education Institutes (2016KCXTD020).References
- A. Aspelund and K. Jordal, Int. J. Greenhouse Gas Control, 2007, 1, 343–354 CrossRef CAS.
- Sandhya, LWT–Food Sci. Technol., 2010, 43, 381–392 CrossRef CAS.
- T. Dong, S. X. Song, M. Liang, Y. Wang, X. J. Qi, Y. Q. Zhang, X. Y. Yun and Y. Jin, J. Food Sci., 2017, 82, 97–107 CrossRef CAS PubMed.
- D. Rico, A. B. Martin-Diana, J. M. Barat and C. Barry-Ryan, Trends Food Sci. Technol., 2007, 18, 373–386 CrossRef CAS.
- P. Zhang, J. W. Qian, Y. Yang, Y. X. Bai, Q. F. An and W. D. Yan, J. Membr. Sci., 2007, 288, 280–289 CrossRef CAS.
- P. S. Tin, T. S. Chung, Y. Liu, R. Wang, S. L. Liu and K. P. Pramoda, J. Membr. Sci., 2003, 225, 77–90 CrossRef CAS.
- A. Ammar, A. Elzatahry, M. Al-Maadeed, A. M. Alenizi, A. F. Huq and A. Karim, Appl. Clay Sci., 2017, 137, 123–134 CrossRef CAS.
- A. L. Khan, A. Cano-Odena, B. Gutierrez, C. Minguillon and I. F. J. Vankelecom, J. Membr. Sci., 2010, 350, 340–346 CrossRef CAS.
- A. Bagheri, M. Javanbakht, H. Beydaghi, P. Salarizadeh, A. Shabanikiac and H. S. Amolid, RSC Adv., 2016, 6, 39500–39510 RSC.
- Y. Q. Zhang and X. Lv, J. Membr. Sci., 2016, 520, 54–65 CrossRef CAS.
- E. A. Feijani, A. Tavasoli and H. Mahdavi, Ind. Eng. Chem. Res., 2015, 54, 12124–12134 CrossRef.
- A. L. Khan, X. F. Li and I. F. J. Vankelecom, J. Membr. Sci., 2011, 372, 87–96 CrossRef CAS.
- L. Jia, X. Xu, H. Zhang and J. Xu, J. Appl. Polym. Sci., 1996, 60, 1231–1237 CrossRef CAS.
- W. R. Bowen, T. A. Doneva and H. B. Yin, Desalination, 2002, 145, 39–45 CrossRef CAS.
- I. Sawada, R. Fachrul, T. Ito, Y. Ohmukai, T. Maruyama and H. Matsuyama, J. Membr. Sci., 2012, 387–388, 1–6 CrossRef CAS.
- A. Rahimpour, S. S. Madaeni, S. Ghorbani, A. Shockravi and Y. Mansourpanah, Appl. Surf. Sci., 2010, 256, 1825–1831 CrossRef CAS.
- Q. He, J. L. Dai, L. Zhu, S. F. Li, K. J. Xiao and Y. R. Yin, Sci. Adv. Mater., 2016, 8, 1878–1886 CrossRef CAS.
- H. Basri, A. F. Ismail, M. Aziz, K. Nagai, T. Matsuura, M. S. Abdullah and B. C. Ng, Desalination, 2010, 261, 264–271 CrossRef CAS.
- C. Fang, Y. Jing and Z. X. Lin, Int. J. Adhes. Adhes., 2017, 73, 1–7 CrossRef CAS.
- Q. He, Y. Shen, K. J. Xiao, J. Y. Xi and X. P. Qiu, Int. J. Hydrogen Energy, 2016, 41, 20709–20719 CrossRef CAS.
- H. Basri, A. F. Ismail and M. Aziz, Desalination, 2011, 273, 72–80 CrossRef CAS.
- A. L. Khan, X. F. Li and I. F. J. Vankelecom, J. Membr. Sci., 2011, 380, 55–62 CrossRef CAS.
- Q. He, Z. P. Zhu, H. Dong and K. J. Xiao, RSC Adv., 2017, 7, 37000–37006 RSC.
- A. Muthumeenal, S. S. Pethaiah and A. Nagendran, Renewable Energy, 2016, 91, 75–82 CrossRef CAS.
- H. L. Wen, C. S. Song, Y. F. Tong, L. Chen and X. L. Liu, J. Appl. Polym. Sci., 2005, 96, 489–493 CrossRef CAS.
- H. Yong, H. H. C. Park, Y. S. Kang, J. Won and W. N. Kim, J. Membr. Sci., 2001, 188, 151–163 CrossRef CAS.
- L. Han, R. Wang, D. Yuan, B. Wu, B. Lou and M. Hong, J. Mol. Struct., 2005, 737, 55–59 CrossRef CAS.
- N. Tan, G. Xiao and D. Yan, Chem. Mater., 2010, 22, 1022–1031 CrossRef CAS.
- S. Sami and E. Rahimpour, Orient. J. Chem., 2015, 31, 2195–2200 CrossRef CAS.
- Q. He, J. L. Dai, L. Zhu, K. J. Xiao and Y. R. Yin, J. Alloys Compd., 2016, 687, 326–333 CrossRef CAS.
- Y. Liu, R. Wang and T. S. Chung, J. Membr. Sci., 2001, 184, 231–239 CrossRef.
- H. Kawakami, M. Mikawa and S. Nagaoka, J. Membr. Sci., 1996, 118, 223–230 CrossRef CAS.
- A. Car, C. Stropnik, W. Yave and K. Peinemann, Sep. Purif. Technol., 2008, 62, 110–117 CrossRef CAS.
- R. Wang, S. L. Liu, T. T. Lin and T. S. Chung, Chem. Eng. Sci., 2002, 57, 967–976 CrossRef CAS.
- T. Ahmadzada, D. R. McKenzie, N. L. James, Y. B. Yin and Q. Li, Thin Solid Films, 2015, 591, 131–136 CrossRef CAS.
- F. F. Yang, Y. Li, X. Yu, G. G. Wu, Y. Xia, J. Y. Yu and B. Ding, RSC Adv., 2016, 6, 87820–87827 RSC.
| This journal is © The Royal Society of Chemistry 2017 |

