
 Open Access Article
 This Open Access Article is licensed under a Creative Commons Attribution-Non Commercial 3.0 Unported Licence
Morphology and adsorption properties of chitosan sulfate salt microspheres prepared by a microwave-assisted method†
Caiyun Zhanga,
Huanhuan Zhangb,
Rong Li c and
Yanjun Xing*a
c and
Yanjun Xing*a
aCollege of Chemistry, Chemical Engineering and Biotechnology of Donghua University, Shanghai 201620, China. E-mail: yjxing@mail.dhu.edu.cn
bShanghai Institute of Quality Inspection and Technical Research, Shanghai 200040, China
cNational Engineering Research Center for Dyeing and Finishing, Shanghai 201620, China
First published on 13th October 2017
Abstract
A simple and convenient microwave-assisted method was proposed for the synthesis of chitosan sulfate salt (CSS) microspheres with chitosan and sulfuric acid as reagents. The influence of different synthesis conditions such as the concentration of H2SO4 and the temperature and time of microwave-heating on the microsphere characteristics, was investigated using XRD, NMR, SEM and XPS. Novel multilayer CSS microspheres or discs with oblate and hollow shapes were observed. The morphology and size (diameter of 1.12–2.0 μm and thickness of 0.19–0.96 μm) of the CSS microspheres could be controlled by changing the temperature and time of microwave heating, and the H2SO4 concentration. Moreover, the morphology and size of the CSS microspheres were preserved even after the NaOH treatment. A complete ionic crosslinking of chitosan by sulfuric acid could be accomplished within 30 min with the help of microwave-heating. The CSS microspheres were found to be effective adsorbents for the removal of Cr(VI) from aqueous solutions. The adsorption capacity of CSS-30 for Cr(VI) was found to be 112 mg g−1, and the equilibrium was attained within 9 min. The Cr(VI) adsorption process was described well by the Langmuir isotherm and the pseudo-second-order kinetics. The chromate Cr(VI) ion was partially reduced to Cr(III) during the adsorption by CSS microspheres. Cr-absorbed CSS-30 could be regenerated by H2SO4 aqueous solution. The reusability experiment showed that CSS-30 was a stable adsorbent for Cr(VI).
Introduction
Chitosan microspheres have been the most widely studied adsorbents for Cr(VI) and pollutants due to their low toxicity, good biocompatibility, biodegradability and bioadhesion.1 The crosslinking between the chitosan chains via ionic interactions due to the reaction of the chitosan with multivalent anions has been extensively used for the preparation of chitosan microspheres. The non-chemical crosslinking by electrostatic interaction can avoid any possible toxicity of reagents and other undesirable effects.2 Multivalent small-size anion crosslinkers, including inorganic phosphate salts (tripolyphosphate), sulfate, sodium citrate, succinate and amino acids, have attracted much attention.3,4 The principle of ionic cross-linking and precipitation of chitosan with sulfate anion have also been investigated for the preparation of microspheres with release properties and as a membrane material.4–8 However, due to the reversible physical association, the chitosan microspheres produced by physical crosslinking always show poor stability (uncontrolled dissolution may occur) and uncontrolled particle size, restricting their practical applicability.2,9Due to its remarkable advantages, such as uniform heating, absence of hysteresis, energy efficiency and special non-thermal effect, the microwave-assisted synthesis technique has also been applied for the crosslinking of chitosan.10–12 However, only chemical crosslinking of chitosan under microwave heating has been reported.13
In this study, stable physical crosslinked chitosan microspheres were prepared using chitosan and H2SO4 aqueous solution as raw materials under microwave heating. Novel multilayer chitosan microspheres or disc with oblate and hollow shapes were formed under synergistic action of H2SO4 and microwave treatment. Moreover, the crosslinked chitosan microsphere still preserved their original spherical shape after the NaOH treatment. To the best of our knowledge, there was no reports on such morphology.14 The dynamic evolution of the morphology of the sulfuric acid crosslinked chitosan microspheres was also investigated to provide more information on the mechanism of the sulfuric acid treatment.14–16 Additionally, the adsorptive performance of CSS microspheres for Cr(VI) was studied.
Experimental
Materials
Low molecular weight chitosan (Mr 70![[thin space (1/6-em)]](https://www.rsc.org/images/entities/char_2009.gif) 000) with the deacetylation grade of approximately 90% were provided by Sinopharm Chemical Reagent Co., Ltd, China. Sulfuric acid and sodium hydroxide were obtained from Pinghu Chemical Reagent Company, China. Potassium dichromate, H3PO4, diphenyl-carbazide and acetone were obtained from Sinopharm Chemical Reagent Co., Ltd. All reagents were used as received.
000) with the deacetylation grade of approximately 90% were provided by Sinopharm Chemical Reagent Co., Ltd, China. Sulfuric acid and sodium hydroxide were obtained from Pinghu Chemical Reagent Company, China. Potassium dichromate, H3PO4, diphenyl-carbazide and acetone were obtained from Sinopharm Chemical Reagent Co., Ltd. All reagents were used as received.
Preparation of chitosan sulfate salt microspheres
In a typical preparation process, 1 g chitosan was added to a solution with a certain concentration (0.6–2.4 mol l−1) of sulfuric acid and the solution was maintained at 70–95 °C for a certain time (8–120 min) under microwave-assisted heating (MAS-3 type universal microwave synthesis instrument, Xinyi Microwave Chemical Technology Co., Ltd. input power 1360 W). After the mixture was hot-filtered and allowed to cool, the product was separated by centrifugation for 5 min at 8000 rpm (TG1650-WS Centrifuge, Shanghai Lu Xiangyi Centrifuge Instrument Co., Ltd). The obtained sediments were washed by suspending in water. These two purification steps were repeated until the pH of solution reached 7. The microspheres were then freeze-dried. The chitosan sulfate salt was referred to as CSS, and the samples reacted for different time were named as CSS-30, CSS-60, CSS-90 and CSS-120, respectively.The chitosan sulfate salt was also synthesized under oil bath heating with 1.2 mol L−1 H2SO4 aqueous solution at 90 °C for 30 min. The product was referred as CSS-30-oil.
Treatment of chitosan sulfate salt microspheres with NaOH
Samples CSS-30, CSS-60, CSS-90 and CSS-120 were deacidified by immersing each salt in 0.001 mol L−1 NaOH aqueous solution for 20 min with stirring, followed by washing with water. The products (generically named as CSS-S) were referred to as samples CSS-30-S, CSS-60-S, CSS-90-S and CSS-120-S, respectively.Materials characterization
The XRD analysis of chitosan, CSS and CSS-S was performed using an X-ray diffractometer (Rigaku Max-2250PC, Japan). Each sample was pressed into a lamellar container (20 mm in diameter). X-ray diffraction patterns of the samples were measured over the diffraction angle (2θ) range from 5° to 90° with a Cu Kα target at 40 kV and 200 mA.Solid state 13C NMR spectra of the samples were carried out on an Avance 400 NMR spectrometer (Bruker, Switzerland). The samples were measured at room temperature. The recycle time was 4 s, and the spinning rate was 5 kHz.
The XPS spectra were recorded for the samples and using an Escalab 250XI spectrometer (Thermo Fischer, USA) equipped with a monochromated Al Kα X-ray source at 12.5 kV and under the current of 16 mA as operating conditions. The modified and unmodified samples were placed at the angle of 90°under the ultralow pressure of 8 × 10⁻¹⁰ Pa. XPS data were calibrated using the binding energy of C 1s (284.6 eV) as the standard.
The samples were mounted on aluminum stubs, sputter-coated with gold-palladium and observed at 15 kV in a TM-1000 SEM instrument (Hitachi, Japan), and the particle sizes were measured and calculated using the Nano measurer software.
Batch adsorption experiments
The concentration of Cr(VI) in the solution phase was determined by a 722N spectrophotometer at various stages of the adsorption process by the standard diphenylcarbazide method17 at 540 nm using 1 cm matched quartz cuvette. After adsorption of Cr(VI) on CSS, the sample solution was vacuum suction filtered and the filtrate was treated with diphenylcarbazide, developing a pink color. The absorbance was recorded and quantitation was performed using the calibration curve.Fifty milliliters of Cr(VI) solution with concentrations between 20 and 220 mg L−1 were equilibrated with 10 mg of CSS in a quartz tube. The flasks were stirred using a magnetic stirrer at 298 K for 1 h. The amount of Cr(VI) adsorbed (mg g−1) at equilibrium (qe) can be given by
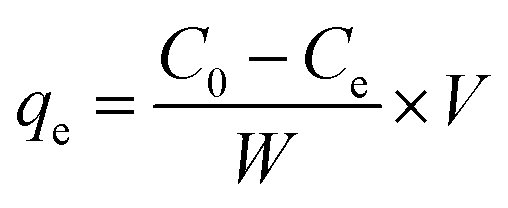 | (1) |
Regeneration of CSS
CSS-30 after adsorbed Cr(VI) were recycled by using 0.1 mol L−1 H2SO4. The product was wash by water, separated by centrifugation and then freeze-dried.Results and discussion
Characterization
Chitosan sulfate salt (CSS) microspheres were synthesized by microwave-assisted heating. The free amino groups in chitosan were first protonated in the acidic solution (the amide group in the acetylated chitosan was first deacetylated to amino group under the presence of sulfuric acid). The ammonium form (NH3+) in chitosan macromolecule chains further reacted with multivalent anions (SO42−) in solution by electrostatic adsorption to form crosslinked net or body structure polymer material. The related reactions are shown as Scheme 1.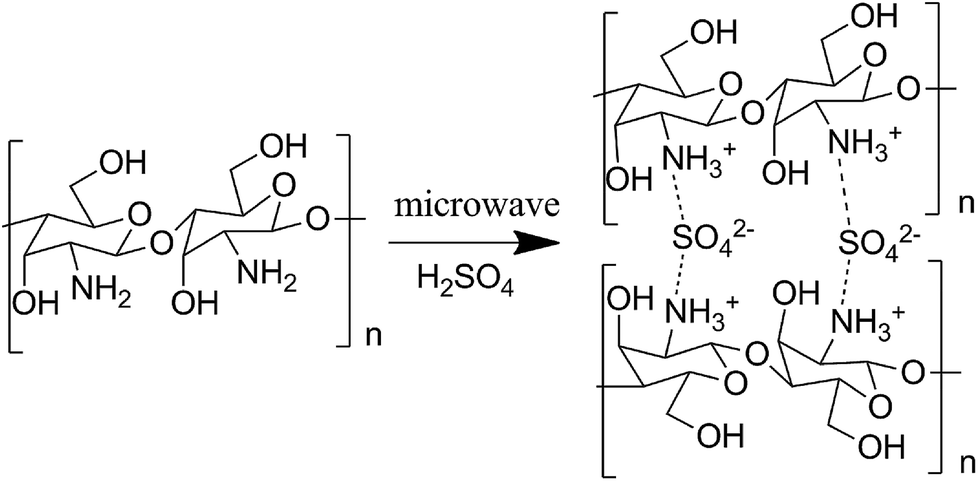 | ||
| Scheme 1 Reaction between chitosan and H2SO4. | ||
Fig. 1 shows the XRD results for unmodified chitosan, CSS and CSS-S prepared with different sulfuric acid treatment time. The characteristic crystalline peaks of unmodified chitosan at 10.7° and 20.2° can be clearly seen, which can be ascribed to the (020) and (200) reflection planes.18 This indicated that the unmodified chitosan is a polymer with low crystallinity index in a rather amorphous state.
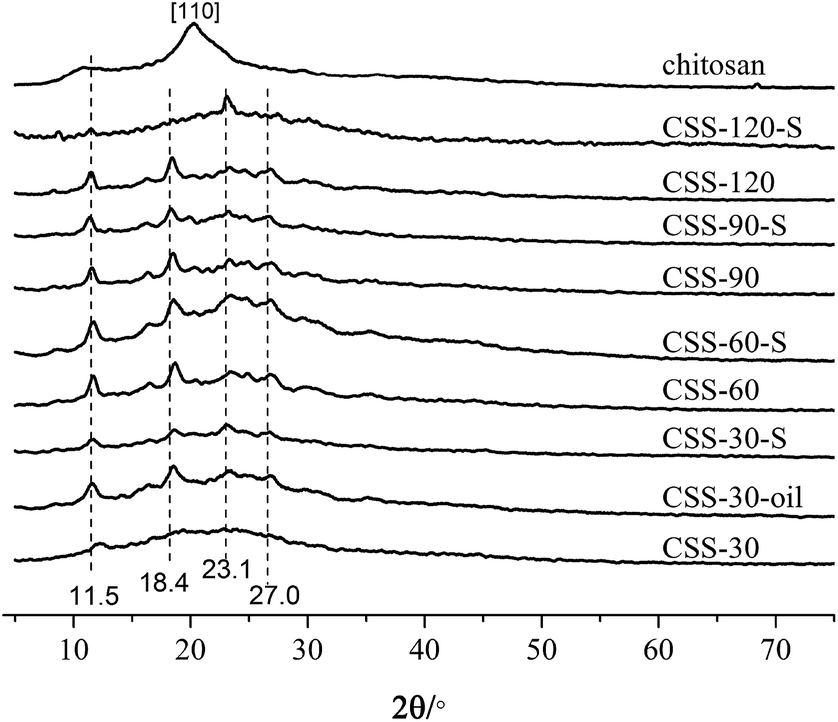 | ||
| Fig. 1 X-ray diffractograms of the chitosan, CSS, CSS-S and CSS-30-oil (the CSS samples were prepared at 90 °C under 1.2 mol L−1 H2SO4 for different time). | ||
After treatment with H2SO4 under microwave heating, the crystalline peak at 10.7° shifts to 11.5°, and the main crystalline peak of pure chitosan at 20.9° shifted to 23.2° for the CSS samples.19 The crystalline peaks at 18.4° and 27.0°could also be ascribed to the shift of crystalline peaks of unmodified chitosan. Compared with unmodified chitosan, the sharp crystalline peaks at 11.5°, 18.4°, 23.2° and 27.0° for samples CSS-30 to CSS-120 indicated the increase of the crystalline domain of all CSS samples under the treatment of sulfuric acid and microwave, and an increasing local order in the CSS samples.
For samples CSS-30, CSS-60, CSS-90 and CSS-120, the intensity of main crystalline peaks (11.5°, 18.4°, 23.2° and 27.0°) almost increased with the increase of the reaction time. This indicated that the crystallinity of the CSS samples increased with the increased exposure to sulfuric acid and microwave. The strong interactions between the chitosan –NH3+ groups and SO42− anions were related to the changes in the sample crystallinity. The d-spacing values at 2θ = 10–11° for CSS-30, CSS-60, CSS-90 and CSS-120 were calculated as 7.17 Å, 7.51 Å, 7.64 Å and 7.64 Å, respectively. All d-spacing values are smaller than that of pristine chitosan (8.05 Å in this study, 8.67 Å in ref. 20). The reduction of the d-spacing value after the treatment of chitosan by sulfuric acid indicated the shrinkage in cell size or intersegmental spacing, which should be resulted from the crosslinking between sulfate anion and chitosan.20
The XRD spectra of samples CSS-30-S, CSS-60-S, CSS-90-S and CSS-120-S were also determined to investigate the stability of the CSS sample (Fig. 1). The results showed that the characteristic peaks of CSS-30-S, CSS-60-S, CSS-90-S and CSS-120-S were preserved after the NaOH treatment. This indicated that the CSS microspheres had high stability. However, it was observed that the intensity of the main peaks at 11.5°, 18.4° and 27.0° of CSS-120-S decreased, while the intensity of the peak at 23.2° increased. This indicated that the crystallinity of the CSS samples decreased after the alkali treatment.
In order to investigate the influence of microwave-heating on the salification, the chitosan sulfate salt was also synthesized by convenient heating method (heated in oil bath for 30 min, named as CSS-30-oil). The four main crystalline peaks (11.5°, 18.4°, 23.2° and 27.0°) were also found in the XRD spectrum of CSS-30-oil (in Fig. 1). This indicated that CSS-30-oil has the same structure as CSS-30.
Solid state CP-MAS 13C NMR is known as a powerful absolute technique for the elucidation of the conformational features of the conformational features of chitosan salts.21 Compared to the NMR spectrum of reported chitosan sulfate salt,21 the NMR spectra of CSS exhibited all of the characteristic peaks of type II (two-fold helix) chitosan salt, depending on the double splitting of the C1 carbon atom in their solid-state 13C NMR spectra (Fig. 2). This indicated that the chemical structure of CSS was not altered under microwave irradiation. The extent of salt formation was found to be greater than 99% from the 13C NMR spectra. According to a previous report,21 the spectrum of chitosan showed that the peaks at 56.8, 60.9, 74.6, 75.0, 82.7 and 105.3 ppm were attributed to C2, C6, C3, C5, C4 and C1 of the glucosamine unit, respectively. For CSS, the chemical shift for the carbon attached to the amino group (C2) shifted from 56.8 ppm to 57.5 ppm and 55.0 ppm, and the peak for the carbon attached to the hydroxyl group (C3) shifted from 74.6 ppm to 69.9 ppm and 71.3 ppm, but the C6 did not show any shift. This showed that the amino group was the main reaction site for the SO42− substitution.
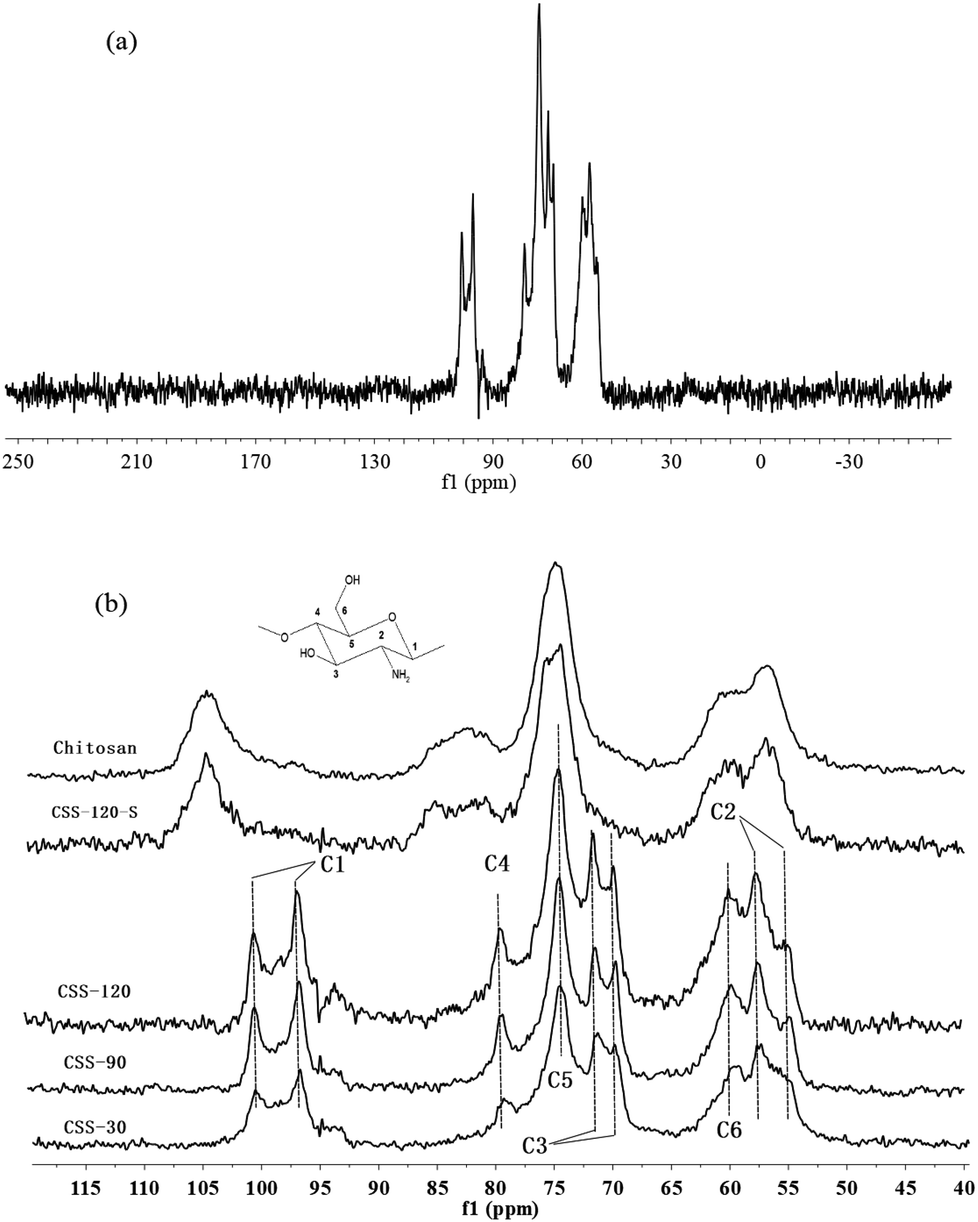 | ||
| Fig. 2 CP-MAS 13C NMR spectra of chitosan, CSS and CSS-S (the CSS samples were prepared at 90 °C under 1.2 mol L−1 H2SO4 for different time). | ||
Although the chemical shifts of CSS did not show a significant change with the increase of the reaction time, the intensities of all peaks increased gradually with the prolonged reaction time. The relatively small line widths in the spectra of CSS-120 (Fig. 2a) indicated that the samples are more crystalline.22 This was in accordance with the results obtained from XRD, FTIR (Fig. S1 in ESI†) and elemental analysis (Table S1 in ESI†). Based on FTIR, X-ray diffraction and CP-MAS 13C NMR measurements, the changes in the crystallinity were essentially completed after 30 min (Fig. 2b). This suggested that 30 min was sufficient time for the completion of ionic crosslinking with the assistance of microwave irradiation, and indicated that microwave heating was more effective than the convenient heating.23,24
It is noticed that the 13C NMR spectrum of CSS-120-S is similar to that of the unmodified chitosan rather than to that of CSS-120 (Fig. 2b). This may indicate that the ordered structure of CSS was destroyed after the NaOH treatment, which also confirmed the conclusions reached based on the XRD data.
Chemical compositions of chitosan sulfate-salt were further characterized by XPS (Fig. 3). The XPS spectra of all samples displayed no significant changes in the C 1s spectrum in comparison to the unmodified chitosan powder (Fig. 3a). The resolved C 1s spectrum revealed three peaks as shown in Fig. 3b. The C 1s peak at 284.6 eV was mainly assigned to the contaminated carbon or C–C/C–H chemical binding. The peak at 286.2 eV was assigned to C–O, C–N or C–OH, and the peak at 287.7 eV to the O–C–O chemical bindings.25
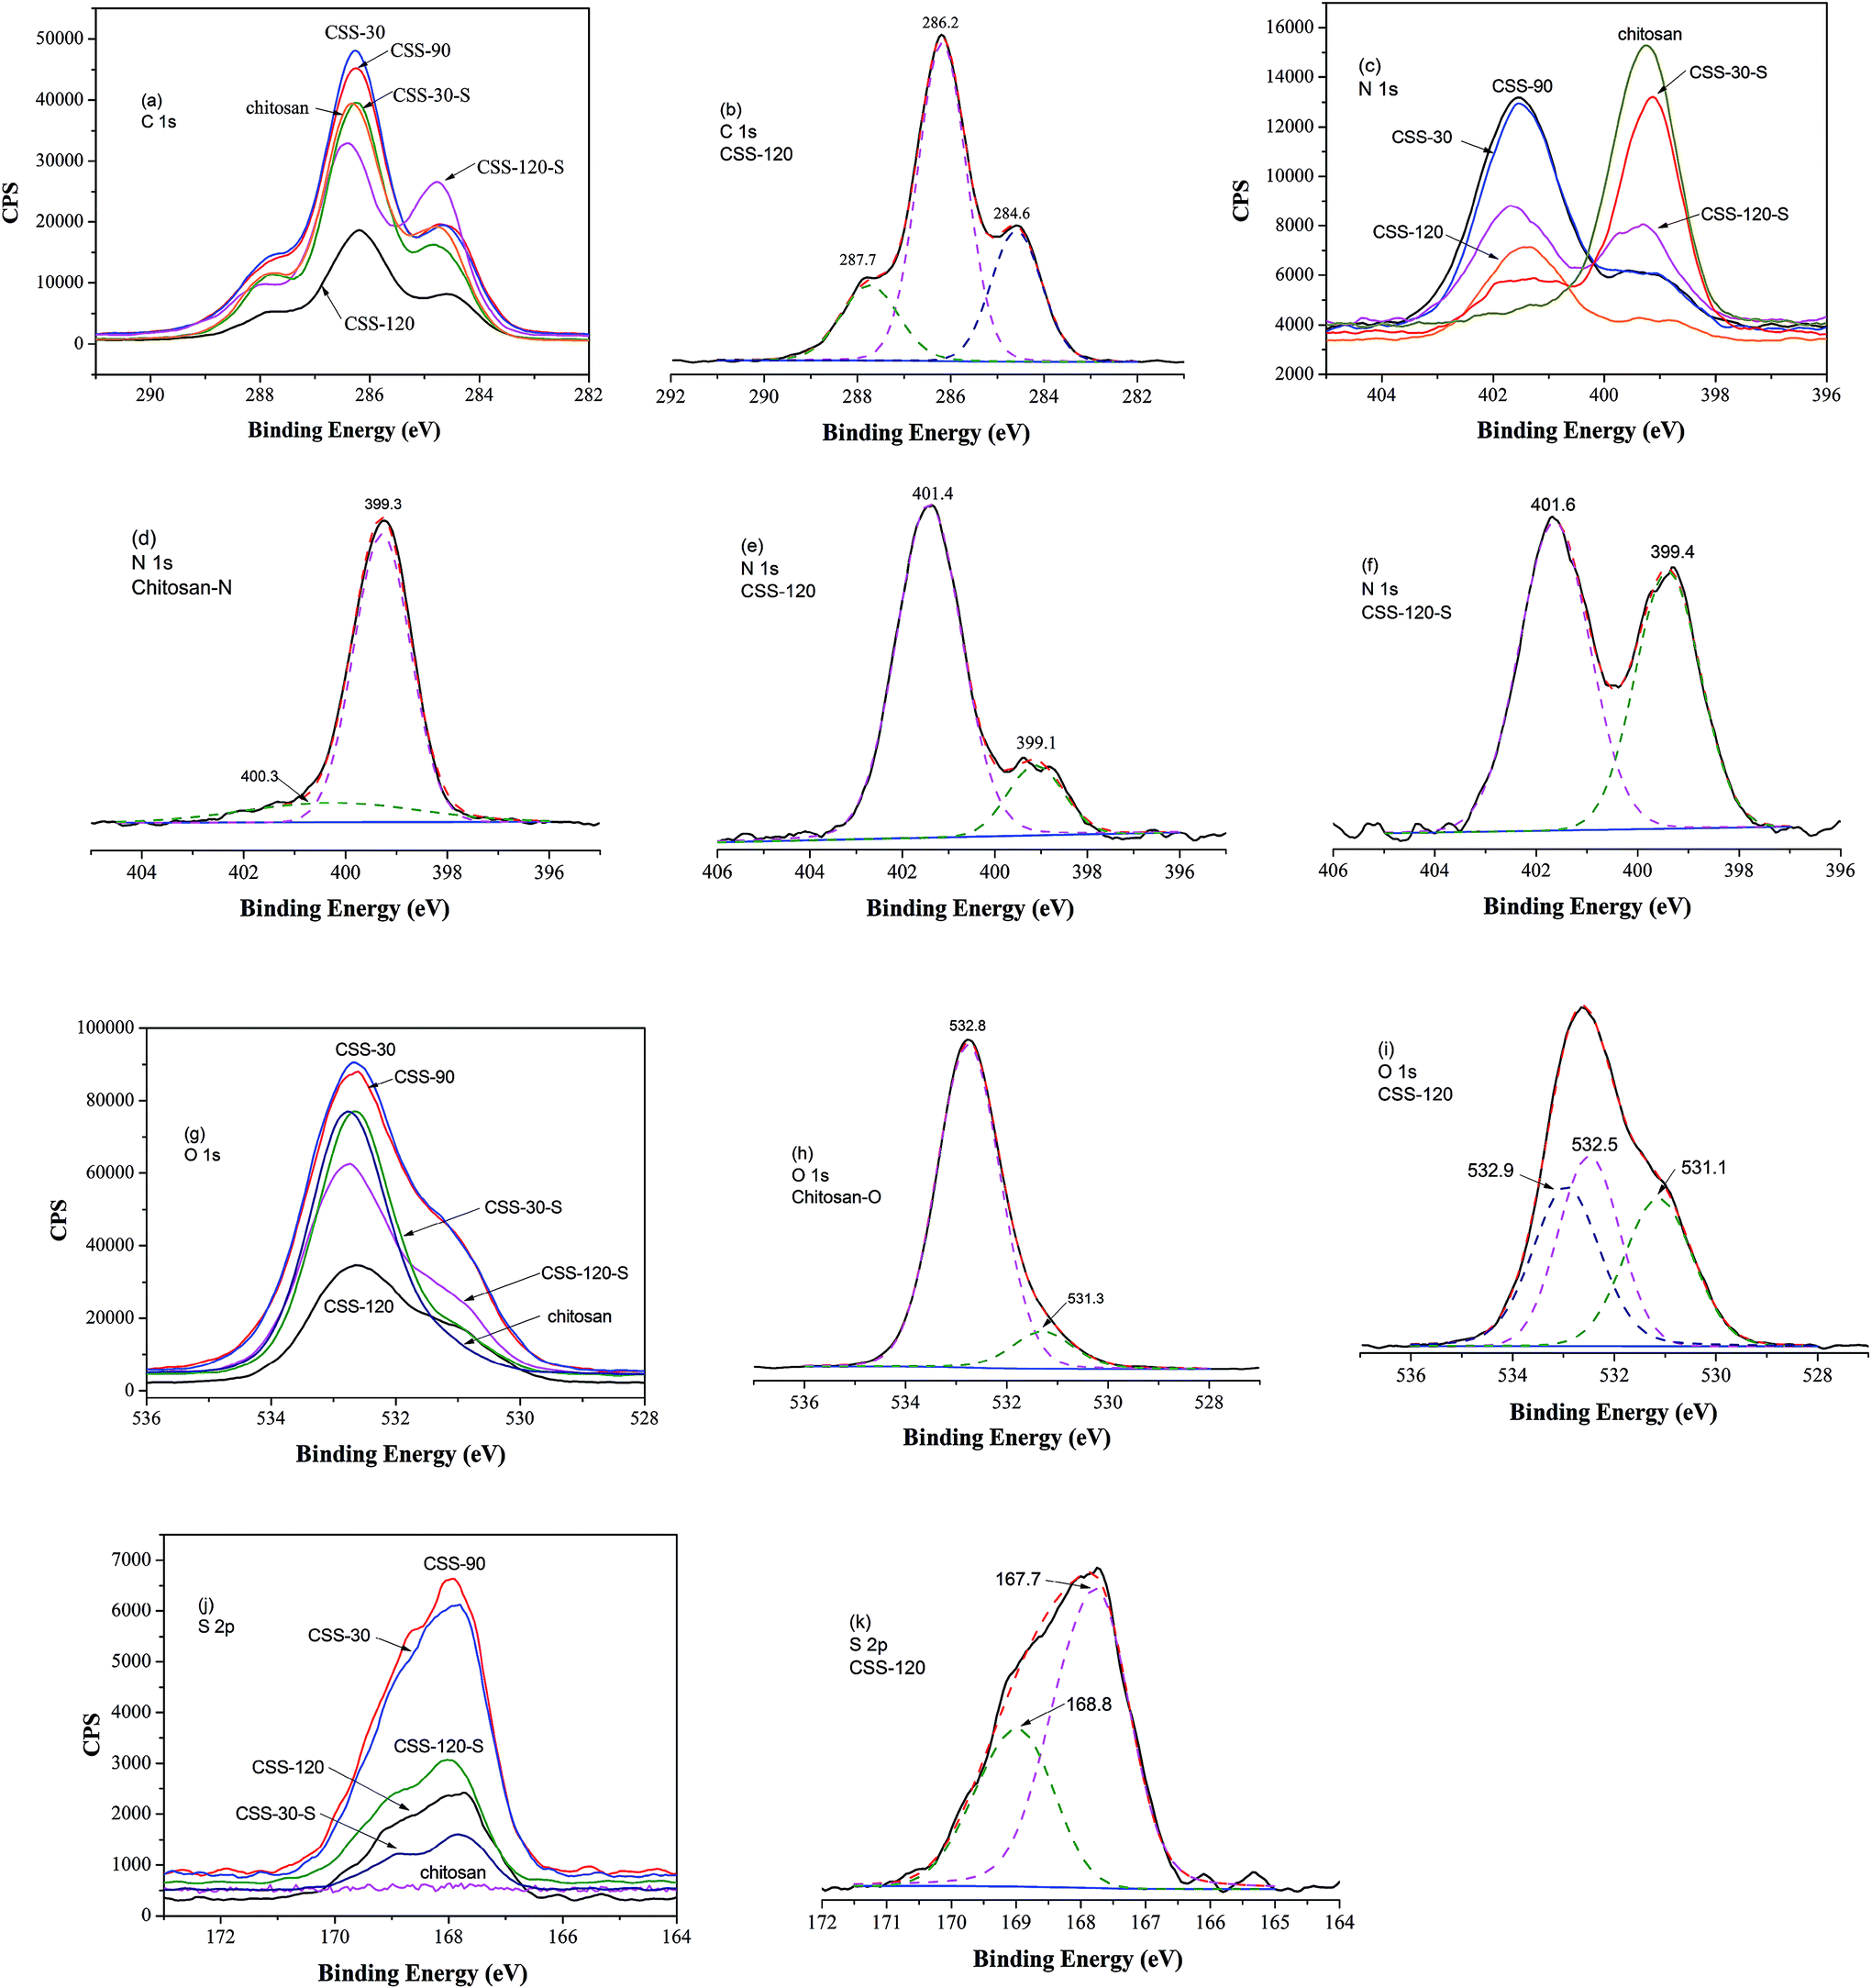 | ||
| Fig. 3 XPS high resolution spectra of C 1s (a), N 1s (c), O 1s (g) and S 2p (j) of chitosan, CSS-30, CSS-90, CSS-120, CSS-30-S and CSS-120-S, respectively. XPS spectra with the curve fit: C 1s of CSS-120 (b); N 1s of chitosan (d), CSS-120 (e) and CSS-120-S (f); O 1s of chitosan (h), CSS-120 (i); and S 2p of CSS-120 (k). | ||
The resolved N 1s spectra of unmodified chitosan and chitosan sulfate-salt are shown in Fig. 3c–f. The significant changes were seen in the N 1s spectra (Fig. 3c). For unmodified chitosan, the amino and amide forms were both present in the N 1s spectra (Fig. 3d): the peak at 399.3 eV was assigned to NH2 chemical bonds, while the peak at 400.3 eV was assigned to the amide groups (the degree of deacetylation of unmodified chitosan is 90%).26 The N 1s peak of the chitosan sulfate salt required two peaks for the curve fit at 399.1 eV (amine) and 401.4 eV (Fig. 3e). The upward shift of the electron binding energy of the peak at 401.4 eV was assigned to the amino groups in the ammonium form (–NH3+).26 This suggested the presence of protonated amines in the form of ammonium salts as expected from ionic binding with the free sulfate anions. The sulfuric salt-forming reaction led to an increased number of nitrogen atoms in the ammonium form and to a decrease of the intensity of the N 1s component centered at 399.1 eV (Fig. 3e). In the chitosan sulfate salts, almost all amine groups were protonated (17 atom% amine; 83 atom% protonated amine). After NaOH treatment, the intensity of the NH2 peak was increased (43 atom% amine) compared to the non-treated chitosan sulfate salt (Fig. 3d), while the intensity of the –NH3+ peak was reduced (57 atom% protonated amine, Fig. 3f).
For the O 1s spectrum, the results of unmodified chitosan and chitosan sulfate-salt were summarized in Fig. 3g–i. Two peaks were identified from the spectra of unmodified chitosan (Fig. 3h) at 531.3 eV (C![[double bond, length as m-dash]](https://www.rsc.org/images/entities/char_e001.gif) O in N-acetylated-glucosamine units) and 532.8 eV (C–O–H). All chitosan sulfate salts (including CSS-S) showed spectra that were different from that of unmodified chitosan. Three peaks were identified in the CSS and CSS-S spectra (Fig. 3i). The peak at 531.1 eV was assigned to the oxygen atoms in the sulfate (SO42−). The peaks at 532.5 eV were assigned to C–O–H in chitosan, while the peak at 532.9 eV was assigned to the O–C–O chemical bonds.27 The decreased intensity of the O 1s peaks of CSS-S (after NaOH treatment) centered at 531.1 eV indicated the release of SO42−, which was in accordance with the N 1s results of XPS and elemental analysis.
O in N-acetylated-glucosamine units) and 532.8 eV (C–O–H). All chitosan sulfate salts (including CSS-S) showed spectra that were different from that of unmodified chitosan. Three peaks were identified in the CSS and CSS-S spectra (Fig. 3i). The peak at 531.1 eV was assigned to the oxygen atoms in the sulfate (SO42−). The peaks at 532.5 eV were assigned to C–O–H in chitosan, while the peak at 532.9 eV was assigned to the O–C–O chemical bonds.27 The decreased intensity of the O 1s peaks of CSS-S (after NaOH treatment) centered at 531.1 eV indicated the release of SO42−, which was in accordance with the N 1s results of XPS and elemental analysis.
The results of S 2p spectra are summarized in Fig. 3j. As shown, the electron binding energy of S 2p peak of CSS-S was not affected by the NaOH treatment. The S 2p3/2 and S 2p1/2 peaks from chitosan sulfate-salt samples (including CSS-S) were located at 167.7 and 168.8 eV, respectively (Fig. 3k). Therefore, sulfates and bisulfates show no significant difference in the S 2p region.28
Although the structure, properties and mechanism of sulfuric acid-crosslinked chitosan had been investigated by XRD, FTIR and NMR spectroscopy, little information was available about the details of the chitosan sulfate salts' morphology. It was observed that the chitosan sulfate microspheres had novel morphologies under treatment with microwave heating and H2SO4. Moreover, the morphological and size changes of the chitosan sulfate microspheres could also be observed with changes in the synthesis time and microwave heating temperature and the H2SO4 concentration.
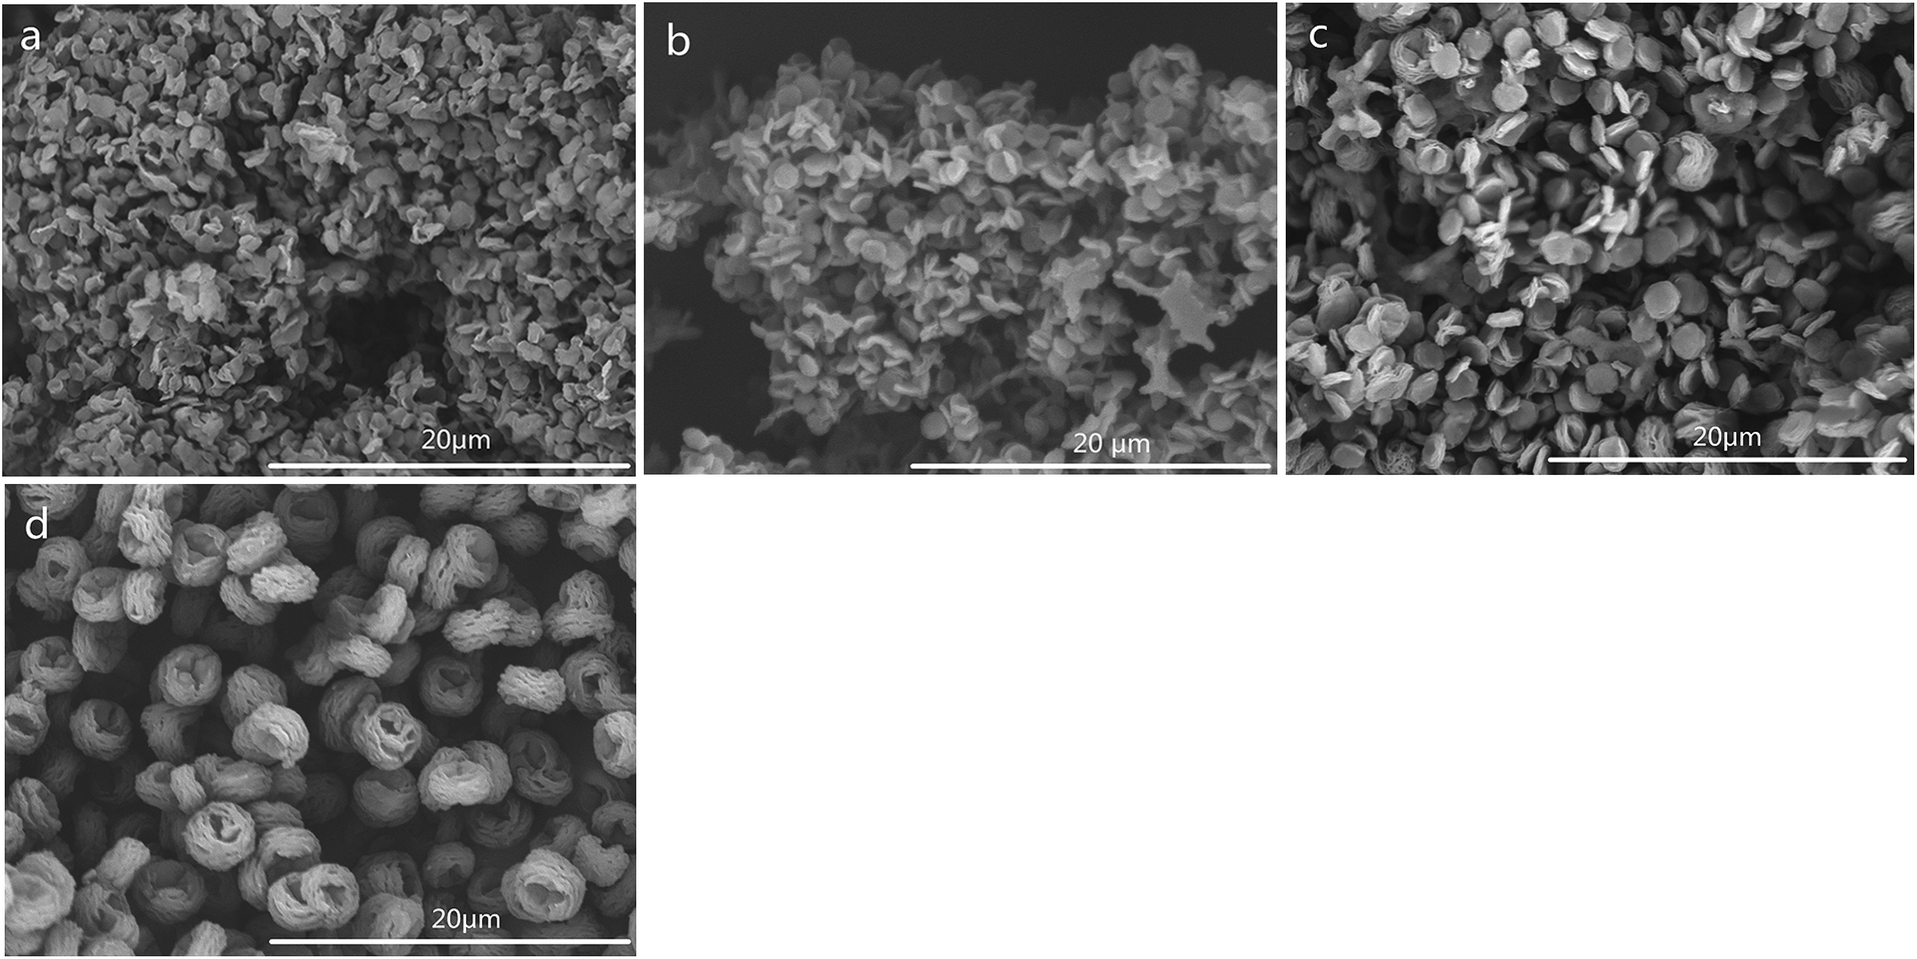
The SEM images of CSS prepared under different concentrations of the H2SO4 solution are shown in Fig. 4. The SEM images of unmodified chitosan exhibited a nonporous, flat large membranous phase with sharp edges (Fig. 4f). All CSS morphologies were different from that of unmodified chitosan. It could be seen that the H2SO4 concentration had a strong impact on the CSS morphology. When the H2SO4 concentration was low (0.4–0.6 mol L−1), the CSS morphology changed to aggregational bowl-shaped with poor dispersion (Fig. 4a and b). When the concentration was 1.2 mol L−1, the CSS morphology changed to multilayer microspheres with oblate and hollow shape with the diameter of ∼2.0 μm and uniform dispersion (Fig. 4c). The globular CSS changed to flaky CSS with the diameter of ∼1.4 μm (Fig. 4d) for the H2SO4 concentration of 1.6 mol L−1. When the H2SO4 concentration was 2.4 mol L−1, CSS change to an irregular and porous shape (Fig. 4e). The yield of CSS also decreased with increasing sulfuric acid concentration. This could be due to the inhibition of residual SO42− in the solution in the ionic crosslinking reaction, in addition to the carbonization of H2SO4 at high concentration.
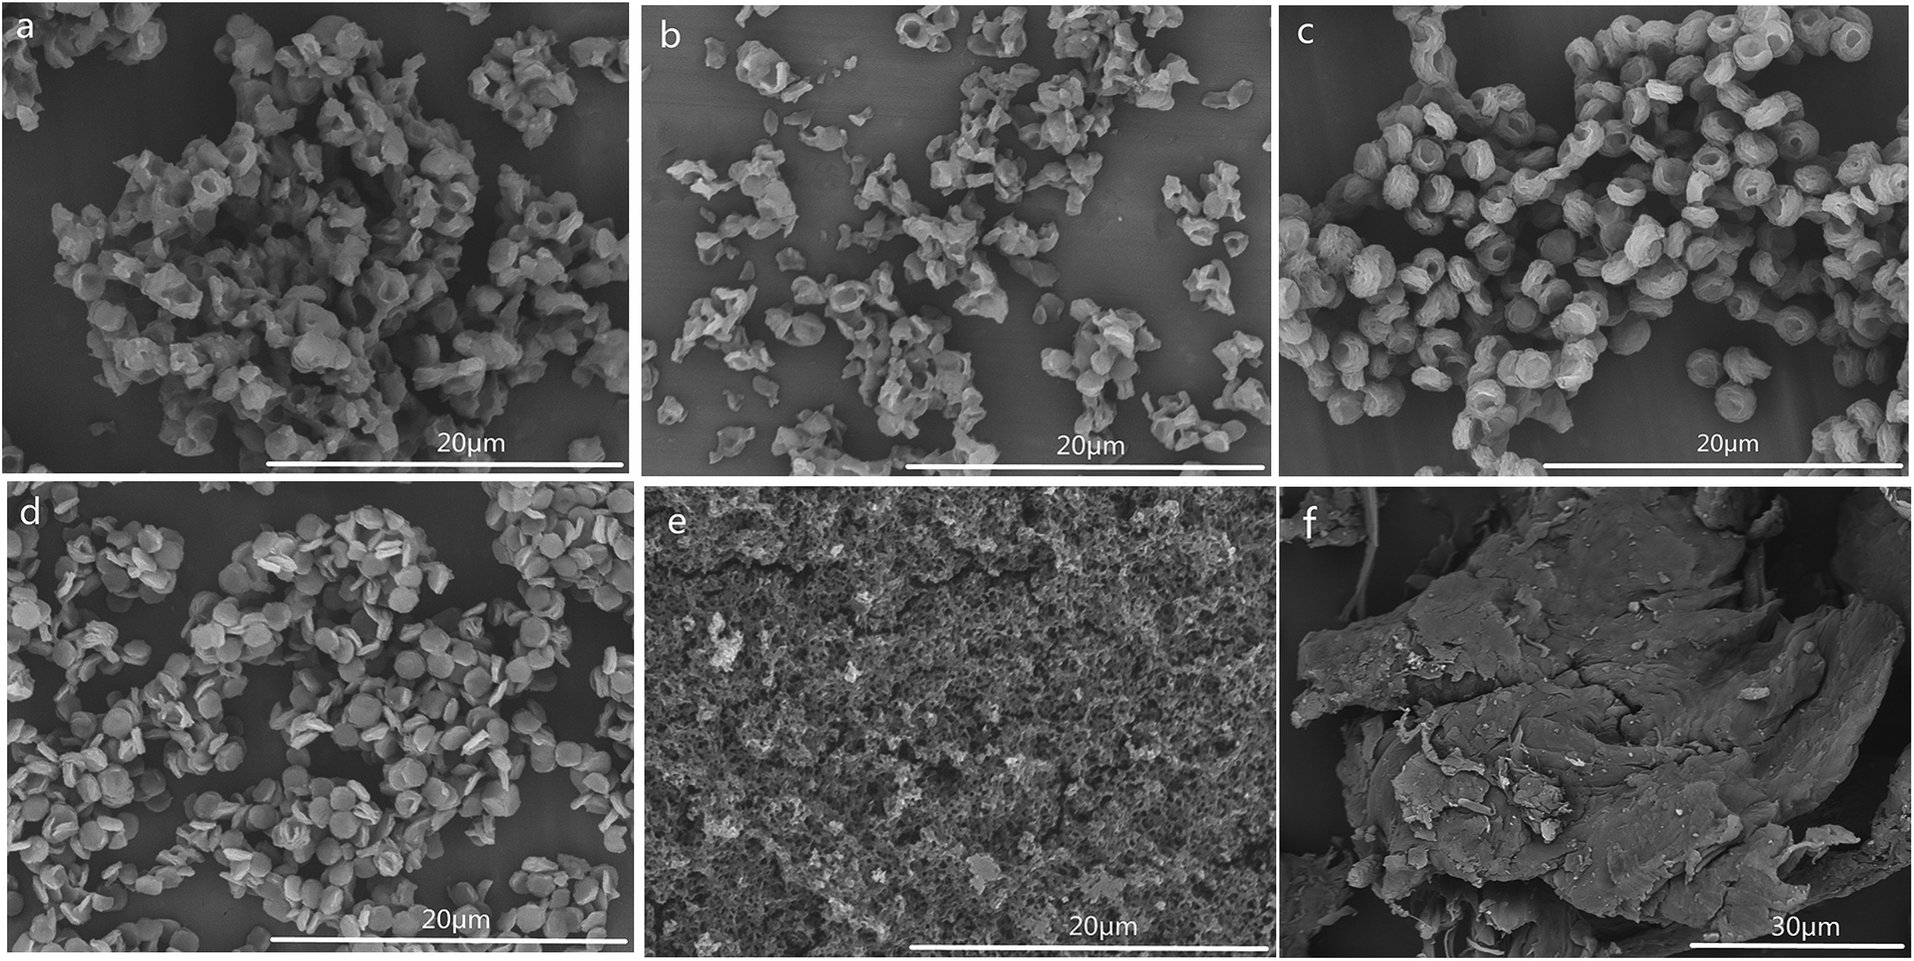 | ||
| Fig. 4 SEM images of CSS prepared with different concentrations of H2SO4 solution (sample a, b, c, d and e were prepared in 0.4, 0.6, 1.2, 1.6 and 2.4 mol L−1 H2SO4 solution at 90 °C for 30 min and f was unmodified chitosan). | ||
The SEM images of CSS prepared at different temperatures of microwave-assisted heating are shown in Fig. 5. It could be seen that the CSS morphology was also strongly influenced by the microwave-assisted heating temperature. The morphologies of the products prepared at 70–85 °C were almost similar (Fig. 5a–c) to each other and were different from that of unmodified chitosan. All samples showed rough and continuous surface morphologies with many granules. The product at 90 °C became multilayer microspheres with oblate and hollow shape (Fig. 4c). When the temperature was raised to 95 °C, the shape changed from oblate to flaky (Fig. 5d). Moreover, the diameter was decreased from 2.0 μm (90 °C) to 1.12 μm, and the thickness changed from 0.96 μm (90 °C) to 0.19 μm.
 | ||
| Fig. 5 SEM images of CSS prepared at different temperatures of microwave-assisted heating (sample a, b, c and d were prepared at 70 °C, 80 °C, 85 °C and 95 °C under 1.2 mol L−1 H2SO4 for 30 min). | ||
The SEM images of CSS prepared for different time of microwave-assisted heating are shown in Fig. 6. With the extension of the time of microwave-assisted heating, CSS morphology gradually changed from small attached pieces to scattered multilayer microspheres with oblate and hollow shape, flakes, and larger fluffy balls. According to the change of morphology with the increase of heating time, it was proposed that the large block of native chitosan was first split into tight small attached pieces and further into a tight single-layer microspheres with oblate shape under the thermal and non-thermal effect of microwave and the salification of sulfuric acid. The tight single-layer microspheres with oblate shape was finally laminated into flakes and further larger fluffy balls.
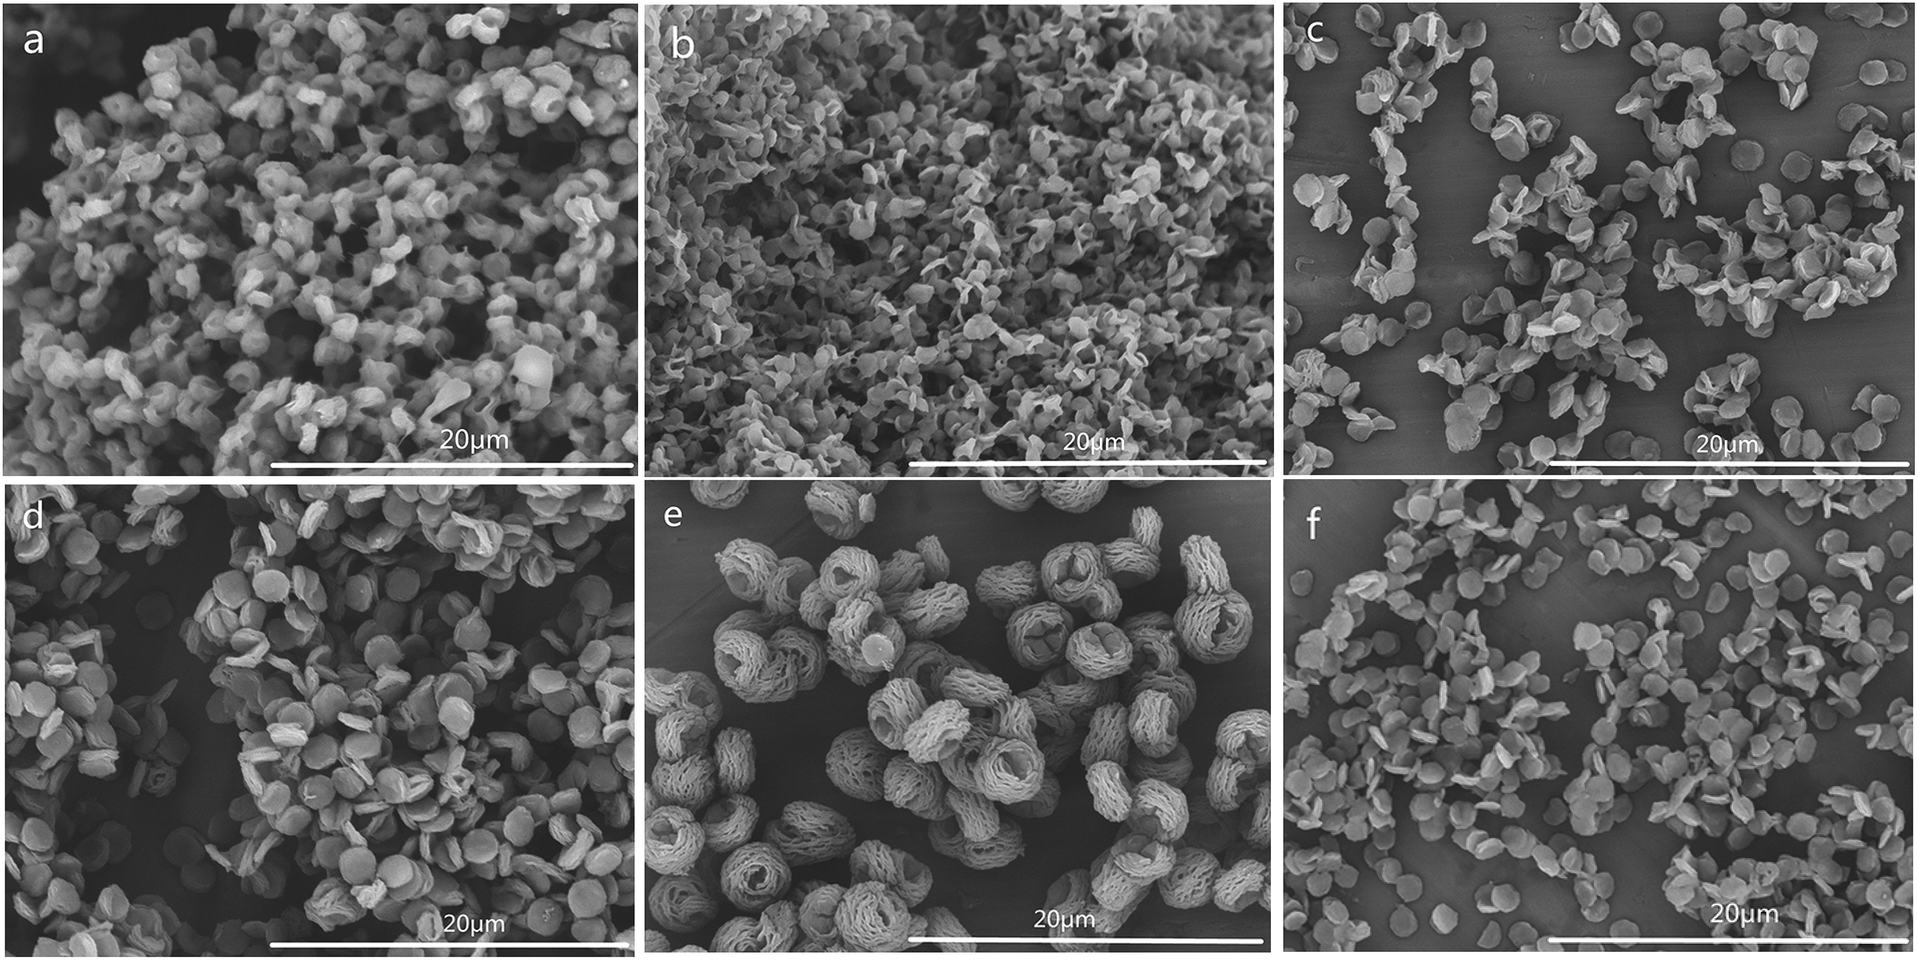 | ||
| Fig. 6 SEM images of CSS prepared using different time under microwave heating (sample a, b, c, d and e were prepared for 8 min, 15 min, 60 min, 90 min and 120 min, at 90 °C under 1.2 mol L−1 H2SO4, and f was prepared in oil bath for 30 min at 90 °C under 1.2 mol L−1 H2SO4). | ||
In order to illustrate the influence of microwave-heating, the SEM image of CSS-30-oil was also investigated (Fig. 6f). The morphology of CSS-30-oil showed a tight single-layer microspheres with oblate shape, while the CSS-30 exhibited an incompact and fluffy multilayer microsphere with hollow shape (Fig. 4c). This difference of morphology between CSS-30-oil and CSS-30 might be caused by the non-thermal effect. The CSS under conventional heating (oil bath) with larger fluffy ball morphology (similar to Fig. 6e) must react for at least 9 h, which is much longer than those under the more effective microwave heating.
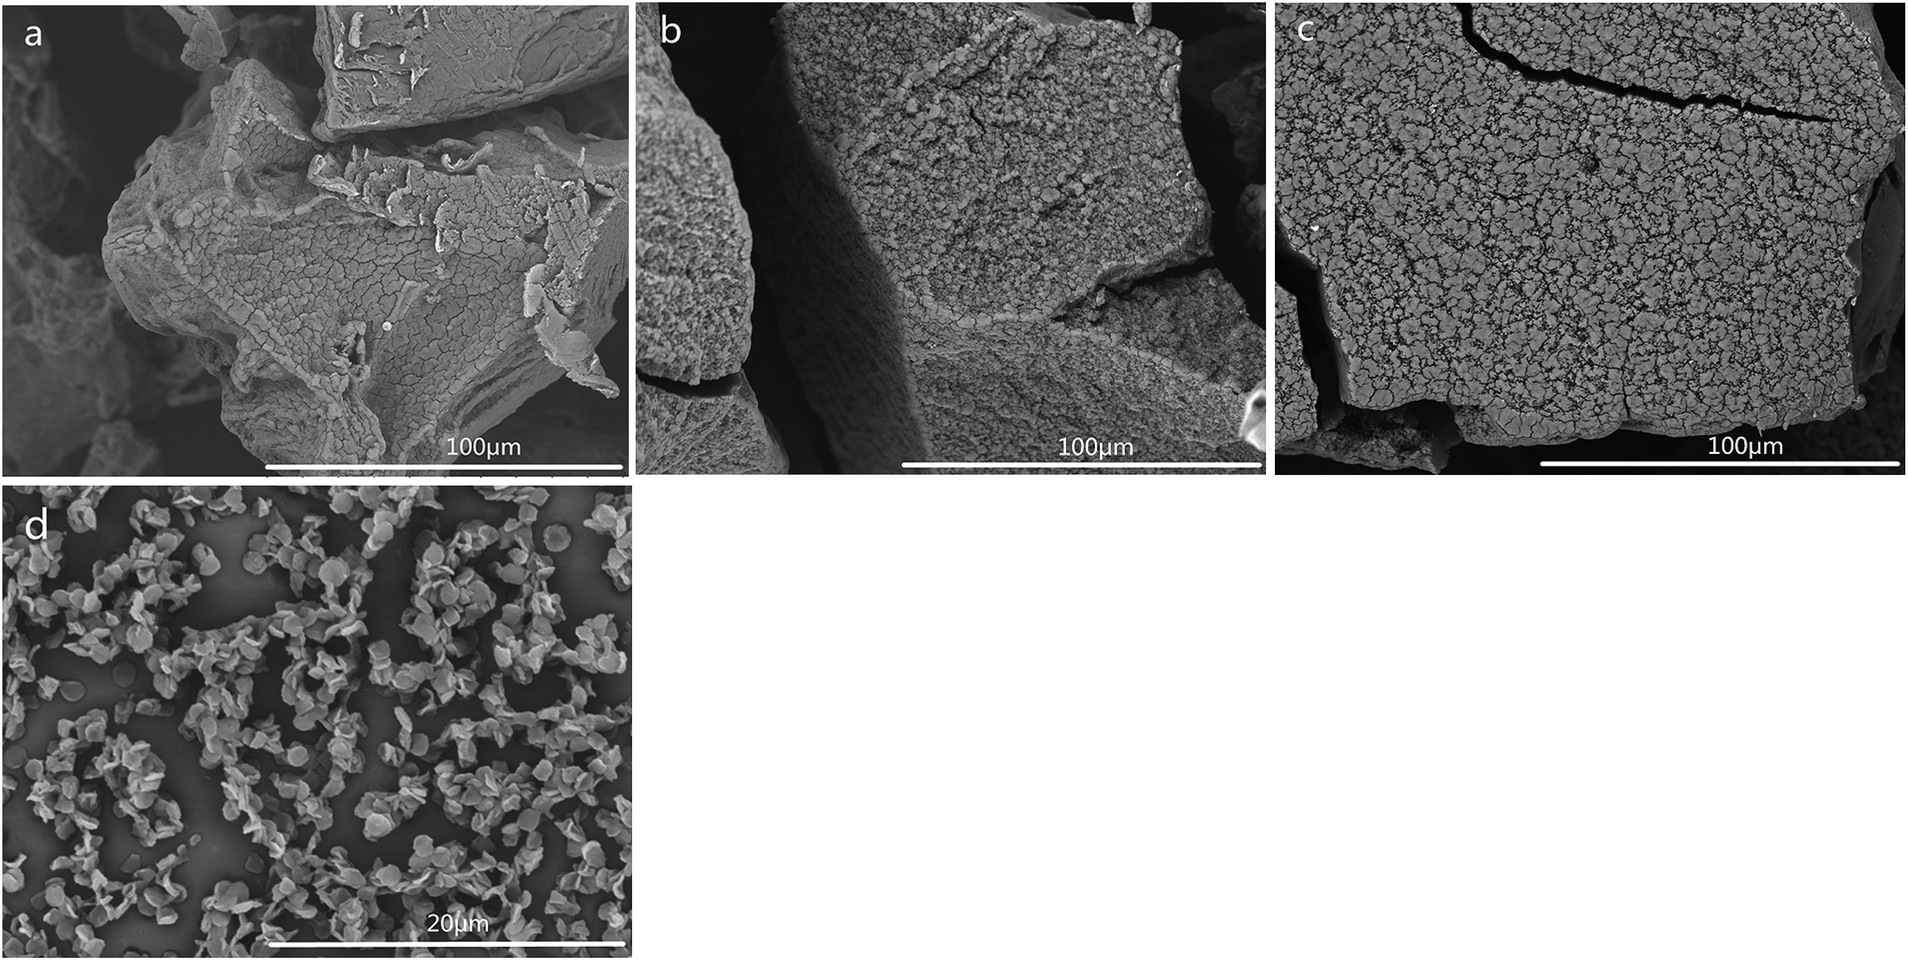
SEM images of samples CSS-30-S, CSS-60-S, CSS-90-S and CSS-120-S were also examined (Fig. 7). The results showed that sample CSS-30-S, CSS-60-S and CSS-90-S all showed an adhesive flaky disc shape with a less explicit outline (Fig. 7a–c). Although the outlines of the multilayer were dimmed out, samples CSS-120-S preserved the oblate and hollow shape (Fig. 7d). This meant that the treatment of NaOH had less indicated that the CSS microspheres prepared under microwave-heating were sufficiently stable. The CSS-120 and CSS-120-S microspheres also showed good thermal stability (Fig. S2 in ESI†).
 | ||
| Fig. 7 SEM images of CSS-30-S, CSS-60-S, CSS-90-S and CSS-120-S. | ||
Adsorption of Cr(VI)
All CSS samples have been used as adsorbent for the removal of hexavalent chromium (Cr(VI)) from aqueous solutions. The time-dependent behavior of Cr(VI) uptake adsorption was measured by varying the equilibrium contact time in the range of 1–15 min (Fig. 8). The Cr(VI) concentration was kept at 100 mg L−1, while the amounts of CSS-30, CSS-60, CSS-90 and CSS-120 were all 0.20 g L−1. It was noticed that the adsorption of all CSS samples can reach equilibrium after 9 min. This indicated that the adsorption of Cr(VI) was a rapid process for all CSS samples. It was observed that all CSS samples exhibited a high adsorption capacity. The adsorption capacity for Cr(VI) was found to be 112, 96, 97 and 101 mg g−1 for CSS-30, CSS-60, CSS-90 and CSS-120 (Fig. 8), respectively. CSS-30 exhibited the highest adsorption capacity for Cr(VI) in all treated chitosan sulfate salt microspheres.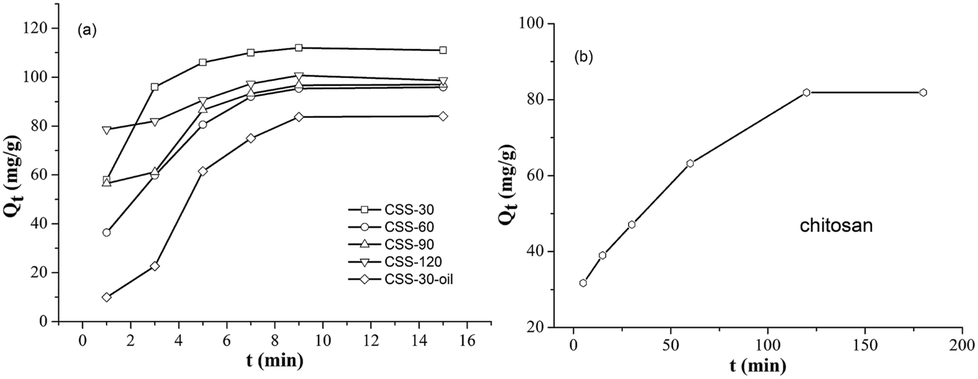 | ||
| Fig. 8 Effect of time on adsorption of Cr(VI) for different adsorbents. | ||
In order to investigate the influence of salification and microwave-heating, the adsorption capacities of Cr(VI) on the unmodified chitosan and CSS-30-oil were also investigated (Fig. 8b and a). It was noticed that the adsorption of Cr(VI) by the untreated chitosan was a slow process and reached adsorption equilibrium after 120 min. The unmodified chitosan exhibited lower adsorption capacity on Cr(VI) than all CSS samples (including CSS-30-oil) even after 120 min. The adsorption of Cr(VI) on CSS-30-oil sample was lower than all the CSS samples treated by microwave. The adsorption of CSS-30-oil also reached equilibrium after 9 min.
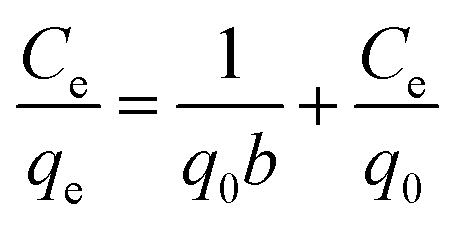
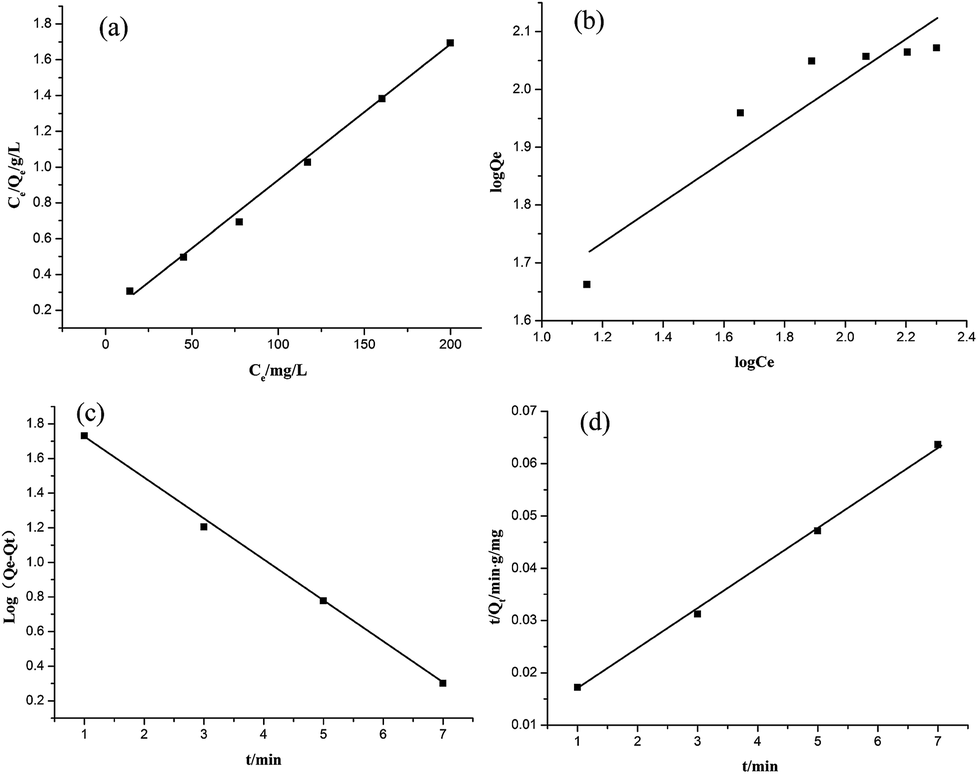
The equilibrium adsorption data of Cr(VI) ion on CSS-30 was further evaluated and used in the Langmuir and Freundlich isotherm equations (Fig. 9). As shown in Fig. 9, the amount of saturated chromium adsorption increased with increasing initial chromium concentration. For instance, the amount of chromium adsorbed at equilibrium (qe) increased from 46 to 118 mg g−1 when the chromium concentration increased from 20 to 220 mg L−1. The Langmuir isotherm is a widely used monolayer adsorption model.29 The use of the linearized Langmuir isotherm allowed the calculation of adsorption capacities and the Langmuir constant according to the following equation:
 | (2) |
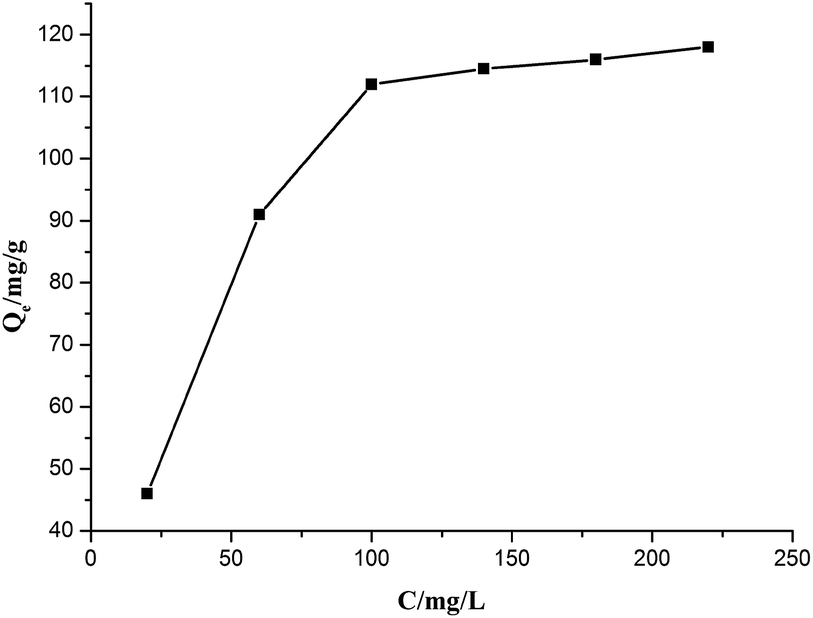 | ||
| Fig. 9 Effect of initial concentration of Cr(VI) on adsorption. | ||
 | ||
| Fig. 10 Comparison of experimental and calculated kinetic profiles using several kinetic models. (a) Langmuir adsorption isotherm, (b) Freundlich adsorption isotherm, (c) pseudo-first-order kinetics, (d) pseudo-second-order kinetics. | ||
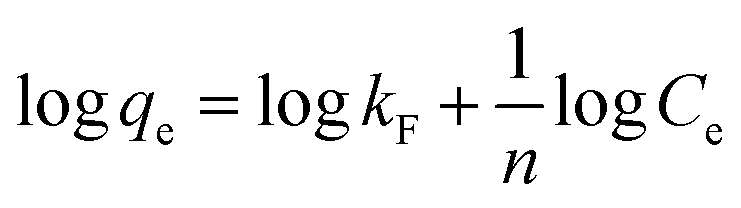
The linearized form of the Freundlich isotherm30 fused or studying the adsorption from aqueous solutions is given as
 | (3) |
qe against logCe gave the constants kF and n as 20.73 mg g−1 L−1 and 2.84, respectively, with the correlation coefficient of 0.848 (Fig. 10b). By comparing the correlation coefficients, it was found that the Langmuir model is superior to the Freundlich model in describing the adsorption behaviors of Cr(VI) ions on CSS-30.
To evaluate the adsorption kinetics of the Cr(VI) ions on CSS-30, the pseudo-first-order and pseudo-second-order models were both applied to the experimental data. The equation of pseudo-first-order kinetics31 is given by:
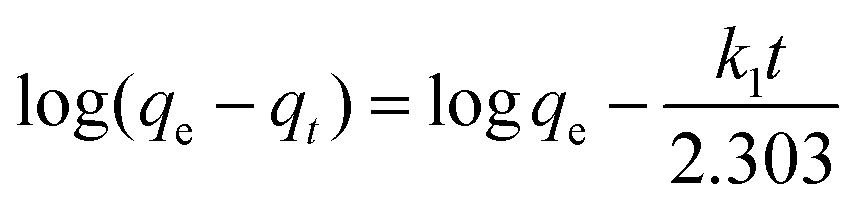 | (4) |
The equation of pseudo-second-order kinetics32 is given as:
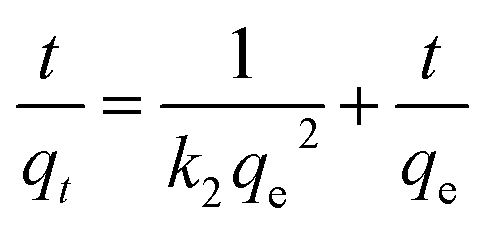 | (5) |
In summary, the Cr(VI) adsorption systems studied belongs to the pseudo-second-order kinetic model and is well represented by the Langmuir isotherm.
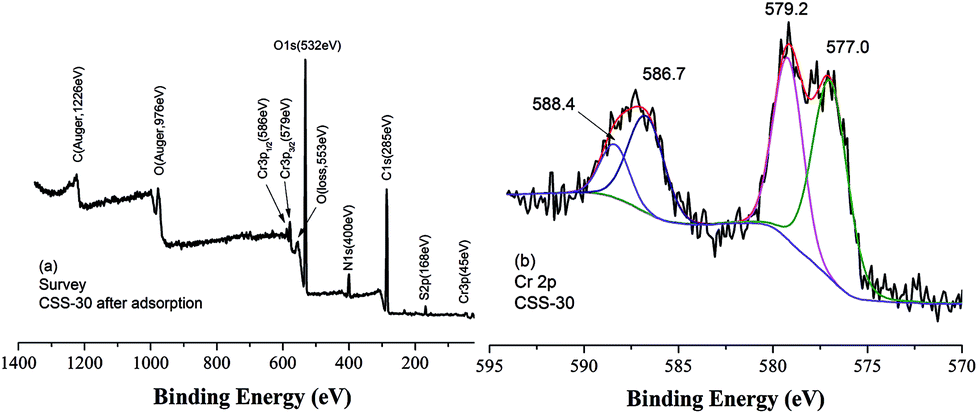
It was reported that chromate ion was always partly reduced in solution in the presence of chitosan-derived adsorbents.33,34 The XPS spectra of CSS-30 after adsorption of Cr(VI) was also determined to investigate the adsorption mechanism (Fig. 11). The survey spectrum confirmed the presence of Cr, which appeared at BEs of 579 and 586 eV (Fig. 11a). The deconvolution XPS spectrum showed four peaks. The Cr(VI) 2p3/2 and Cr(VI) 2p1/2 peaks were located at 579.2 and 588.4 eV (ref. 33) (Fig. 11b), respectively. The peaks at 577.0 and 586.7 eV can be attributed to Cr(III) 2p3/2 and Cr(III) 2p1/2 peaks, respectively. This indicated that the chromate Cr(VI) ions were partially transferred to Cr(III) by chemical reduction of CSS-30 during the adsorption.
 | ||
| Fig. 11 The XPS spectra of CSS-30 after adsorption of Cr(VI). | ||
The stability and reusability of CSS microspheres were also tested via the repeated adsorption of Cr(VI). The CSS-30 after adsorption was first regenerated by H2SO4. The morphology of CSS-30 regenerated by H2SO4 (Fig. 12a) didn't show significant change as compared with the native CSS-30 (Fig. 4c). The characteristic peak of Cr element was not found in the XPS survey spectrum of the regenerated CSS-30 (Fig. 12b). The XRD pattern of the regenerated CSS-30 showed an increase of the crystalline domain as compared with that of CSS-30 (Fig. 12c). All the data indicated that the CSS-30 could be regenerated by H2SO4 aqueous solution. The adsorption capacity of Cr(VI) on the regenerated CSS-30 showed a slight decrease after reusing and was found to be 97.0 mg g−1. The results indicated that CSS-30 was a stable adsorbent for Cr(VI) and can be used in the practical adsorption process.
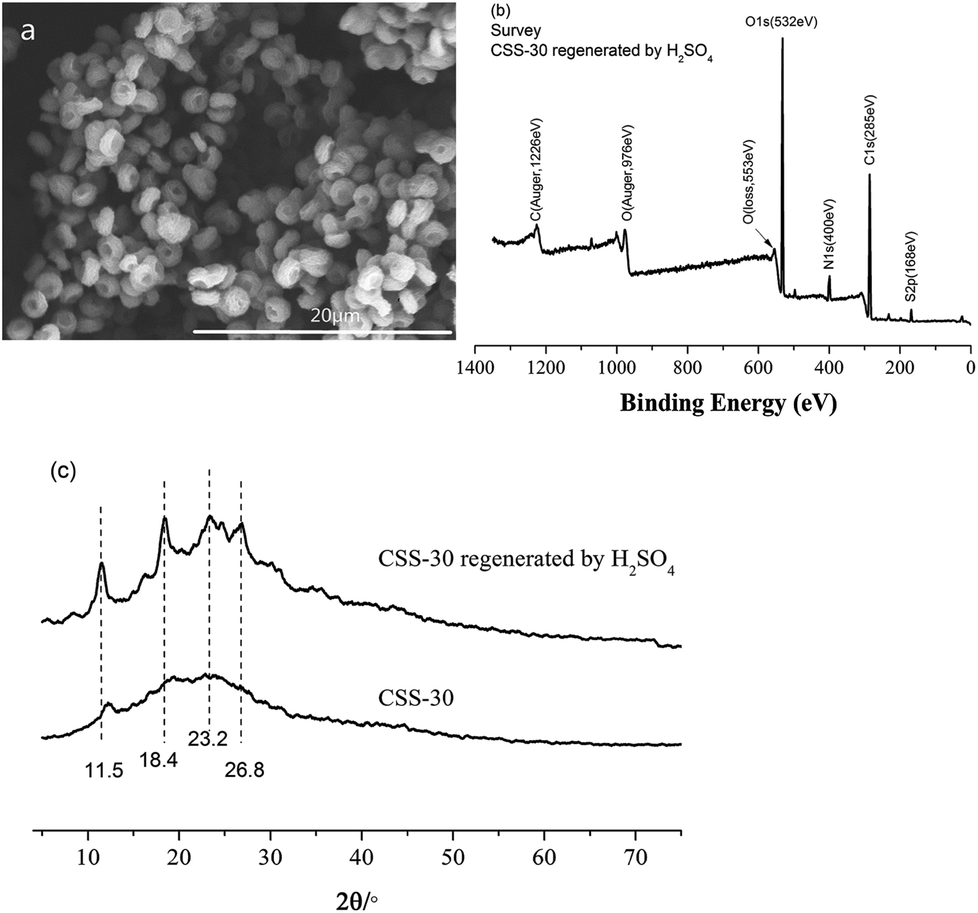 | ||
| Fig. 12 The characterization of CSS-30 regenerated by H2SO4. (a) SEM, (b) XPS, (c) XRD. | ||
Conclusions
Novel multilayer chitosan sulfate microspheres with uniform shape and size were prepared by the microwave-assisted method using chitosan and sulfuric acid as reagents. The results of this study demonstrate that the properties of chitosan sulfate microspheres including morphology, size, and size distribution can be effectively controlled by the H2SO4 concentration, and microwave heating temperature and time. Moreover, the prepared CSS showed a high stability in the presence of NaOH. The adsorption capacity of CSS-30, CSS-60, CSS-90 and CSS-120 on Cr(VI) ion were investigated. All of the chitosan sulfate exhibited high adsorption capacities, indicating that they can be used for the removal of Cr(VI) ions. And the CSS-30 is the best one. The adsorption kinetics of CSS-30 followed a pseudo-second-order equation, and the Langmuir isotherm model fit the experimental adsorption data well. The study on adsorption mechanism and regeneration indicated that CSS-30 was a stable adsorbent for Cr(VI) and can be used in the practical adsorption process.Conflicts of interest
There are no conflicts to declare.Acknowledgements
This work was supported by the Fundamental Research Funds for the Central Universities (No. 2232013A3-05) and the National Science and Technology Ministry (ID 2012BAK30B03).References
- G. Yang, L. Tang and X. Lei, et al., Appl. Surf. Sci., 2014, 292, 710 CrossRef CAS.
- F. Croisier and C. Jerome, Eur. Polym. J., 2013, 49, 780 CrossRef CAS.
- G. Yang, L. Tang and G. Zeng, et al., Chem. Eng. J., 2015, 259, 854 CrossRef CAS.
- M. M. A. Al-Remawi, Am. J. Appl. Sci., 2012, 9, 1091 CrossRef CAS.
- R. Hejazi and M. Amiji, Pharm. Dev. Technol., 2003, 8, 253 CrossRef CAS PubMed.
- S. Ozbas-Turan, J. Akbuga and C. Aral, J. Pharm. Sci., 2002, 91, 1245 CrossRef CAS PubMed.
- K. Saita, S. Nagaoka and M. Horikawa, J. Biomater. Nanobiotechnol., 2011, 2, 347 CrossRef CAS.
- Z. Cui, Y. Xiang and J. Si, Carbohydr. Polym., 2008, 73, 111 CrossRef CAS.
- E. Szymańska and K. Winnicka, Mar. Drugs, 2015, 13, 1819 CrossRef PubMed.
- S. Fuentes, J. Retuert and G. Gonzalez, J. Chil. Chem. Soc., 2008, 53, 1511 CAS.
- M. M. Mecwan, G. E. Rapalo and S. R. Mishra, J. Biomed. Mater. Res., Part A, 2011, 97, 66 CrossRef PubMed.
- A. Sahu, P. Goswami and U. Bora, J. Mater. Sci.: Mater. Med., 2009, 20, 171 CrossRef CAS PubMed.
- I. G. Beskardes, T. T. Demirtas and M. D. Durukan, J. Tissue Eng. Regener. Med., 2015, 9, 1233 CrossRef CAS PubMed.
- S. G. Kumbar, A. R. Kulkarni and M. Aminabhavi, J. Microencapsulation, 2002, 19, 173–180 CrossRef CAS PubMed.
- N. Kotsaeng, J. Karnchanajindanun and Y. Baimark, Part. Sci. Technol., 2010, 28, 369 CrossRef CAS.
- H. M. Li, M. Z. Wang and L. Y. Song, Colloid Polym. Sci., 2008, 286, 819 CAS.
- V. J. Mendham, R. C. Denny and J. D. Barnes, Vogel's Textbook of Quantitative Chemical Analysis, Pearson Education, Singapore, 6th edn, 2002 Search PubMed.
- R. J. Samuels, J. Polym. Sci., Part B: Polym. Phys., 1981, 19, 1081 CrossRef CAS.
- K. Ogawa and S. Inukai, Carbohydr. Res., 1987, 160, 425–433 CrossRef CAS.
- G. Dhanuja, B. Smitha and S. Sridhar, Sep. Purif. Technol., 2005, 44, 130 CrossRef CAS.
- H. Saito, R. Tabeta and K. Ogawa, Macromolecules, 1987, 20, 2424 CrossRef CAS.
- B. Focher, A. Naggi and G. Torri, Carbohydr. Polym., 1992, 18, 43 CrossRef CAS.
- J. Ge, Y. F. Cui and Y. Yan, J. Membr. Sci., 2000, 165, 75 CrossRef CAS.
- P. Mukoma, B. R. Jooste and H. C. M. Vosloo, J. Power Sources, 2004, 136, 16 CrossRef CAS.
- J. C. Vickerman and I. S. Gilmore, Surface analysis-The principal techniques, ed. Ratner B. D. and Castner D. G., Wiley, Chichester, (2nd edn), 2009, ch. 3, pp. 47–112 Search PubMed.
- B. Lindberg, R. Maripuu and K. Siegbahn, J. Colloid Interface Sci., 1983, 95, 308 CrossRef CAS.
- I. F. Amaral, P. L. Granja and M. A. Barbosa, J. Biomater. Sci., Polym. Ed., 2005, 16, 1575 CrossRef CAS PubMed.
- A. A. Audi and P. M. A. Sherwood, Surf. Interface Anal., 2000, 29, 265 CrossRef CAS.
- I. Langmuir, J. Am. Chem. Soc., 1918, 40, 1361 CrossRef CAS.
- H. M. F. Freundlich, Z. Phys. Chem., 1906, 57, 385 CAS.
- S. Lagergren, K. Sven. Vetenskapsakad. Handl., 1898, 24, 1 Search PubMed.
- Y. S. Ho and G. A. Mckay, Adsorpt. Sci. Technol., 1999, 17, 233 CrossRef CAS.
- L. Dambies, C. Guimon and S. Yiacoumi, Colloids Surf., A, 2001, 177, 203 CrossRef CAS.
- S. Bosinco, E. Guibal and J. Roussy, Miner. Process. Extr. Metall. Rev., 1998, 19, 277 CrossRef CAS.
Footnote |
| † Electronic supplementary information (ESI) available. See DOI: 10.1039/c7ra09867g |
| This journal is © The Royal Society of Chemistry 2017 |