
 Open Access Article
 This Open Access Article is licensed under a
 Creative Commons Attribution 3.0 Unported Licence
Comparison of the photocatalytic efficiencies of continuous stirred tank reactor (CSTR) and batch systems using a dispersed micron sized photocatalyst†
Enrico Colombo and
Muthupandian Ashokkumar *
*
School of Chemistry, University of Melbourne, VIC 3010, Australia. E-mail: masho@unimelb.edu.au
First published on 13th October 2017
Abstract
Photocatalysis is an advanced oxidation process which can be used for water purification. Studies on Plug Flow Reactor (PFR) and Continuous Stirred Tank Reactor (CSTR) systems are imperative if photocatalysis is to be used in large-scale applications. Between them, the CSTR system is an obvious choice for studies, because a series of CSTRs is equivalent to a PFR. However, a CSTR often imposes the use of fixed-bed reactors, which dramatically reduces the efficiency of the process. In this work, a dispersed photocatalyst system was combined with CSTR in order to develop an efficient system for continuous operation. We have overcome the problems of filter blockage, the need for premixing and catalyst retrieval at the end of the reaction using micron-sized photocatalyst powder and short sonication time carried out every 30 minutes. Two model pollutants (metanil yellow and rhodamine B) were used for the degradation studies. Variables such as flow-rate, pollutant, and catalyst concentration were also investigated to evaluate the CSTR performance. The results showed that the CSTR system could lead to an increase in degradation of up to 110%, compared to a batch system, and to a continuous operation longer than 42 h without filter blockage or deactivation of the catalyst.
1 Introduction
Water purification is a problem all around the world. Every year, authorities introduce new standards on the amount of pollutants that can be released into the environment, and new compounds are continuously being added to the list of toxic waste materials.1 Also, the production of highly complex organic molecules (i.e., dyes, drugs, etc.) is increasing every year, and improvements in the existing water treatment techniques, such as advanced oxidation processes, are necessary. One of the most promising advanced oxidation processes is photocatalysis. The literature shows that this technique can mineralize most of the organic pollutants in aqueous solutions, from aliphatic to aromatic.2 It is generally considered that photocatalysis is an expensive technique, but literature shows that the costs are comparable to that of other techniques (e.g., methods which use activated carbon).3,4 However, real data on the comparison of various processes are scarce due to problems in scaling up of photocatalytic processes.5The efficiency of photocatalysis depends on the way the catalyst is used: as films/fixed beds or dispersed directly in the medium as particulates. Given that the reaction mostly occurs at the catalyst–solution interface, a catalyst dispersed in the medium maximises the adsorption of the pollutants, enhancing the photodegradation.6 However, the removal of the catalyst at the end of the reaction requires techniques like centrifugation or nano-filtration, high energy processes.7 To increase the size of the final particles without losing the benefits associated with small photocatalytic nanoparticles (e.g., surface area), ESI† might be used. Tang et al.8 produced silica nanofibers (20–25 nm thick, and hundreds of nm long) on which TiO2 nanoparticles (8–10 nm) were attached. The results showed an activity higher than commercial P25, due to the effect of silica in promoting the adsorption of rhodamine B. Instead, the use of a fixed catalyst overcomes the problems associated with filtration but decreases the efficiency dramatically, due to a lower surface area and localised adsorption.9 Most studies have used fixed systems for evaluating the performance of catalysts rather than exploring different system configurations.10,11 To improve the efficiency of photocatalytic systems, flow through processes were investigated. These systems are generally closed, and the recirculation is another way in which mixing is introduced, making them halfway between typical batch and continuous flow systems. Shargh et al.12 have used such configuration for the photodegradation of phenazopyridine using a fixed bed TiO2 based catalyst. They observed that the percentage decolorization of a dye increased with an increase in the flow rate. Similar experiments were carried out by Vaianoa et al.13 In this case, a TiO2 based catalyst was dispersed in a solution for the decomposition of organic dyes. However, this configuration incurs the same problem of a batch system, which is that they are not suitable for treating high volumes (as required in industry), therefore continuous-flow systems should be adopted.5
In theory, two extremes of continuous-flow systems are the CSTR and PFR.14 The first describes a system where the flow is perfectly mixed (the concentration inside the reactor is the same throughout the reactor). Instead, in the PFR system, the concentration decreases along the flow direction, without mixing during flow. These two types of reactors are considered extremes. However, when the number of CSTR is infinite, the performance becomes identical to that of the PFR system, where the single CSTR can be described as a section of a PFR.
Miyawaki et al.14 have studied a CSTR system using a fixed bed TiO2 catalyst. In their research, they used 5 CSTRs connected in series to investigate the diffusion of pollutants on the catalyst surface. The catalyst was fixed on a glass surface and placed at the bottom of the reactor while UV lamps were irradiating from the top. This approach avoids the loss of catalyst when the reaction solution moves from reactor to reactor. However, as for the batch system, the blockage of the catalyst onto a surface dramatically reduces the efficiency of the process. Meshram et al.15 have studied a CSTR system using a dispersion of ZnO based photocatalyst. The aim of their study was to investigate the degradation of phenol, by changing variables such as flow rate and initial concentration. The phenol solution was premixed with the catalyst before entering the reactor, and the exiting solution was separated from the photocatalytic particles by centrifugation. They observed that when the flow rate was increased (from 10 to 30 mL min−1), the percentage degradation decreased (from 70 to 50%), claiming that better results were obtainable at lower flow rates due to sufficient adsorption time.15
In this context, a study on alternative ways to optimise photocatalytic degradation of organic pollutant is necessary. Our study was aimed at combining the advantage of dispersed catalyst with a CSTR system in order to develop a continuous operation photocatalytic reactor. We have overcome the filtration problem, utilizing a micron-sized powder photocatalyst and short sonication time carried out every 30 minutes. The catalyst (TiO2), synthesised in our laboratory, possesses a size of around 10 μm and an efficiency equivalent to that of Degussa P25. In contrast to nano-filtration, micro powders require a smaller amount of energy, and it permits to work in low-pressure conditions.16 In this way, the catalyst accumulating on the filter can be readily redispersed applying low-energy methods, such as sonication. In a CSTR system, different variables can be changed to improve the efficiency of the process. At a fixed reactor configuration, the feed concentration and flow rate are the main variables. However, significant improvement could be achieved by changing the reactor configuration. In particular, the number of reactors placed in series, the volume/unit and the total volume utilized can dramatically affect the performance.17 For a CSTR system, the use of a single unit is the less efficient configuration, due to a higher total volume required compared to that of two reactors placed in series (considering the total amount of irradiation constant). However, this work aims to compare the efficiency of the two systems (i.e., batch and continuous flows) without changes in the configuration of the reactor. We achieved a working time of more than 42 hours without opening the reactor and using the same quantity of catalyst, which was loaded into the reactor before starting the experiments. Different variables were tested with two model pollutants: metanil yellow and rhodamine B. A quantitative analysis of achievable degradations was carried out and compared to that of a batch system. Additionally, studies on degradation pathways were conducted and compared with studies reported in the literature.
2 Experimental
2.1 Materials
Rhodamine B (95%), metanil yellow (70%), acetonitrile (HPLC grade ≥ 99.9%), trifluoroacetic acid (TFA) (HPLC grade ≥ 99.9%) were purchased from Sigma-Aldrich Co. LLC (Australia). All the reagents were used without further purification.2.2 Characterisation
Samples were analysed by Shimadzu SCL-10AVP high-performance liquid chromatography (HPLC) equipped with a Restek column model “Ultra AQ C18 5 μm 150 × 4.6 mm” and with an ultraviolet detector (UV) set at 420 and 554 nm. All chromatograms were generated by LabSolution software (Shimadzu). The injection volume was 20 μL and, the flow rate was 1 mL min−1 with water![[thin space (1/6-em)]](https://www.rsc.org/images/entities/char_2009.gif) :acetonitrile (30:70) and 1% TFA as eluent. UV/Vis spectroscopic analyses were performed with a “Cary 50 Bio UV/Vis spectrophotometer” using a quartz cuvette. The total carbon analyses were carried out using a Shimatzu TOC analyser model TOC-V equipped with an ASI-V automatic sample injector. The MS analyses were performed using an Agilent 6500 Q-TOF LC/MS system in positive and negative ion mode.
:acetonitrile (30:70) and 1% TFA as eluent. UV/Vis spectroscopic analyses were performed with a “Cary 50 Bio UV/Vis spectrophotometer” using a quartz cuvette. The total carbon analyses were carried out using a Shimatzu TOC analyser model TOC-V equipped with an ASI-V automatic sample injector. The MS analyses were performed using an Agilent 6500 Q-TOF LC/MS system in positive and negative ion mode.
2.3 Photocatalytic activity measurements
2.3.1.1 Routine experiments. Routine studies varying the concentration of dye were performed. RB and MY were chosen as model pollutants to evaluate the adsorption effect on the photocatalytic degradation. The different charges of the two dyes (positive, RB, and negative, MY) have different adsorption characteristics. From our previous study, the catalyst has a negative surface charge in the experimental conditions used, and an easier degradation of RB was expected, as observed in a previous study.18 For the photocatalytic experiments, the concentration used was between 0.01 and 0.04 mM, and the catalyst concentration was maintained constant at 0.2 g L−1 (Fig. S1†). The photolysis experiments were carried out without the catalyst and with a dye concentration of 0.01 mM. All experiments were carried out until complete degradation occurred, which was between 200 and 900 minutes for MY and 100 and 400 minutes for RB, respectively, depending upon the concentration used. Before starting the reactions, the mixtures tested were left in the dark overnight to evaluate the adsorption of the dye on the surface of the catalyst. Between RB and MY, different behaviours were observed, due to the surface charge of the catalyst. Metanil yellow, negatively charged, did not show any adsorption, while RB, positively charged, showed an adsorption of 1–5%, depending upon the concentrations used. In addition, both molecules showed a negligible degradation due to photolysis. In 450 minutes, the RB decomposed was less than 5%. Instead, the MY concentration decreased by about 2–3% in 900 minutes. Both dyes can be considered photo-stable, and their photolytic degradations are non-significant.
TOC analyses of some of the samples were carried out to verify that the degradation observed via UV/Vis absorption could be used to represent the dye degradation (Table S1†). Indeed, reduction in the absorbance of the sample is not a measure of mineralization. A molecule can lose its absorbance at a particular wavelength when degraded into smaller fragments, while TOC analysis can measure the quantity of organic compounds left in the medium, giving a more precise quantification of the amount of dye mineralised. The data showed that the difference between UV/Vis and TOC analyses is between 5 and 10%, meaning that the UV/Vis analyses are suitable to evaluate the total degradation (with a reasonable error).
2.3.2.1 Calibration. The pump was tested to evaluate its performance alone as well as attached to the system, with and without the catalyst powder inside the reactor. Regarding stability and volume delivered, no changes were found in a period of 7 h when the system did not contain the catalyst. Instead, when the catalyst was placed inside the reactor, stability and volume delivered were found to be stable for short amounts of times (50 minutes if the flow rate was 4 mL min−1, and 1.5 hours if the flow rate was 1 mL min−1). For longer times, the accumulation of the catalyst on the filter resulted in the reduction of the flow rate and an increase in pressure. Periodic sonication during the reaction was found to be crucial to maintain the flow rate at stable levels. Although the system could run for a longer time without problems, it was decided to apply 1 minute sonication, using a sonic-bath, every 30 minutes of reaction, independent of the speed used. This was also chosen to avoid the accumulation of the catalyst on the filter. For future references, the term “catalyst concentration” in CSTR systems refers to the concentration of catalyst inside the reactor, which in this case had a volume of 0.254 L.
3 Results and discussion
The aim of this work was to compare the efficiency of batch and continuous flow reactors using a carbon-doped TiO2 micron-sized catalyst (10 μm) synthesised in our previous work using chitosan microspheres as a template,19 named TiO2-Micro, was chosen as the photocatalyst.20 A detailed experimental procedure was discussed in our previous report.20 A schematic diagram is shown in Scheme 1.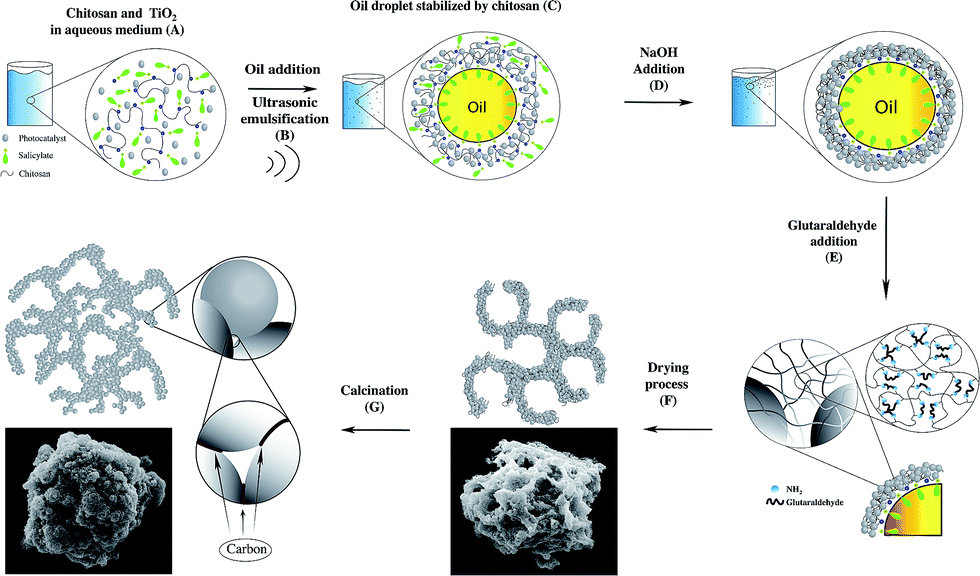 | ||
| Scheme 1 Mechanism of formation of micron-sized TiO2. | ||
In brief, P25 was dispersed in a solution of chitosan dissolved in salicylic acid (A). The addition of an oil phase (tetradecane), followed by sonication at 20 kHz resulted in the formation of chitosan microspheres with P25 nanoparticles embedded in the shell material (B and C). The addition of NaOH resulted in the aggregation of chitosan (D), due to the neutralization of the charges on the polymer chain. The addition of glutaraldehyde crosslinked the structures and promoted inter-microspheres connections (E). The drying process allowed the opening of the microspheres evaporating the oil contained in the microspheres (F), obtaining microporous structures. Finally, the product was calcined to remove the polymer (G). Some of the carbon remained in the structure, resulting in carbon doping of the material.
The efficiency of TiO2-Micro was found to be comparable to that of the nano-sized used as a reference (P25 from Degussa), and, under given experimental conditions, it had a negative surface charge. Its relatively larger size allowed easy removal by filtration, making it suitable for continuous flow studies.16
3.1 Comparison of batch and CSTR systems
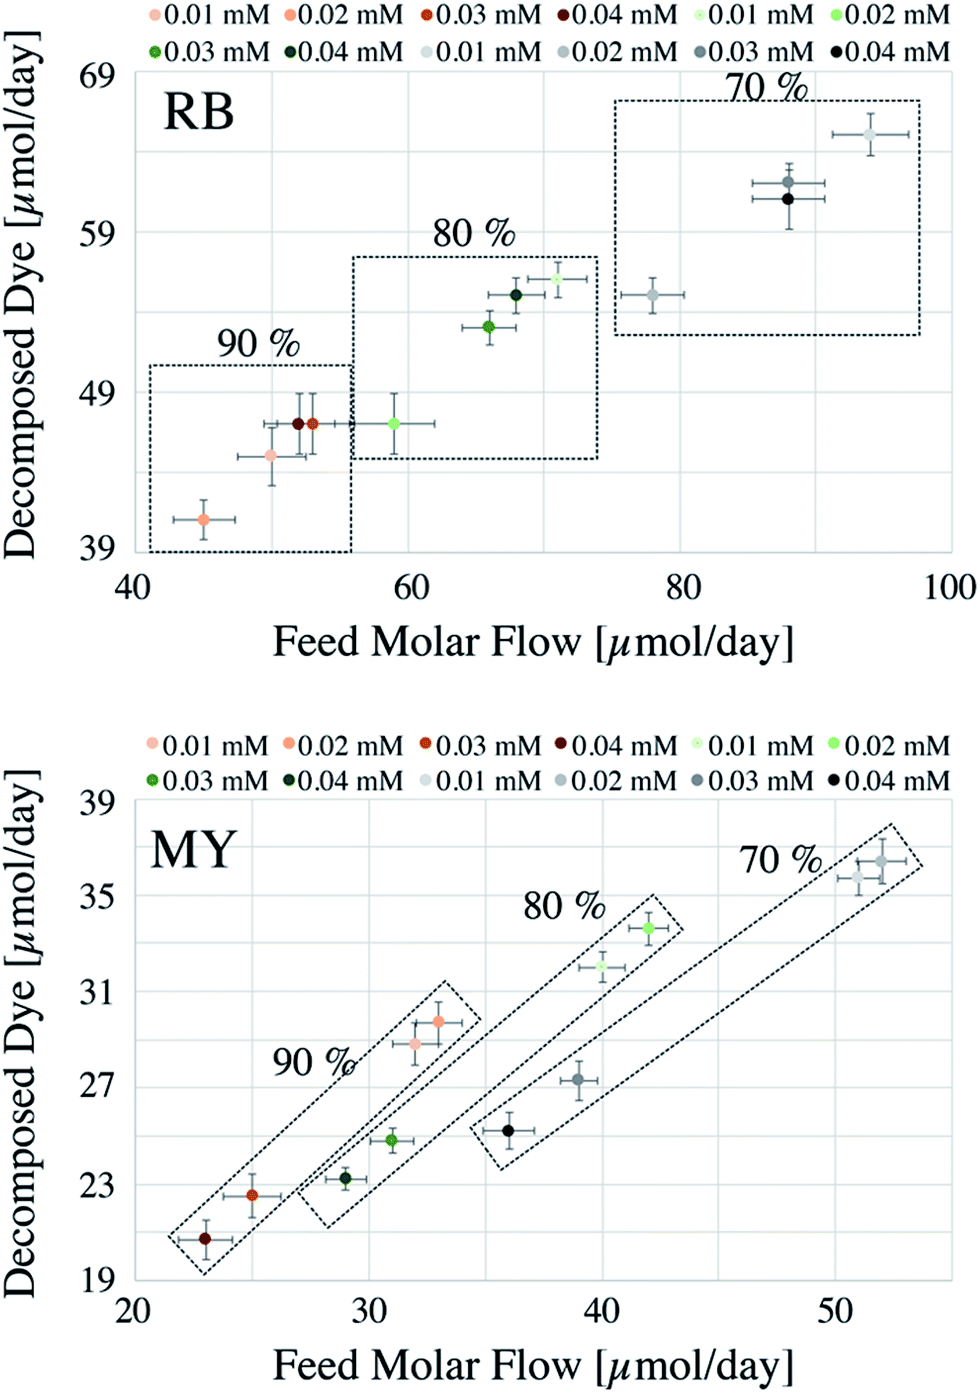
The comparison of two different systems (i.e., batch and continuous flow) can be difficult when the data are presented in a conventional manner as in Fig. S1.† For this reason, the data are presented with a different perspective. For the batch system, each reaction was considered as if it was running for 24 h nonstop (see below for further details), with conversions corresponding to 70, 80 and 90%. Generally, batch systems are used until maximum conversions are achieved to minimise operational costs (e.g., time and costs associated with loading and unloading procedures).The amount of dye decomposed, the total amount of dye used (Feed Molar Flow), and the degradation percentages achieved are reported in Fig. 1 for the batch system.
 | ||
| Fig. 1 Batch scale photodegradations of RB and MY. | ||
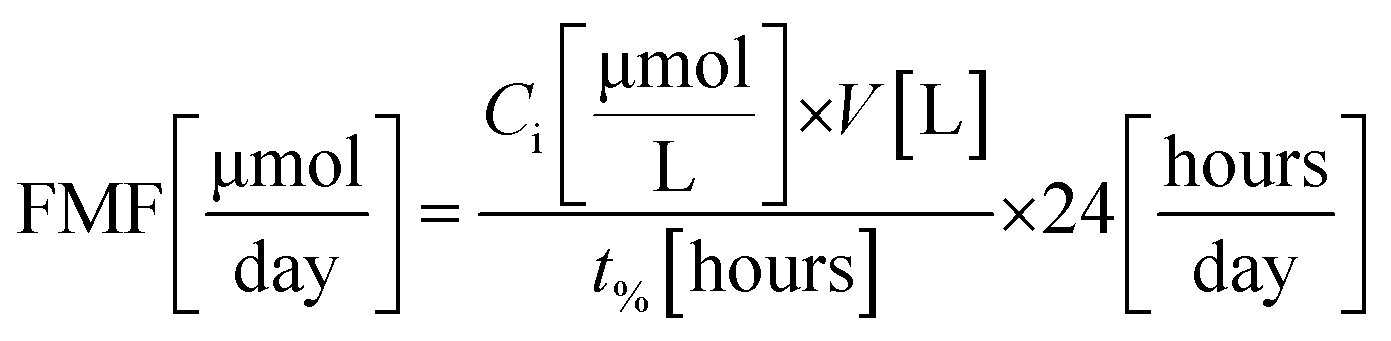
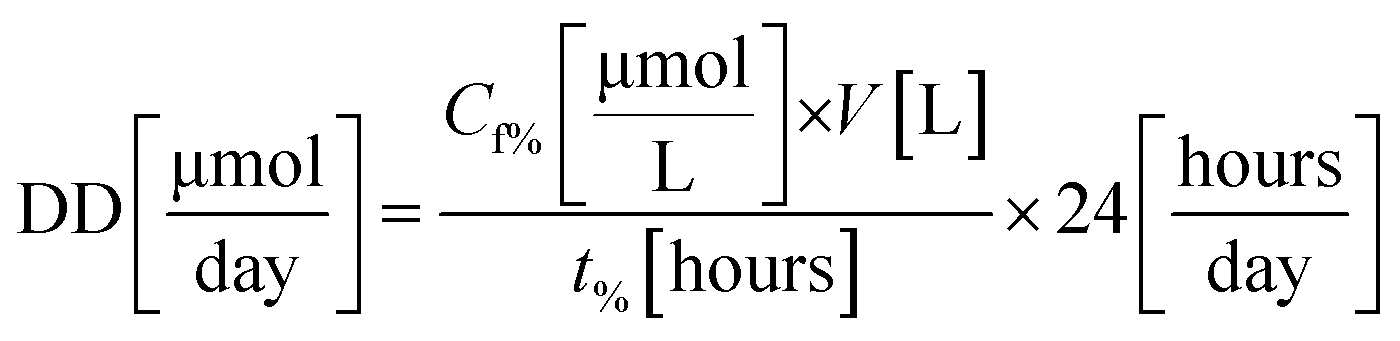
To calculate the feed molar flow (FMF) and the amount of decomposed dye (DD), experiments were carried out in triplicates until a certain amount of degradation was achieved (i.e., 70, 80, and 90%). Feed molar flow and the amount of dye decomposed are calculated using eqn (1) and (2), respectively.
 | (1) |
 | (2) |
In Fig. 1, the square boxes indicate the data obtained using different degradation percentages. As reported from previous studies, RB undergoes a faster degradation rate compared to that of MY.20 For example, considering 90% degradation, the amounts decomposed were 20–37 μmol per day for MY and 40–65 μmol per day for RB. The result in Fig. 1 also shows that a relatively higher degradation could be achieved at 70%, but as explained before, this may result in a significant increase in operational costs. Hence, from the operational cost point of view, for the systems considered, a reactor operated until 90% degradation would be more appropriate.
Fig. 1 data also suggests that, at a lower degradation percentage, the dye concentration has a strong influence on the photocatalytic efficiency. This behaviour can be justified based on pseudo first-order kinetics,14 where the remaining concentration of dye still controls the rate of the reaction. However, at higher % degradation, the concentration of the dye is very low and hence the reaction becomes independent of the concentration, i.e., the reaction becomes of zero order.
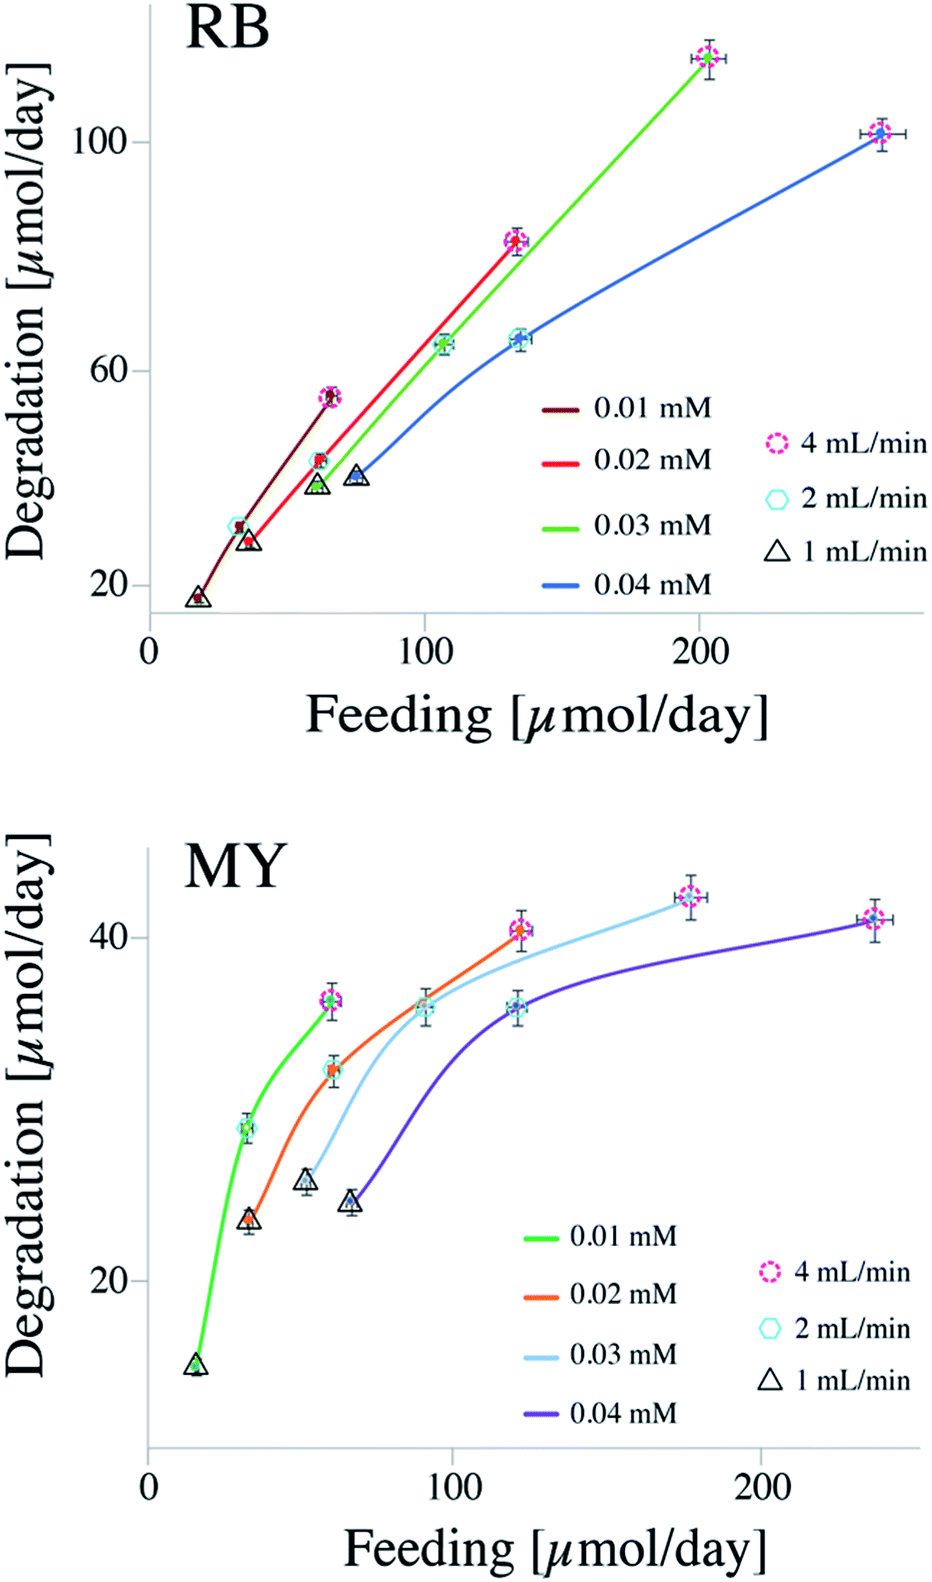
On the contrary to the batch system, a continuous flow system is less constrained to reach higher degradation efficiency, due to low operational costs.17 First, let us look at the data shown in Fig. 2, where, the degradations of MY and RB are shown as a function of the quantity fed to the reactor in a period of 24 hours.
 | ||
| Fig. 2 CSTR photodegradations of RB and MB. | ||
Feed Molar Flow (FMF) and amount of dye decomposed (DD) were calculated using eqn (3) and (4), respectively.
 | (3) |
 | (4) |
 | ||
| Fig. 3 Continuous flow photodegradations of 0.01 mM RB and 0.01 mM MY at a flow-rate of 1 mL min−1 and a catalyst concentration of in the reactor of 0.1 g L−1. | ||
Fig. 2 shows the data collected for the degradation of RB and MY at different flow rates and concentrations. The different lines represent the concentrations of dyes (i.e., 0.01, 0.02, 0.03, and 0.04 mM), while the different symbols surrounding the data points represent different flow rates utilized: dashed circle for 1 mL min−1, hexagon for 2 mL min−1, and triangle for 4 mL min−1.
From the results, it could be seen that the efficiency of CSTR system is strongly influenced by both concentrations of dye and flow rates. For instance, considering RB at a concentration of 0.03 mM, the amount of dye decomposed was about 35 μmol per day when the flow rate was 1 mL min−1 and 115 μmol per day when the flow rate was 4 mL min−1. The feed molar flow increased from 60 to 202 μmol per day. On the other hand, keeping the flow rate constant, and varying only the concentration of dye, a change in both variables (i.e., feed molar flow and amount of dye decomposed) can be observed. For instance, considering the degradation of RB at a flow rate of 2 mL min−1, the amount of dye decomposed increased from ca. 30 μmol per day when the concentration was 0.01 mM to ca. 64 μmol per day when the concentration was 0.04 mM. Also in this case, the feed molar flow increased from 32 to 134 μmol per day, respectively. The increase in degradation capacity is due to higher concentration of the dye.
Between the flow rate and concentration, the latter seems to have more influence on the degradation performance. Looking at a feed molar flow of 60 μmol per day (for both MY and RB), it can be noticed that the variable that strongly influences the efficiency is the concentration. As a result, between a high flow rate with a low concentrated solution and a low flow rate with a high concentrated solution, the former works better, probably due to a synergic effect of optimal concentration and a lower amount of light absorbed by the dye, which would improve the diffusion of the reactants as well as leaving more photons available for the catalyst.
The CSTR system can achieve higher degradations compared to that of the batch system, recording an increase of 40% in the degradation of MY and 110% in the decomposition of RB, considering 90% degradation in the batch system.
3.2 Long-run experiments and influence of flow-rates, catalyst amount and dye concentration
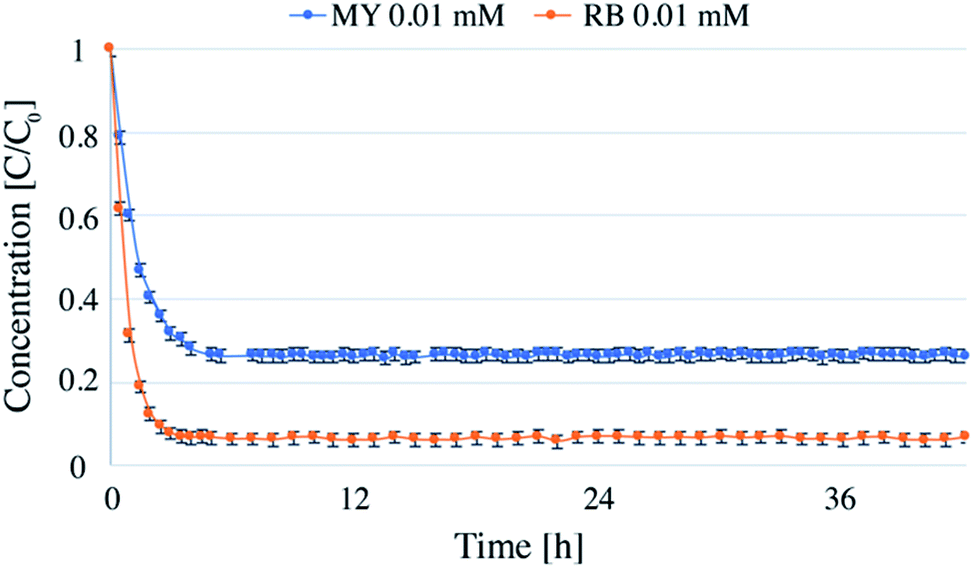
Long run tests were carried out with RB and MY for a total time of 42 hours to evaluate potential deactivation of the catalyst. The dye concentration was chosen to be 0.01 mM, and TiO2 concentration was 0.1 g L−1 (Fig. 3).The experiments were carried out over 6 days, 7 hours per day. After each day, the lamp and pump were turned off, and the reactor was disconnected from the pipes and kept in the dark until the next day. The first hours of the first day (about 3 h for RB and 4 h for MY) were necessary for the reactor to reach the steady state (see below for further details on the time required to reach the steady state). Following this, the system was stable for the whole time analyzed, showing that the system could be stopped and restarted without changing the degradation efficiency. Notably, no loss in catalyst efficiency was detected during 42 hours, demonstrating that the system could be used for longer periods of time. In total, more than 5 liters of dye solution were treated using 0.025 g of TiO2.
Experiments with different catalyst concentrations were also carried out. The experiments were performed using flow rates of 1, 2, and 4 mL min−1, and a feed solution of MY at a concentration of 0.01 mM. The results are reported in Fig. 4.
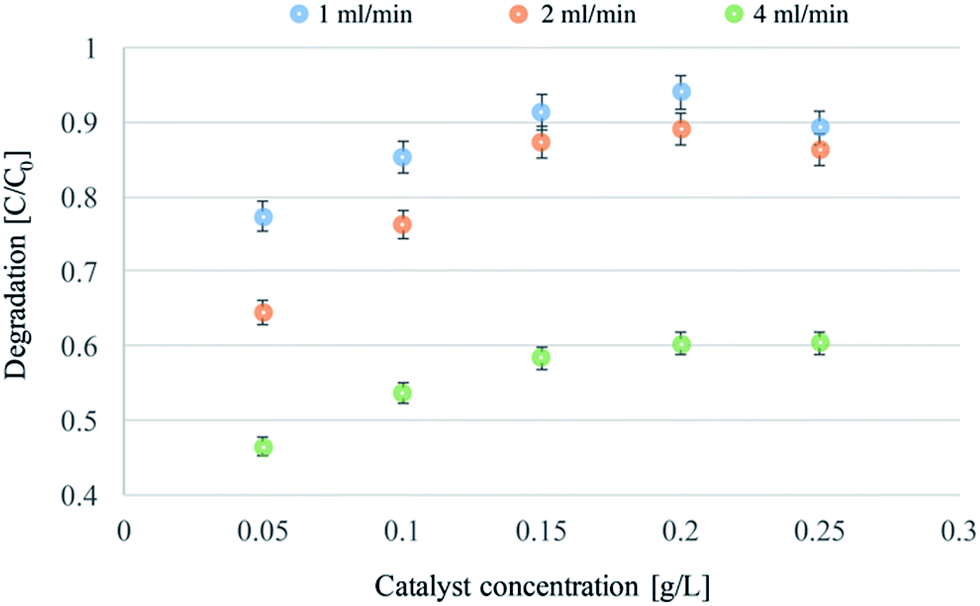 | ||
| Fig. 4 Continuous flow photodegradations of 0.01 mM MY at a flow-rate of 1, 2 and 4 mL min−1, and with a concentration of catalyst ranging from 0.05 to 0.25 g L−1. | ||
In theory, a CSTR should satisfy certain conditions. In particular, it assumes a constant density, isothermal conditions and perfect mixing. With these assumptions, the general CSTR eqn (5) can be derived from the general mole balance equation:17
 | (5) |
This section, aims to verify if the reactor used follows the behaviour expected from an ideal CSTR. In particular:
• For slow reaction rates, the time required to reach the steady state is proportional to the residence time.21 A reduction in the time required to reach the steady state should be expected varying the flow rate.
• The feed molar flow is inversely proportional to the conversion, with increasing feed molar flow, a reduction in conversion should be expected.
• An ideal CSTR is characterised by a perfect mixing. At the steady state, the concentration inside the reactor should be equal to that of the exiting solution.
A series of tests varying dye concentrations were carried out in order to verify the CSTR model17 (Fig. 5).
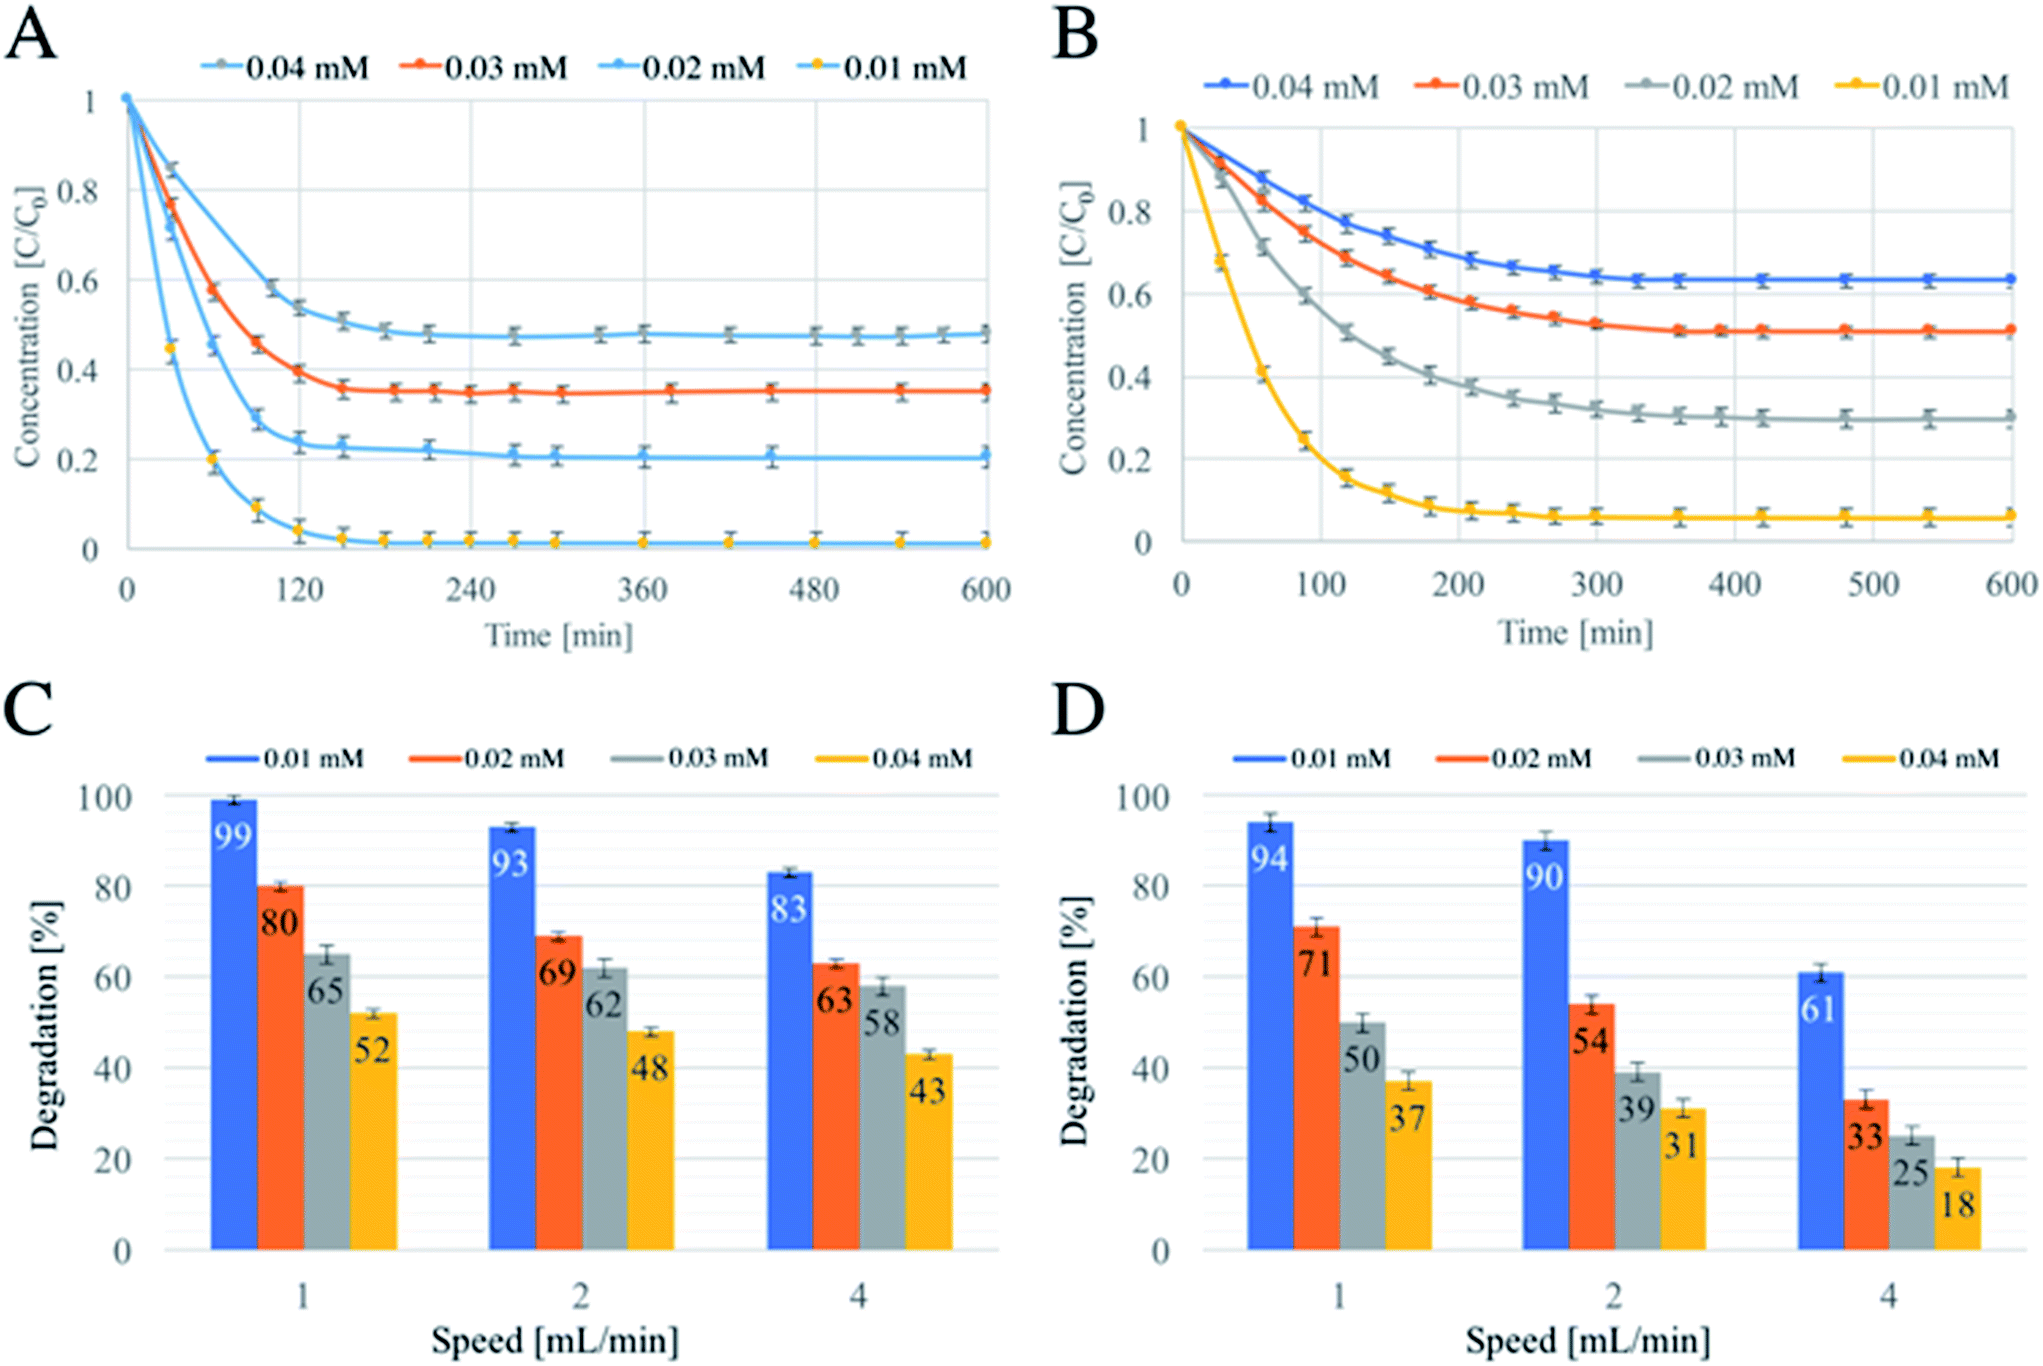 | ||
| Fig. 5 Continuous flow photodegradations of 0.01 mM MY (A) and 0.01 mM RB (B) at a flow-rate of 1 mL min−1, and a summary of the degradations achieved varying flow-rate and RB (C) and MY (D) concentrations. | ||
In theory, the time required to reach a steady-state is mainly influenced by two factors: the residence time, which is a function of the flow rate, and the kinetics of the reaction occurring in the reactor.17 Fig. 5A and B show the degradation as a function of time and concentration of RB and MY, respectively. The flow rate was kept at 1 mL min−1 for all the concentrations used, and no significant differences in time required to reach the steady state were observed within the single dye. However, different durations for degradations were required: RB needed about 150 minutes against 200 minutes required for MY, due to a faster degradation of RB.
This behaviour was also similar to that observed when the flow rate was 2 mL min−1 (Fig. S4A for RB and S4B for MY†). Instead, an increasing of speed to 4 mL min−1 resulted in a small reduction of the time required to reach the steady state, as discussed above1 For the concentrations above 0.01 mM, the time needed fell to about 120 min for RB (Fig. S4C†) and below 100 minutes for MY (Fig. S4D†), in agreement with previous studies.14
Another element of the theory is a reduction in the conversion (in percentage terms) when the concentration of reactant is increased at a constant flow rate.17 The results shown in Fig. 5C and D support the predictions of the CSTR theory. Finally, the CSTR model assumes that when a steady state is reached and the mixing is perfect, the reactant entering the reactor is immediately degraded and that the concentration inside the reactor is equal to that of the exiting solution. Fig. S5† shows two pictures of the reactor at the steady state and the entering and exiting solutions. For both MY (above) and RB (below), the colour intensity of the solution inside the reactor and the solution treated is similar, confirming that the mixing used was near perfect.14
Thus, it can be stated that the flow-through system constructed in our work is not only suitable for photocatalytic reactions, but also behaved as an ideal CSTR.
3.3 Mixed dyes and mechanism of photodegradation
To have a complete overview of the degradation mechanism, further experiments were carried out combining the two dyes. The degradation products were monitored via HPLC at 420 nm for MY and 554 nm for RB (Fig. S6†). The concentration changes via HPLC was compared with TOC analyses (Table S1†) – negligible difference between them was observed. Three solutions were tested: 0.01 mM of RB and 0.01 mM of MY, 0.03 mM of RB and 0.02 mM of MY, and 0.04 mM of RB and 0.03 mM of MY.RB had a retention time longer than MY (4.9 minutes for the former and 1.9 for the latter), due to its non-polar nature. During degradation, some smaller peaks appeared for RB, one of which of significant intensity at 3.7 min. Minor products were also observed for MY, but their intensity and hydrophobicity are too weak to obtain good separations under the experimental conditions used.
From the HPLC analysis, the degradations of the single dyes were calculated and reported in Table S2.† Additionally, a graph reporting feed molar flow against decomposed dye of the mixture is presented in Fig. S7.† The data shows that during the photodegradation no preferential degradations were observed. Both dyes were decomposed proportionally to what was observed in the single dye experiments, with RB showing a faster decomposition than that of MY.
Mass spectroscopy analyses were carried out to identify the degradation pathways. Compared to what is available in the literature (for RB: Sleiman et al.22 and for MY, Chen et al.23), a few differences were found for both RB and MY. Sleiman et al. showed that the MY could undergo direct fragmentation with or without initial hydroxylation, 352 and 368 m/z, respectively. From our experiments, another major peak was detected at 289 m/z, which correspond to the hydroxylated form of MY without the sulfonic group. No more differences were detected, and the update mechanism is proposed in Fig. S8.†
Instead, for RB, the differences observed are significant. The experiments of Chen et al. did not detect a peak at 459 m/z, which correspond to the hydroxylated form of RB. Moreover, the intensity of this peak is about 40% the intensity of the peak at 415 m/z (N-deacetylated RB), which suggests that the initial hydroxylation is an important step, and it must be taken into consideration as a secondary degradation pathway. However, after N-deacetylation/s, hydroxylation cannot be excluded, as proposed by Chen et al.23 These pieces of information allowed us to suggest an updated mechanism also for RB (Fig. S9†). In this new mechanism, RB can directly undergo N-deacetylation/s (415, 387, 359 and 331 m/z) or first undergo hydroxylation (431, 403, 375 and 347 m/z). When the N-deacetylation is completed, whether the molecule is hydroxylated or not, deamination occurs (318 and 302 m/z). At that point, the loss of the tail (hydroxyl-benzoic acid) produces xanthene (182 m/z), which can undergo to additional hydroxylation/s (214 and 198 m/z) before decomposition into small molecules. Ultimately, the ring opening and further oxidations of the small molecules lead to complete mineralisation of the dyes into inorganic salts, CO2 and H2O.
4 Conclusions
This study presents significant findings for future development of large-scale photocatalytic reactors. We have discussed that continuous flow system configurations could be developed that CSTR configuration could be a suitable choice for industrial applications. Besides, the studies of the effect of the different variables (e.g., concentration or flow rates) on the degradation performance are crucial for understanding the direction to undertake for scaling up processes. Finally, it is shown that a micron-sized photocatalyst is suitable for continuous flow systems and that the introduction of short and periodic sonication is sufficient to prevent the accumulation of the catalyst on the surface of the filter.The key findings of this work can be summarized as below:
• The continuous flow system demonstrated a higher flexibility and efficiency compared to that of the batch system, leading to an increase in degradation of up to 110%. This improvement was associated with the ability of the continuous flow reactor in providing higher concentration of pollutants when the system reaches a steady state.
• In the CSTR system, between flow rates and concentrations, the latter showed to be more important for achieving high decompositions. Also in this case, the reason behind such behaviour was found to be the diffusion rate of the pollutant on the surface of the catalyst.
• The catalyst utilized for the experiments has proven to be suitable for continuous flow studies, demonstrating no loss in photocatalytic activity over a period of 42 hours.
• The degradation mechanisms of MY and RB were found to be different to that reported in the literature.
Conflicts of interest
There is no conflicts to declare.Acknowledgements
EC acknowledges the University of Melbourne for the award of MIRS/MIFRS, and financial support from the Australian Research Council (ARC-DP) is also gratefully acknowledged. We are very appreciative to Mrs S. S. Volaric for her assistance with the MS data acquisition and analysis.Notes and references
- S. N. Chandramowli, F. A. Felder and X. G. Shan, ASME, 2016 Search PubMed.
- R. W. Matthews, Pure Appl. Chem., 1992, 64, 1285–1290 CrossRef CAS.
- R. Andreozzi, V. Caprio, A. Insola and R. Marotta, Catal. Today, 1999, 53, 51–59 CrossRef CAS.
- A. Mills, R. H. Davies and D. Worsley, Chem. Soc. Rev., 1993, 22, 417–425 RSC.
- P. S. Mukherjee and A. K. Ray, Chem. Eng. Technol., 1999, 22, 253–260 CrossRef CAS.
- X. Li, C. Fan and Y. Sun, Chemosphere, 2002, 48, 453–460 CrossRef CAS PubMed.
- K. Walha, R. B. Amar, L. Firdaous, F. Quéméneur and P. Jaouen, Desalination, 2007, 207, 95–106 CrossRef CAS.
- X. Tang, Q. Feng, K. Liu, X. Luo, J. Huang and Z. Li, Microporous Mesoporous Mater., 2018, 258, 251–261 CrossRef CAS.
- C. L. Bianchi, E. Colombo, S. Gatto, M. Stucchi, G. Cerrato, S. Morandi and V. Capucci, J. Photochem. Photobiol., A, 2014, 280, 27–31 CrossRef CAS.
- L. Li, J. Yan, T. Wang, Z.-J. Zhao, J. Zhang, J. Gong and N. Guan, Nat. Commun., 2015, 6, 5881 CrossRef PubMed.
- B. Sheidaei and M. A. Behnajady, Desalin. Water Treat., 2015, 56, 2417–2424 CrossRef CAS.
- M. Shargh and M. A. Behnajady, Water Sci. Technol., 2016, 73, 2804–2814 CrossRef CAS PubMed.
- V. Vaianoa, O. Saccoa, D. Sanninoa, M. Stollerb, P. Ciambellia and A. Chianeseb, Chem. Eng., 2016, 47, 1–6 Search PubMed.
- A. Miyawaki, S. Taira and F. Shiraishi, Chem. Eng. J., 2016, 286, 594–601 CrossRef CAS.
- S. Meshram, R. Limaye, S. Ghodke, S. Nigam, S. Sonawane and R. Chikate, Chem. Eng. J., 2011, 172, 1008–1015 CrossRef CAS.
- C. J. van Rijn, Nano and Micro Engineered Membrane Technology, Elsevier, 2004 Search PubMed.
- G. William Jr, Chemical and Biological Reaction Engineering, https://ocw.mit.edu/courses/chemical-engineering/10-37-chemical-and-biological-reaction-engineering-spring-2007/lecture-notes/lec05_02212007_g.pdf, accessed 22 May 2017 Search PubMed.
- X. Li, M. Li, J. Yang, X. Li, T. Hu, J. Wang, Y. Sui, X. Wu and L. Kong, J. Phys. Chem. Solids, 2014, 75, 441–446 CrossRef CAS.
- E. Colombo, F. Cavalieri and M. Ashokkumar, ACS Appl. Mater. Interfaces, 2015, 7, 12972–12980 CAS.
- E. Colombo, W. Li, S. K. Bhangu and M. Ashokkumar, RSC Adv., 2017, 7, 19373–19383 RSC.
- R. K. Sinnott and G. Towler, Chemical Engineering Design: SI Edition, Elsevier, 2009 Search PubMed.
- M. Sleiman, D. Vildozo, C. Ferronato and J.-M. Chovelon, Appl. Catal., B, 2007, 77, 1–11 CrossRef CAS.
- F. Chen, J. Zhao and H. Hidaka, Int. J. Photoenergy, 2003, 5, 209–217 CrossRef CAS.
Footnote |
| † Electronic supplementary information (ESI) available. See DOI: 10.1039/c7ra09753k |
| This journal is © The Royal Society of Chemistry 2017 |