 Open Access Article
Numerical simulation of high inertial liquid-in-gas droplet in a T-junction microchannel†
Mohammad Mastiani ,
Babak Mosavati and
Myeongsub (Mike) Kim
 *
*
Department of Ocean and Mechanical Engineering, Florida Atlantic University, 777 Glades Road, Boca Raton, FL 33431, USA. E-mail: kimm@fau.edu
First published on 16th October 2017
Abstract
Aqueous microdroplet generation involving high inertial air flow inside a T-junction microchannel was studied numerically. The volume of fluid method was employed to track the interface between two immiscible fluids: water and air. The effects of high inertial air flow on the water droplet generation were investigated. At various Re and Ca numbers, unique flow regime mapping including squeezing, dripping, jetting, unstable dripping, and unstable jetting and their transitions were determined. Unstable dripping and unstable jetting flow regimes are new regimes which have not been previously reported in the liquid–liquid system. The flow structure in these two flow regimes is affected by the high inertial nature of the continuous phase which is negligible in the conventional liquid–liquid system. It was found that the stable aqueous droplets are generated in the squeezing and dripping flow regimes. On the other hand, the unstable dripping flow regime is unable to sustain spherical droplets as they travel downstream. In the unstable jetting flow regime, a stream of water is fragmented into multi-satellite droplets and threads of different sizes as it moves downstream. The behavior of the unstable jetting flow regime cannot be characterized due to the effect of high inertial air flow on the water stream. The results show that droplet size increases as Ca and Re numbers increase and decrease, respectively. As both Ca and Re numbers increase, droplet generation frequency increases, reaching its maximum at 223 Hz. Finally, the effect of different contact angles at 120–180° on droplet size, detachment time, and droplet generation frequency was investigated. The results of this research provide valuable insight into the understanding of high throughput oil-free aqueous droplet generation within a gas flow.
1. Introduction
In recent years, droplet microfluidics has been used as a promising, interdisciplinary technique for generation and manipulation of monodisperse and discrete micrometer-sized droplets. It offers several advantages associated with highly parallelized experiment, monodisperse particle generation, facile control of droplet size and frequency, small sample volume, and low cost.1–5 As a result, it has become ubiquitous in a variety of applications such as drug delivery,6–10 material synthesis,11–13 diagnostic chips,14–16 chemical reaction,17,18 and microreactor.19–21Over the past few decades, the majority of investigations on the aqueous droplet generation have been carried out in an immiscible oil–liquid system: mainly oil and water (O/W) as continuous and disperse phases, respectively. Low cost, high commercial availability, and suitable physical properties (e.g. high interfacial tension) of the O/W system make it an appropriate system for the production of stable and uniformly sized aqueous droplets. Numerous numerical and experimental works have studied the underlying physics of droplet generation in the O/W system in different geometries such as flow-focusing, T-junction and co-flowing. These include double emulsion droplets,22–26 high viscosity droplets,27 nanofluid28–33 in droplet formation,34–36 droplet formation with mechanical vibration,37 droplet coalescence, and droplet splitting and mixing.38–42 However, many disadvantages and limitations on this O/W system have arisen.43 The involvement of oil in this system requires a time-consuming and complicated post-processing in the stage of final product collection, since the oil should be separated from the aqueous droplets. As a result, multiple washing steps have to be conducted off-chip to remove oil from products which can be problematic in case of cell encapsulation.43 Furthermore, the use of the oil phase in biological and biomedical applications always raises concerns about the biocompatibility issues due to its toxicity.44 Finally, the low Reynolds (Re) number nature of this system results in low throughput of droplet generation (low frequency) and inefficient mixing through droplet collision.45
To resolve the issues of the oil toxicity and separation step in the conventional O/W system, the continuous phase (oil) should be replaced by either an aqueous phase or a gaseous phase. The resultant systems would be an aqueous two-phase system (ATPS) and an aqueous droplet in gaseous environment system (e.g. water-in-air). Both systems could be appropriate biocompatible and eco-friendly alternatives for the biomedical applications.46 On the other hand, the high throughput is another important need for many applications, resulting in higher production efficiency and remarkable savings in reagents and time.45 The ATPS is inappropriate to create droplets at high frequency due to inherent low Re number flow of the water phase. Therefore, to increase the throughput of production, the involvement of high-speed gas flow (high Re number) is essentially required.
The water-in-air (W/A) system is a novel approach to meet these requirements.43,45 A typical Re number of air in the W/A system due to the low viscosity and high velocity of air is significantly higher than in the conventional O/W system. As a result, the droplet generation frequency in the W/A system is higher than that in the O/W system.47 The highly inertial droplets generated in the W/A system and corresponding short convective timescales involved in the droplet transport can enable fast and efficient mixing of the reagents that occurs inside the droplets. This can also improve the ability to digitally manipulate droplets at a very high throughput.45 This fact is due to the detaching droplet under inertial condition in W/A system resulting from the increasing collision velocity or reducing collision length scale. Furthermore, it has been known that adding surfactants to the continuous phase can facilitate the droplet generation; however, it may impose limitations on biomedical applications due to the risk of cross-contamination. Droplet generation in the gaseous phase doesn't require using surfactants which makes droplet as a clean and contamination-free medium for drug delivery and cell encapsulation.48 The W/A system can also be used in the variety of applications such as detection of airborne particles,49 purification of organic substances,50 aerosol drug delivery,51 point-of-care diagnostics52 and simulating a lung pathway.53
Despite its importance, there are only a few experimental works available in the W/A system, namely analysis of water droplet/slug detachment in air flow,47,54 W/A system in co-flow43 and flow focusing geometries,45,48 droplet collision mixing,55,56 and coalescence of small aerosol droplets.57 Flow regime mapping of high inertial gas–liquid droplets in flow-focusing geometries has been done by Shahriari et al.45 They experimentally and analytically investigated the effect of the microchannel geometry on different flow regimes and droplet sizes. Another experimental research on liquid–gas droplets has been performed by Tirandazi and Hidrovo.48 Droplet size, generation frequency and flow regimes under the effect of a high speed gas flow have been studied. Jiang et al.43 used gas as the continuous phase to generate water droplets inside a capillary co-flow system. They found two unique flow regimes of dripping and satellite droplets. However, the difficulties associated with the proper control of the gas flow, as well as the instability of the system, have limited to understand underlying physics of droplet generation through experimental investigations in the W/A system.45
On the other hand, numerical simulation could be an effective tool to study the physics and mechanism of water droplet generation in the W/A system with the huge cost and time savings. Numerical methods enable us to investigate the effects of a wide range of Re numbers (i.e., various Vair) on the properties of aqueous droplets, which is difficult to achieve through experiments. To the best of our knowledge, there have been no attempts to investigate formation mechanisms and flow regime mapping of aqueous droplets within the high inertial gas flow in a T-junction microchannel.
In this paper, we aim to understand the dynamics of water droplet generation in the high-speed air flow in a T-junction geometry. We qualitatively and quantitatively studied the effects of different Re numbers (0.1–100) and Ca numbers (0.0001–0.1) on water droplet generation in the air phase inside a T-junction geometry. We particularly focused on influences of the air velocity on different flow regimes, corresponding transition Re numbers, droplet size, and generation frequency. The importance of contact angles (θ = 120°, 140°, 160°, and 180°) on the droplet size, generation frequency, and detachment time was also investigated.
2. Mathematical formulation
2.1. Problem statement
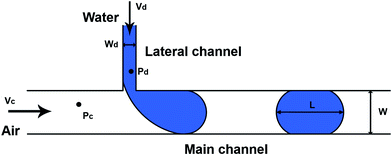
Fig. 1 shows a schematic of the T-junction and boundary conditions employed in the numerical simulation. The widths of the main (continuous) and lateral (disperse) channels are 100 μm and 30 μm, respectively. Air and water are injected into the microfluidic device as continuous and disperse phases, respectively. Table 1 indicates the physical properties of both continuous and disperse phases. Ca number ( ) is defined for the water phase (disperse phase), while Re number (
 ) is calculated by the air flow (continuous phase). All physical properties of both phases remain constant and therefore Re and Ca numbers are varied only by the flow velocity. In other words, we changed water and air velocities to study the contributions of various forces such as interfacial tension, pressure, viscous and inertial forces to the droplet generation. A wide range of Re numbers (Re = 0.1–100) was considered to investigate the effects of the inertial air flow on the water droplet generation. At a fixed Re number, Ca number was changed from 0.0001 to 0.1 such that the water velocity was less than or equal to the air velocity so as to generate aqueous droplets at the junction.58 It should be noted that the flow field and dimensionless numbers are time-dependent and as a result the characteristic length of the flow used for non-dimensionalization is also a function of time.59 In our analysis, the width of the main channel was used as the characteristic length. Various contact angles between water and the surface were considered to study their effect on aqueous droplet formation.
| Density (kg m−3) | Viscosity (Pa s) | Interfacial tension (N m−1) | |
|---|---|---|---|
| Continuous phase (air) | 1.225 | 1.78 × 10⁻⁵ | 0.0728 |
| Disperse phase (water) | 998.2 | 0.001 |
2.2. Governing equations and numerical model
The continuity and momentum equations for a two-dimensional, laminar, and unsteady flow are expressed as below:
 | (1) |
 | (2) |
Interfacial tension as a source term is added to the momentum equation and can be expressed based on the continuum surface model (CSF):
 | (3) |
The finite volume method was employed to solve the continuity and momentum equations using CFD package ANSYS Fluent 17.0. The Pressure Implicit with Splitting of Operators (PISO) scheme was used for the pressure–velocity coupling, while a second-order upwind scheme was employed for the momentum equation. The pressure interpolation was performed by the PREssure STaggering Option (PRESTO!) method. The volume of fluid (VOF) method was applied with the geometric reconstruction scheme to track the interface between water and air. The amount of fluid in each cell is represented by α, varying between 0 and 1. In air and water phases α = 0 and α = 1, respectively, while it lies between 0 and 1 at the water–air interface. The continuity equation for the volume fraction is solved to track the interface between water and air:
 | (4) |
The fluid properties in the governing equations for each cell are calculated by the following equations:
| μ = μ1 + α2(μ2 − μ1) | (5) |
| ρ = ρ1 + α2(ρ2 − ρ1) | (6) |
A rectangular non-uniform grid was used in this study and it was further refined near the walls to obtain more accurate results. The grid independence test has been carried out with different grid sizes ranging from a coarse grid (total number of elements = 2933) to a finer grid (total number of elements = 20![[thin space (1/6-em)]](https://www.rsc.org/images/entities/char_2009.gif) 568), as shown in Table 2. It was found that the case IV provides a reasonable accuracy. A convergence criteria and a time step were set to 10−6 and 10−7–10−8 s.
568), as shown in Table 2. It was found that the case IV provides a reasonable accuracy. A convergence criteria and a time step were set to 10−6 and 10−7–10−8 s.
| Case I | Case II | Case III | Case IV | Case V | |
|---|---|---|---|---|---|
| No. elements | 2933 | 5182 | 10![[thin space (1/6-em)]](https://www.rsc.org/images/entities/char_2009.gif) 125 125 |
14![[thin space (1/6-em)]](https://www.rsc.org/images/entities/char_2009.gif) 112 112 |
20![[thin space (1/6-em)]](https://www.rsc.org/images/entities/char_2009.gif) 568 568 |
| Droplet detachment time (s) | 0.00562 | 0.00566 | 0.00572 | 0.00574 | 0.00574 |
| Droplet length (μm) | 145 | 143 | 141.8 | 140 | 139.5 |
2.3. Validation of numerical procedure
In order to validate the accuracy of the current numerical model, our numerical results were compared with the experimental results of Guo and Chen60 (Fig. 2), and Li et al.61 as shown in Fig. 3. The current results are in good agreement with the experiments. The small deviation between the simulation and the experimental results are probably due to the effects of variations in physical properties of fluids, temperature, channel roughness, and wettability in the simulation and experiment.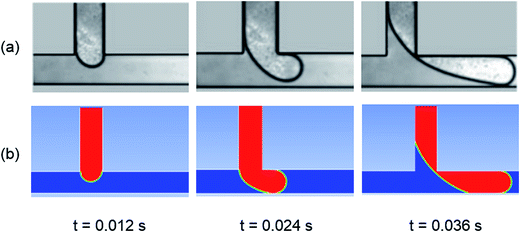 | ||
| Fig. 2 Validation: (a) experiment,60 (b) simulation (present study). | ||
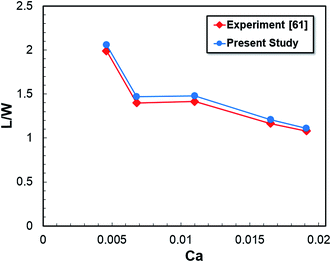 | ||
| Fig. 3 Comparison between the current numerical results with experiment for the dimensionless droplet size.61 | ||
3. Results and discussion
In the conventional liquid–liquid system, droplet generation is mainly characterized by a low Re number indicating the weak effect of the inertial force when compared with the viscous force due to the low flow velocity. When Re < 1, interfacial tension and viscous forces are dominant during the droplet formation.60 However, in the gas–liquid system, the contribution of the inertial force is significant due to the high-speed gaseous flow (i.e., high Re number) affecting the flow regime distribution and droplet properties. At different Re numbers, herein simulations were performed to study the effects of air and water velocities on the dynamics of aqueous droplet generation mechanisms in the T-junction geometry. The water phase is introduced to the junction in the lateral channel while the air phase is injected into the main channel. Water penetrates the main channel and then forms an interface with air at the junction. Water creates a plug approximately equal or greater than the channel width blocking the main channel. Finally, the interplay between different forces results in droplet generation in various regimes that will be discussed.623.1. Flow field and regimes
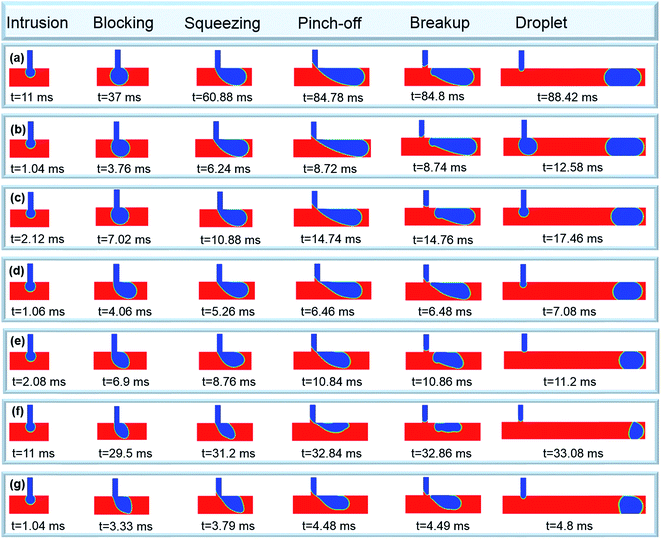
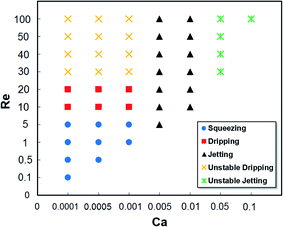
Fig. 4–7 show the two-phase flow field and sequential droplet formation in five different flow regimes including squeezing, dripping, jetting, unstable dripping and unstable jetting. These flow regimes can be categorized based on different Re numbers of air and Ca numbers of water as shown in Fig. 8. It has been generally known that in the O/W system, droplet formation can be classified into three regimes, e.g., squeezing, dripping, and jetting.62 In contrast, we observed five unique flow regimes in the current W/A system.Fig. 4 shows stable droplet generation in squeezing and dripping flow regimes at six sequential stages: intrusion, blocking, squeezing, pinch-off, breakup and droplet.63 In each stage, the droplet size and detachment time are uniquely distributed at different combinations of Re and Ca numbers. It has been known that the mechanisms of the droplet breakup are slightly different under the squeezing and dripping flow regimes, which affect the droplet size and frequency.62 To understand the droplet generation mechanisms in the squeezing and dripping flow regimes, contributions of each force to the droplet formation are considered. The main forces acting on the disperse phase include pressure, interfacial tension, viscous and inertial forces.2 In general, viscous and pressure forces act on water driving it downstream while the interfacial force resists detachment of droplets at the junction. In detail, these forces act dynamically on droplet generation as described in six sequential stages for the squeezing flow regime.
At a low Re number due to the low velocity of air, the inertial force and shear stress are not significant leading to the squeezing flow regime (Fig. 4a–d). In the early stage of the squeezing flow regime, water enters from the lateral channel to the main channel and meets the air stream (“intrusion stage”). The water penetration to the main channel continues until it blocks the main channel (“blocking stage”) followed by continuous increases in the upstream pressure. Therefore, the droplet breakup mechanism in this regime is dominated by a pressure drop across the droplet. The continuous injection of the disperse phase leads to the critical pressure drop when the entire main channel is blocked by the water. Then air starts to force and squeeze the neck of the water thread (“squeezing stage”). The squeezing of water by air continues until the water neck gets very thin. Finally, pinching-off and breakup occur and the upstream pressure drops abruptly (“pinch-off and breakup stages”) (see Video 1†). It should be noted that the physical confinement of the channel wall completely affects the droplet generation in the squeezing flow regime.58
The mechanism of droplet generation in the dripping flow regime, known as shear-dominated,62 is slightly different from the squeezing flow regime. The disperse phase partially blocks the main channel (Fig. 4e–g).64 Although it's known as shear-dominated, the exerted shear force of air on the water is not high enough to overcome interfacial tension. Due to this, the water plug oscillates at the junction (see Video 2†). During this oscillation, the water plug blocks the main channel several times and the pressure force due to the blockage of the main channel by the droplet plays an important role in the breakup. The breakup occurs when these three forces are balanced where the transition from the squeezing to dripping flow regimes occurs at Re = 10.
Fig. 5 shows the jetting flow regime at a wide range of Re number (Re > 5) and Ca = 0.005, 0.01 (see Fig. 8). In this regime, a stream of water is extended downstream of the main channel while attached to the top wall and parallel to the continuous phase (see Video 3†). It should be noted that in this study, the jetting flow regime is rather different when compared with the liquid–liquid system. In some cases (Re = 10, 20, and 50 and Ca = 0.005), a long thread of water forms a thin neck far from the junction resulting in breakup and forming big droplets (Fig. 5a and c). Therefore, droplet generation moves much further downstream from the junction as compared to its breakup point in the liquid–liquid system. This behavior is due to the interface instability caused by the exerted shear force of air on the water phase.65 In other cases (Fig. 5b and d), the water stream extends to the outlet without droplet generation and breakup may occur either close to or after the outlet (parallel flow regime). As a result, it is impossible to distinguish the jetting flow regime from the parallel flow regime in the high inertial gas–liquid system. By further increasing the Re number, the water stream becomes thinner due to the high inertial air flow which pushes water to the top wall of the channel (Fig. 5d).
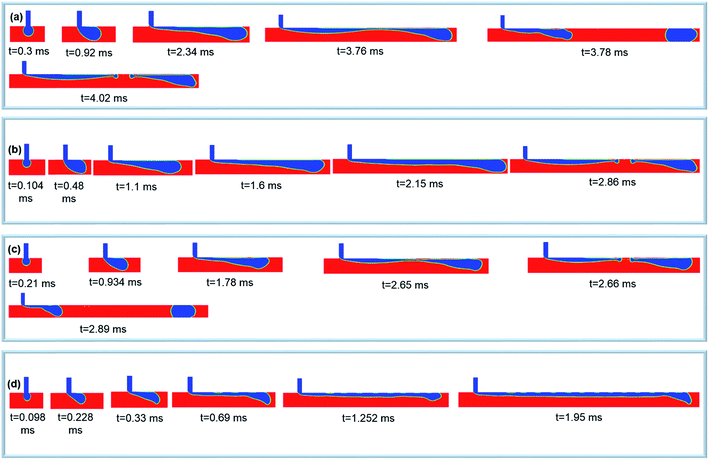 | ||
| Fig. 5 Droplet generation in jetting flow regime; (a) Re = 10 Ca = 0.005, (b) Re = 10 Ca = 0.01, (c) Re = 20 Ca = 0.005, (d) Re = 100 Ca = 0.01. | ||
We found two new flow regimes that have not been previously seen in the liquid–liquid system occurring at high Re numbers (Re = 30, 40, 50, and 100) called unstable dripping and unstable jetting flow regimes (Fig. 6 and 7). The flow structures in these two flow regimes are also affected by the high inertial nature of the continuous phase which has been neglected in the liquid–liquid system. In the unstable dripping flow regime (Ca < 0.005), the formed droplet cannot sustain its initial shape (Fig. 6). As the droplet passes the downstream, its interface is deformed, causing shape changes (see Video 4†). This is due to the fact that the contribution of inertial force of air is comparable with the interfacial tension. At Re = 100, it can lead to the breaking of droplets into small parts. The sequential stages of droplet generation in this regime is the same as the dripping regime. However, in the unstable dripping flow regime, water is not able to completely block the main channel. Therefore, unlike dripping and squeezing flow regimes, there is no significant pressure increase during the squeezing stage. In the unstable jetting regime (Ca > 0.01), an unstable thread of water extends downstream where its tip breaks up intermittently into small or large volumes of water at different locations (Fig. 7). The dominant flow structure at Ca = 0.05 includes a long jet of water along with multi-satellite droplets of different sizes (see Video 5†). The behavior of flow field is unable to be predicted due to the effect of high inertial air and water flows.
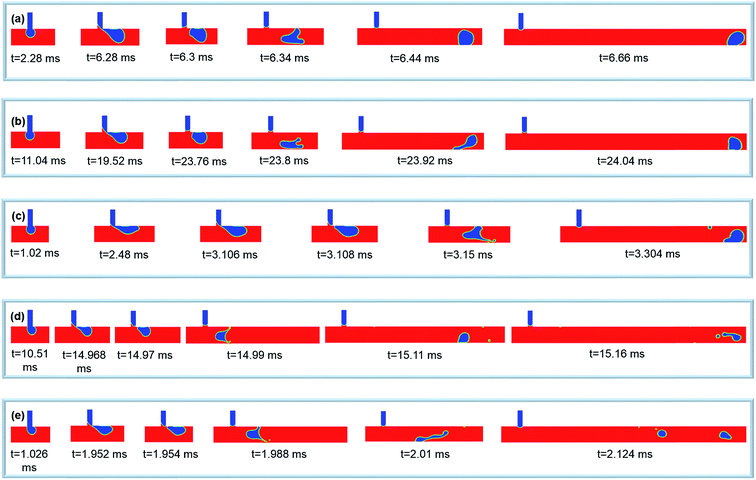 | ||
| Fig. 6 Droplet generation in unstable dripping flow regime; (a) Re = 30 Ca = 0.0005, (b) Re = 40 Ca = 0.0001, (c) Re = 50 Ca = 0.001, (d) Re = 100 Ca = 0.0001, (e) Re = 100 Ca = 0.001. | ||
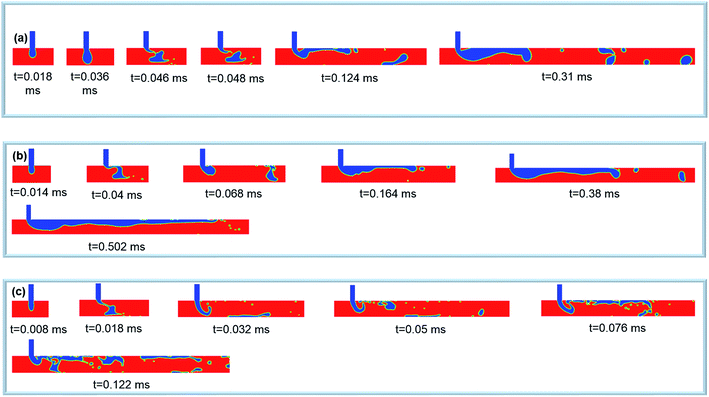 | ||
| Fig. 7 Droplet generation in unstable jetting flow regime; (a) Re = 50 Ca = 0.05, (b) Re = 100 Ca = 0.05, (c) Re = 100 Ca = 0.1. | ||
Fig. 8 summarizes the five flow regimes over a wide range of flow conditions at different Ca and Re numbers. The squeezing and dripping flow regimes occur at Ca and Re numbers less than 0.001 and 20, respectively. At low Ca numbers (Ca = 0.0001, 0.0005, and 0.001) and high Re numbers (Re = 30, 40, 50, and 100), droplets are generated in the unstable dripping flow regime while they are unable to maintain their initial shapes throughout the main channel. It is concluded that at the low Ca numbers but all Re numbers, droplets are formed at the junction in three regimes of squeezing, dripping, and unstable dripping. The jetting flow regime occurs at the middle Ca numbers and a wide range of Re numbers (Re = 5–100, Ca = 0.005, 0.01). The unstable jetting regime occurs at both high Ca and Re numbers such that the water jet is fragmented into small volumes and threads which are the dominant structures in this regime. It is worth mentioning that at Ca = 0.05 and 0.1, the inertial force of water completely dominates the interfacial force. Generally, at high Re numbers (Re = 30, 40, 50, and 100), stable droplet generation is impossible even at low Ca numbers.
3.2. Droplet size
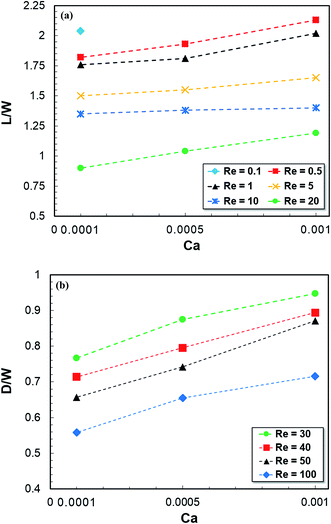
Fig. 9 shows the droplet size at different Ca and Re numbers: (a) the ratio of droplet length to the channel width in the squeezing and dripping flow regimes and (b) the ratio of droplet diameter to the channel width in the unstable dripping flow regime. In Fig. 9b, the droplet diameter (D) represents the diameter of the non-spherical droplet equivalent to that of the spherical droplet. It can be found from Fig. 9a and b that the droplet size increases as Ca number increases because the water phase is injected at a higher flow rate into the main channel forming bigger droplets. At a fixed Ca number, droplet size decreases with an increase in the Re number. As the Re number increases, the velocity of the continuous phase increases and this in turn enhances the inertial and shear forces resulting in smaller droplets.As shown in Fig. 9a, the effect of increasing the Ca number on the increase in the droplet size is more pronounced at lower Re numbers. For example, by increasing the Ca number from 0.0001 to 0.001, the droplet length increases from 3.6% at Re = 10 to 15% at Re = 0.5. The biggest droplet is generated at Re = 0.5 and Ca = 0.001, while the smallest one is formed at Re = 10 and Ca = 0.0001 (Fig. 9a). According to Fig. 4 and 9a, the length of droplets is bigger than the width of the channel for all Re and Ca numbers and their shapes are not spherical. The diameter of droplets in the unstable dripping flow regime are less than the channel width, and accordingly generated droplets in this regime are always smaller than those in squeezing and dripping flow regimes (Fig. 9b). The smallest unstable droplet is formed at Re = 100 and Ca = 0.0001 (D/W = 0.53).
3.3. Droplet detachment time and frequency
The droplet detachment time, the instant that the water thread was detached from the lateral channel, at different Ca and Re numbers is shown in Fig. 10a and b for squeezing and dripping and unstable dripping flow regimes, respectively. At a fixed Re number, the droplet detachment time decreases with an increasing Ca number. As the Re number increases, this time scale decreases and droplet breakup occurs quickly. The reduction in the detachment time from Ca = 0.0001 to 0.0005 at a given Re number is significantly higher than that from Ca = 0.0005 to 0.001 due to an increase in water velocity at a fixed air velocity. On the other hand, the difference in the detachment time at various Re numbers decreases as Ca number increases. The maximum detachment time occurs at the lowest Re and Ca numbers corresponding to the squeezing flow regime ( , Fig. 10a), while its minimum happens in the unstable dripping flow regime (
 , Fig. 10b, Re = 100 and Ca = 0.001).
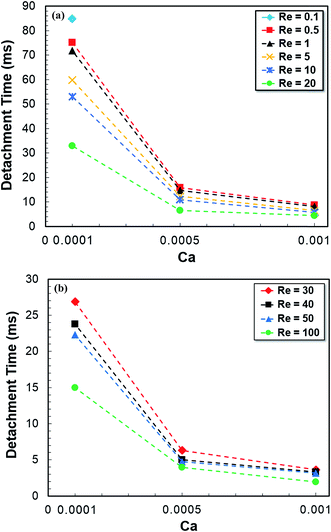 | ||
| Fig. 10 Droplet detachment time in (a) squeezing and dripping flow regimes, (b) unstable dripping flow regime. | ||
The droplet detachment time also can be interpreted as a frequency of droplet generation. Fig. 11 shows the variation of droplet generation frequency versus the Ca number at different Re numbers. Increasing Re number results in the higher droplet generation frequency with the smaller droplets. We found that the maximum frequency providing stable droplet generation is 223 Hz and occurs at Re = 20 and Ca = 0.001 in the dripping flow regime ( , Fig. 11a). Also, the maximum frequency of unstable droplet generation in the unstable flow regime is 512 Hz (
 , Fig. 11b).
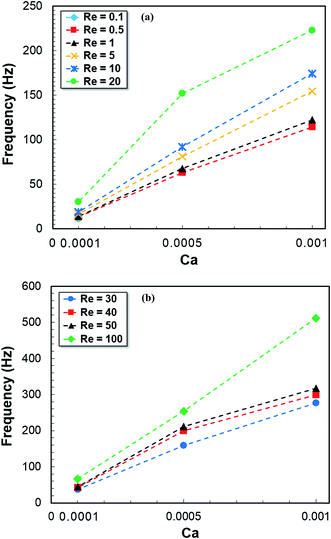 | ||
| Fig. 11 Droplet generation frequency in (a) squeezing and dripping flow regimes, (b) unstable dripping flow regime. | ||
3.4. Temporal variation of pressure
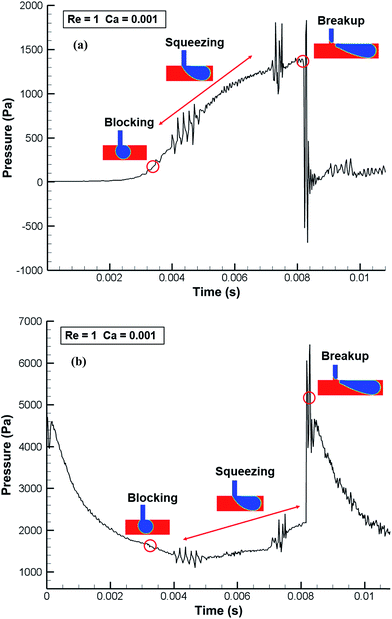
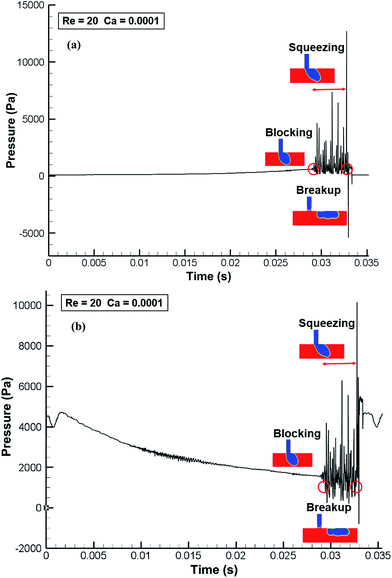
A pressure drop across the droplet plays an important role in the droplet breakup mechanisms.66 As such, variations of pressure near the junction area are useful to understand the underlying physics of droplet generation. Fig. 12–15 show the temporal variations of pressure at two phases (Pc for the continuous phase and Pd for the disperse phase) for squeezing, dripping, jetting, and unstable dripping flow regimes. Pc is measured at a point before the junction in the main channel, whereas Pd indicates the pressure at a point in the lateral junction (Fig. 1). Compared to droplet generation in the liquid–liquid system, the pressure profile in the W/A system experiences more fluctuations over time. This is mainly due to the high flow velocity and the inertial force of the gas phase on the water droplet.Fig. 12 shows the pressure evolution at points Pc and Pd in the squeezing flow regime at Re = 1 and Ca = 0.001. During the intrusion stage, water starts to enter the main channel and Pc remains approximately constant until t = 3.5 ms when the blocking stage occurs. Due to the pressure build-up before the droplet at Pc, the pressure profile experiences an increase and the squeezing stage follows. At t = 8.2 ms, the droplet breakup stage occurs and the pressure drops abruptly. On the other hand, the pressure of the disperse phase (Pd, Fig. 12b) first undergoes a decrease and subsequent increase from the blocking to squeezing stages. First, water slowly starts to enter the main channel and pushes itself into the air resulting in decreased Pd. During the squeezing stage, the curvature of the growing droplet at the neck is gradually decreased as the tip of the water thread penetrates further into the main channel, leading to increases in the pressure Pd.67 Then it shows a peak because of droplet breakup. Generally, Pd is always higher than Pc at the same timescale as expected.66 The temporal variation of pressure in the dripping flow regime (Re = 20 and Ca = 0.0001) is shown in Fig. 13. The magnitudes of pressure in this regime are higher than that in the squeezing flow regime (cf., Fig. 12) as the flow velocity is higher (Re = 1 in Fig. 12 vs. Re = 20 in Fig. 13). While the general behavior of pressure variations in the dripping flow regime is similar to that in the squeezing flow regime, Pc presents differently in the blocking and squeezing stages. It dramatically increases in the squeezing flow regime due to the complete blockage of the main channel, while it fluctuates in the dripping flow regime due to the dancing motion of the droplet (see Video 2†). This dancing motion affects the variation of Pd leading to its fluctuation trend (Fig. 13b).
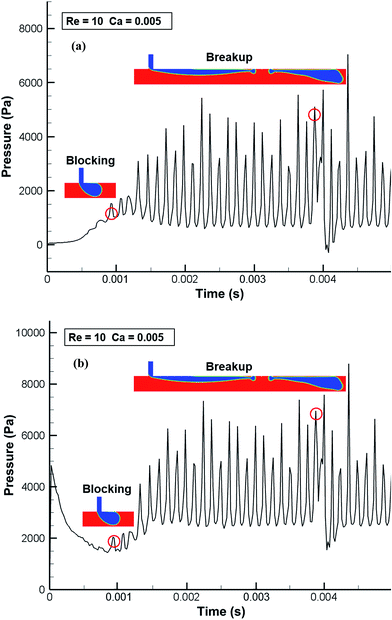
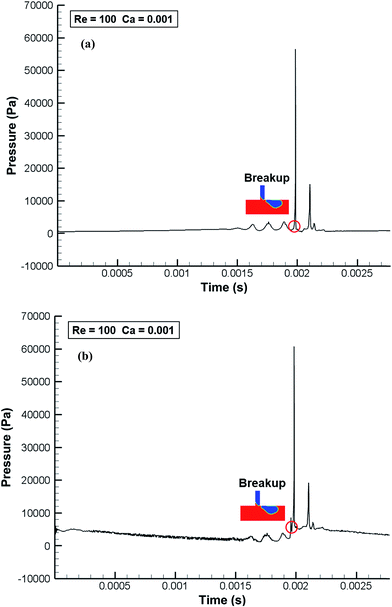
Fig. 14 shows evolution profiles of pressure in the jetting flow regime at Re = 10 and Ca = 0.005. During the intrusion process, Pc and Pd experience increasing (Fig. 14a) and decreasing (Fig. 14b) behaviors, respectively, following periodic fluctuations in both Pc and Pd. The periodic fluctuation behaviors are due to the periodic blockage of the main channels by the elongated water tip as it travels toward the downstream (see Video 3†). As shown in the figure, the first blockage occurs at t = 0.9 ms and the traveling water tip blocks the channels multiple times generating multiple peaks. The temporal variation of pressure in the unstable dripping flow regime (Re = 100 and Ca = 0.001) is shown in Fig. 15. Compared to the previous regimes, pressure in the unstable flow regime experiences less fluctuation since the droplet is unable to block the main channel.
3.5. Contact angle
In droplet generation in the microfluidic T-junction, the contact angle plays an important role in droplet sizes and shapes as non-spherical droplets with a high surface-to-volume ratio are typically generated in this geometry.58 All generated droplets in the squeezing and dripping flow regimes have a length longer than the channel width (Fig. 9a); therefore, droplet formation is highly influenced by the channel wall. To investigate the effect of a contact angle on droplet generation mechanisms in the simulation, four different contact angles (θw) at 120°, 140°, 160°, and 180° from weak- to super-hydrophobic surfaces were examined. The contact angle indicates the interaction of water molecules and the channel wall. It defines the adjustment of the curvature of the surface near the wall:
![[n with combining right harpoon above (vector)]](https://www.rsc.org/images/entities/i_char_006e_20d1.gif) = = ![[n with combining right harpoon above (vector)]](https://www.rsc.org/images/entities/i_char_006e_20d1.gif) w w![[thin space (1/6-em)]](https://www.rsc.org/images/entities/char_2009.gif) cos cos![[thin space (1/6-em)]](https://www.rsc.org/images/entities/char_2009.gif) θw + θw + ![[t with combining right harpoon above (vector)]](https://www.rsc.org/images/entities/i_char_0074_20d1.gif) w w![[thin space (1/6-em)]](https://www.rsc.org/images/entities/char_2009.gif) sin sin![[thin space (1/6-em)]](https://www.rsc.org/images/entities/char_2009.gif) θw θw
| (7) |
Fig. 16 and Table 3 show the effect of different contact angles on the shape and size of droplets, detachment time, and frequency. By increasing the contact angle, the droplet detachment time decreases for both Ca = 0.001 and 0.0001 (Table 3). This behavior can be explained that as the contact angle increases, the adhesive force of water on the channel wall, i.e., a wall resistance to the flow, decreases. Consequently, the flow becomes faster and breakup occurs at an earlier time.58 On the other hand, the droplet length decreases as the contact angle increases. This is due to the hydrophobicity of the channel wall exceeding the effect of interfacial tension for droplet generation. Since the droplet is completely confined by the channel wall, increasing the adhesive force of water on the wall results in larger droplets. It is worth noting that at Ca = 0.001 and θw = 120°, the flow regime is in the jetting flow while it is in the squeezing flow regime in other angles. The droplet generation frequency experiences an increasing trend by increasing the contact angle.
| Ca | 0.001 | 0.0001 | ||||||
|---|---|---|---|---|---|---|---|---|
| θw | 120° | 140° | 160° | 180° | 120° | 140° | 160° | 180° |
| L/W | — | 1.94 | 1.8 | 1.65 | 1.94 | 1.7 | 1.52 | 1.5 |
| Detachment time (ms) | — | 8.08 | 6.64 | 6.48 | 88.46 | 74.22 | 62.94 | 59.8 |
| Frequency (Hz) | — | 124 | 151 | 154 | 11 | 13 | 16 | 17 |
4. Conclusion
In this paper, we numerically studied the underlying mechanisms of aqueous droplet generation in high inertial air flow in a T-junction droplet generator. Applying the pressure-based finite volume method with the volume of fluid model, contributions of various forces on droplet generation were analyzed. In addition, the two-phase flow behaviors of water droplets within air over a wide range of Ca and Re numbers were examined. At various Re and Ca numbers, unique flow regime mapping was determined including squeezing, dripping, jetting, unstable dripping, and unstable jetting. Unstable dripping and jetting flow regimes have not been reported in the previous studies. The main characteristic of these new regimes is the significant effects of the high inertial force of air flow on droplet generation, resulting in an unstable structure of water flow. Due to the distinct dynamics of the droplet breakup mechanism, many two-phase flow patterns at different flow regimes were observed such as droplets, plugs, thin water film, multi-satellite droplets, and fragmented droplets and threads. Droplet size increases as Ca and Re numbers increases and decreases, respectively. The system reached its maximum at 223 Hz in the dripping flow regime while at 512 Hz in the unstable dripping flow regime. Lastly, we found that by increasing the contact angle in the squeezing and dripping flow regimes, the droplet detachment time and droplet size decrease.Conflicts of interest
There are no conflicts to declare.References
- M. Mastiani, S. Seo, S. M. Jimenez, N. Petrozzi and M. M. Kim, Flow Regime Mapping of Aqueous Two-Phase System Droplets in Flow-Focusing Geometries, Colloids Surf., A, 2017, 531, 111–120, DOI:10.1016/j.colsurfa.2017.07.083.
- C.-X. Zhao and A. P. J. Middelberg, Two-Phase Microfluidic Flows, Chem. Eng. Sci., 2011, 66(7), 1394–1411, DOI:10.1016/j.ces.2010.08.038.
- R. Seemann, M. Brinkmann, T. Pfohl and S. Herminghaus, Droplet Based Microfluidics, Rep. Prog. Phys., 2012, 75(1), 016601, DOI:10.1088/0034-4885/75/1/016601.
- S.-Y. Teh, R. Lin, L.-H. Hung and A. P. Lee, Droplet Microfluidics, Lab Chip, 2008, 8(2), 198–220, 10.1039/B715524G.
- S. Seo, M. Nguyen, M. Mastiani, G. Navarrete and M. Kim, Microbubbles Loaded with Nickel Nanoparticles: A Perspective for Carbon Sequestration, Anal. Chem., 2017 DOI:10.1021/acs.analchem.7b02205.
- C. Berkland, K. Kim and D. W. Pack, Fabrication of PLG Microspheres with Precisely Controlled and Monodisperse Size Distributions, J. Controlled Release, 2001, 73(1), 59–74 CrossRef CAS PubMed.
- H. Lee, J. Kim, H. Kim, J. Kim and S. Kwon, Colour-Barcoded Magnetic Microparticles for Multiplexed Bioassays, Nat. Mater., 2010, 9(9), 745–749, DOI:10.1038/nmat2815.
- W. J. Duncanson, T. Lin, A. R. Abate, S. Seiffert, R. K. Shah and D. A. Weitz, Microfluidic Synthesis of Advanced Microparticles for Encapsulation and Controlled Release, Lab Chip, 2012, 12(12), 2135–2145, 10.1039/c2lc21164e.
- G. T. Vladisavljević, N. Khalid, M. A. Neves, T. Kuroiwa, M. Nakajima, K. Uemura, S. Ichikawa and I. Kobayashi, Industrial Lab-on-a-Chip: Design, Applications and Scale-up for Drug Discovery and Delivery, Adv. Drug Delivery Rev., 2013, 65(11), 1626–1663, DOI:10.1016/j.addr.2013.07.017.
- S. Iwanaga, N. Saito, H. Sanae and M. Nakamura, Facile Fabrication of Uniform Size-Controlled Microparticles and Potentiality for Tandem Drug Delivery System of Micro/Nanoparticles, Colloids Surf., B, 2013, 109, 301–306, DOI:10.1016/j.colsurfb.2013.04.007.
- I. Shestopalov, J. D. Tice and R. F. Ismagilov, Multi-Step Synthesis of Nanoparticles Performed on Millisecond Time Scale in a Microfluidic Droplet-Based System, Lab Chip, 2004, 4(4), 316–321, 10.1039/b403378g.
- L.-H. Hung, K. M. Choi, W.-Y. Tseng, Y.-C. Tan, K. J. Shea and A. P. Lee, Alternating Droplet Generation and Controlled Dynamic Droplet Fusion in Microfluidic Device for CdS Nanoparticle Synthesis, Lab Chip, 2006, 6(2), 174–178, 10.1039/b513908b.
- D. K. Hwang, D. Dendukuri and P. S. Doyle, Microfluidic-Based Synthesis of Non-Spherical Magnetic Hydrogel Microparticles, Lab Chip, 2008, 8(10), 1640–1647, 10.1039/B805176C.
- N. J. Carroll, S. B. Rathod, E. Derbins, S. Mendez, D. A. Weitz and D. N. Petsev, Droplet-Based Microfluidics for Emulsion and Solvent Evaporation Synthesis of Monodisperse Mesoporous Silica Microspheres, Langmuir, 2008, 24(3), 658–661, DOI:10.1021/la7032516.
- S. Tasoglu, U. A. Gurkan, S. Wang and U. Demirci, Manipulating Biological Agents and Cells in Micro-Scale Volumes for Applications in Medicine, Chem. Soc. Rev., 2013, 42(13), 5788–5808, 10.1039/c3cs60042d.
- K. V. I. S. Kaler and R. Prakash, Droplet Microfluidics for Chip-Based Diagnostics, Sensors, 2014, 14(12), 23283–23306, DOI:10.3390/s141223283.
- D. Belder, Microfluidics with Droplets, Angew. Chem., Int. Ed., 2005, 44(23), 3521–3522, DOI:10.1002/anie.200500620.
- H. Song, D. L. Chen and R. F. Ismagilov, Reactions in Droplets in Microfluidic Channels, Angew. Chem., Int. Ed., 2006, 45(44), 7336–7356, DOI:10.1002/anie.200601554.
- Z. T. Cygan, J. T. Cabral, K. L. Beers and E. J. Amis, Microfluidic Platform for the Generation of Organic-Phase Microreactors, Langmuir, 2005, 21(8), 3629–3634, DOI:10.1021/la0471137.
- A. C. Hatch, J. S. Fisher, S. L. Pentoney, D. L. Yang and A. P. Lee, Tunable 3D Droplet Self-Assembly for Ultra-High-Density Digital Micro-Reactor Arrays, Lab Chip, 2011, 11(15), 2509–2517, 10.1039/c0lc00553c.
- P. H. Hoang and L. Q. Dien, Fast Synthesis of an Inorganic–organic Block Copolymer in a Droplet-Based Microreactor, RSC Adv., 2014, 4(16), 8283–8288, 10.1039/c3ra45747h.
- Y. Chen, L. Wu and L. Zhang, Dynamic Behaviors of Double Emulsion Formation in a Flow-Focusing Device, Int. J. Heat Mass Transfer, 2015, 82, 42–50, DOI:10.1016/j.ijheatmasstransfer.2014.11.027.
- S. A. Nabavi, S. Gu, G. T. Vladisavljević and E. E. Ekanem, Dynamics of Double Emulsion Break-up in Three Phase Glass Capillary Microfluidic Devices, J. Colloid Interface Sci., 2015, 450, 279–287, DOI:10.1016/j.jcis.2015.03.032.
- D. Chong, X. Liu, H. Ma, G. Huang, Y. L. Han, X. Cui, J. Yan and F. Xu, Advances in Fabricating Double-Emulsion Droplets and Their Biomedical Applications, Microfluid. Nanofluid., 2015, 19(5), 1071–1090, DOI:10.1007/s10404-015-1635-8.
- W.-T. Wang, R. Chen, J.-H. Xu, Y.-D. Wang and G.-S. Luo, One-Step Microfluidic Approach for Controllable Production of Gas-in-Water-in-Oil (G/W/O) Double Emulsions and Hollow Hydrogel Microspheres, RSC Adv., 2014, 4(32), 16444–16448, 10.1039/c4ra01526f.
- K. Wang, K. Qin, T. Wang and G. Luo, Ultra-Thin Liquid Film Extraction Based on a Gas–liquid–liquid Double Emulsion in a Microchannel Device, RSC Adv., 2014, 5(9), 6470–6474, 10.1039/c4ra14489a.
- L. Bai, Y. Fu, S. Zhao and Y. Cheng, Droplet Formation in a Microfluidic T-Junction Involving Highly Viscous Fluid Systems, Chem. Eng. Sci., 2016, 145, 141–148, DOI:10.1016/j.ces.2016.02.013.
- S. S. Sebti, M. Mastiani, H. Mirzaei, A. Dadvand, S. Kashani and S. A. Hosseini, Numerical Study of the Melting of Nano-Enhanced Phase Change Material in a Square Cavity, J. Zhejiang Univ., Sci., A, 2013, 14(5), 307–316, DOI:10.1631/jzus.A1200208.
- S. Kashani, A. A. Ranjbar, M. M. Madani, M. Mastiani and H. Jalaly, Numerical Study of Solidification of a Nano-Enhanced Phase Change Material (NEPCM) in a Thermal Storage System, J. Appl. Mech. Tech. Phys., 2013, 54(5), 702–712, DOI:10.1134/S0021894413050027.
- S. Kashani, E. Lakzian, K. Lakzian and M. Mastiani, Numerical Analysis of Melting of Nano-Enhanced Phase Change Material in Latent Heat Thermal Energy Storage System, Therm. Sci., 2014, 18(suppl. 2), 335–345 CrossRef.
- S. Kashani, A. A. Ranjbar, M. Mastiani and H. Mirzaei, Entropy Generation and Natural Convection of Nanoparticle-Water Mixture (Nanofluid) near Water Density Inversion in an Enclosure with Various Patterns of Vertical Wavy Walls, Appl. Math. Comput., 2014, 226, 180–193, DOI:10.1016/j.amc.2013.10.054.
- M. Mastiani, S. S. Sebti, H. Mirzaei, S. Kashani and A. Sohrabi, Numerical Study of Melting in an Annular Enclosure Filled with Nanoenhanced Phase Change Material, Therm. Sci., 2015, 19(3), 1067–1076 CrossRef.
- M. Mastiani, M. M. Kim and A. Nematollahi, Density Maximum Effects on Mixed Convection in a Square Lid-Driven Enclosure Filled with Cu-Water Nanofluids, Adv. Powder Technol., 2017, 28(1), 197–214 CrossRef CAS.
- S. M. S. Murshed, S.-H. Tan and N.-T. Nguyen, Temperature Dependence of Interfacial Properties and Viscosity of Nanofluids for Droplet-Based Microfluidics, J. Phys. D: Appl. Phys., 2008, 41(8), 085502, DOI:10.1088/0022-3727/41/8/085502.
- S. M. S. Murshed, S. H. Tan, N. T. Nguyen, T. N. Wong and L. Yobas, Microdroplet Formation of Water and Nanofluids in Heat-Induced Microfluidic T-Junction, Microfluid. Nanofluid., 2009, 6(2), 253–259, DOI:10.1007/s10404-008-0323-3.
- R. Wang, Nanoparticles Influence Droplet Formation in a T-Shaped Microfluidic, J. Nanopart. Res., 2013, 15(12) DOI:10.1007/s11051-013-2128-x.
- P. Zhu, X. Tang and L. Wang, Droplet Generation in Co-Flow Microfluidic Channels with Vibration, Microfluid. Nanofluid., 2016, 20(3), 47, DOI:10.1007/s10404-016-1717-2.
- J. S. Eow, M. Ghadiri, A. O. Sharif and T. J. Williams, Electrostatic Enhancement of Coalescence of Water Droplets in Oil: A Review of the Current Understanding, Chem. Eng. J., 2001, 84(3), 173–192, DOI:10.1016/S1385-8947(00)00386-7.
- T. Cubaud, Deformation and Breakup of High-Viscosity Droplets with Symmetric Microfluidic Cross Flows, Phys. Rev. E: Stat., Nonlinear, Soft Matter Phys., 2009, 80(2), 026307, DOI:10.1103/PhysRevE.80.026307.
- B.-J. Jin, Y. W. Kim, Y. Lee and J. Y. Yoo, Droplet Merging in a Straight Microchannel Using Droplet Size or Viscosity Difference, J. Micromech. Microeng., 2010, 20(3), 035003, DOI:10.1088/0960-1317/20/3/035003.
- S. Zhao, W. Wang, M. Zhang, T. Shao, Y. Jin and Y. Cheng, Three-Dimensional Simulation of Mixing Performance inside Droplets in Micro-Channels by Lattice Boltzmann Method, Chem. Eng. J., 2012, 207, 267–277, DOI:10.1016/j.cej.2012.06.098.
- X. Chen and C. L. A. Ren, Microfluidic Chip Integrated with Droplet Generation, Pairing, Trapping, Merging, Mixing and Releasing, RSC Adv., 2017, 7(27), 16738–16750, 10.1039/c7ra02336g.
- K. Jiang, A. X. Lu, P. Dimitrakopoulos, D. L. DeVoe and S. R. Raghavan, Microfluidic Generation of Uniform Water Droplets Using Gas as the Continuous Phase, J. Colloid Interface Sci., 2015, 448, 275–279, DOI:10.1016/j.jcis.2015.02.023.
- B.-U. Moon, S. G. Jones, D. K. Hwang and S. S. H. Tsai, Microfluidic Generation of Aqueous Two-Phase System (ATPS) Droplets by Controlled Pulsating Inlet Pressures, Lab Chip, 2015, 15(11), 2437–2444, 10.1039/c5lc00217f.
- A. Shahriari, M. M. Kim, S. Zamani, N. Phillip, B. Nasouri and C. H. Hidrovo, Flow Regime Mapping of High Inertial Gas–liquid Droplet Microflows in Flow-Focusing Geometries, Microfluid. Nanofluid., 2016, 20(1), 20, DOI:10.1007/s10404-015-1671-4.
- Y. Song, A. Sauret and H. Cheung Shum, All-Aqueous Multiphase Microfluidics, Biomicrofluidics, 2013, 7(6), 061301, DOI:10.1063/1.4827916.
- B. Carroll and C. Hidrovo, Droplet Detachment Mechanism in a High-Speed Gaseous Microflow, J. Fluids Eng., 2013, 135(7), 071206, DOI:10.1115/1.4024057.
- P. Tirandazi and C. H. Hidrovo, Liquid-in-Gas Droplet Microfluidics; Experimental Characterization of Droplet Morphology, Generation Frequency, and Monodispersity in a Flow-Focusing Microfluidic Device, J. Micromech. Microeng., 2017, 27(7), 075020, DOI:10.1088/1361-6439/aa7595.
- B. D. Piorek, S. J. Lee, J. G. Santiago, M. Moskovits, S. Banerjee and C. D. Meinhart, Free-Surface Microfluidic Control of Surface-Enhanced Raman Spectroscopy for the Optimized Detection of Airborne Molecules, Proc. Natl. Acad. Sci. U. S. A., 2007, 104(48), 18898–18901, DOI:10.1073/pnas.0708596104.
- A. R. Wheeler, H. Moon, C. A. Bird, R. R. Loo, C. J. Kim, J. A. Loo and R. L. Garrell, Digital Microfluidics with In-Line Sample Purification for Proteomics Analyses with MALDI-MS, Anal. Chem., 2005, 77(2), 534–540, DOI:10.1021/ac048754+.
- M. B. Dolovich and R. Dhand, Aerosol Drug Delivery: Developments in Device Design and Clinical Use, Lancet, 2011, 377(9770), 1032–1045, DOI:10.1016/S0140-6736(10)60926-9.
- C. H. Ahn, J.-W. Choi, G. Beaucage, J. H. Nevin, J.-B. Lee, A. Puntambekar and J. Y. Lee, Disposable Smart Lab on a Chip for Point-of-Care Clinical Diagnostics, Proc. IEEE, 2004, 92(1), 154–173, DOI:10.1109/JPROC.2003.820548.
- Y. Song, M. Baudoin, P. Manneville and C. N. Baroud, The Air-Liquid Flow in a Microfluidic Airway Tree, Med. Eng. Phys., 2011, 33(7), 849–856, DOI:10.1016/j.medengphy.2010.10.001.
- C. H. Hidrovo, F.-M. Wang, J. E. Steinbrenner, E. S. Lee, S. Vigneron, C.-H. Cheng, J. K. Eaton and K. E. Goodson, Water Slug Detachment in Two-Phase Hydrophobic Microchannel Flows, 2005, pp. 709–715, DOI:10.1115/ICMM2005-75261.
- B. Carroll and C. Hidrovo, Droplet Collision Mixing Diagnostics Using Single Fluorophore LIF, Exp. Fluids, 2012, 53(5), 1301–1316, DOI:10.1007/s00348-012-1361-x.
- B. Carroll and C. Hidrovo, Experimental Investigation of Inertial Mixing in Colliding Droplets, Heat Transfer Eng., 2013, 34(2–3), 120–130, DOI:10.1080/01457632.2013.703087.
- G. A. Bach, D. L. Koch and A. Gopinath, Coalescence and Bouncing of Small Aerosol Droplets, J. Fluid Mech., 2004, 518, 157–185, DOI:10.1017/S0022112004000928.
- S. Bashir, J. M. Rees and W. B. Zimmerman, Simulations of Microfluidic Droplet Formation Using the Two-Phase Level Set Method, Chem. Eng. Sci., 2011, 66(20), 4733–4741, DOI:10.1016/j.ces.2011.06.034.
- X. Zhu, P. C. Sui and N. Djilali, Numerical Simulation of Emergence of a Water Droplet from a Pore into a Microchannel Gas Stream, Microfluid. Nanofluid., 2008, 4(6), 543–555, DOI:10.1007/s10404-007-0209-9.
- F. Guo and B. Chen, Numerical Study on Taylor Bubble Formation in a Micro-Channel T-Junction Using VOF Method, Microgravity Sci. Technol., 2009, 21(1), 51–58, DOI:10.1007/s12217-009-9146-4.
- X.-B. Li, F.-C. Li, J.-C. Yang, H. Kinoshita, M. Oishi and M. Oshima, Study on the Mechanism of Droplet Formation in T-Junction Microchannel, Chem. Eng. Sci., 2012, 69(1), 340–351, DOI:10.1016/j.ces.2011.10.048.
- M. D. Menech, P. Garstecki, F. Jousse and H. A. Stone, Transition from Squeezing to Dripping in a Microfluidic T-Shaped Junction, J. Fluid Mech., 2008, 595, 141–161, DOI:10.1017/S002211200700910X.
- S. Malekzadeh and E. Roohi, Investigation of Different Droplet Formation Regimes in a T-Junction Microchannel Using the VOF Technique in OpenFOAM, Microgravity Sci. Technol., 2015, 27(3), 231–243, DOI:10.1007/s12217-015-9440-2.
- M. Nekouei and S. A. Vanapalli, Volume-of-Fluid Simulations in Microfluidic T-Junction Devices: Influence of Viscosity Ratio on Droplet Size, Phys. Fluids, 2017, 29(3), 032007, DOI:10.1063/1.4978801.
- M. Azarmanesh and M. Farhadi, The Effect of Weak-Inertia on Droplet Formation Phenomena in T-Junction Microchannel, Meccanica, 2016, 51(4), 819–834, DOI:10.1007/s11012-015-0245-6.
- S. Bashir, J. M. Rees and W. B. Zimmerman, Investigation of Pressure Profile Evolution during Confined Microdroplet Formation Using a Two-Phase Level Set Method, Int. J. Multiphase Flow, 2014, 60, 40–49, DOI:10.1016/j.ijmultiphaseflow.2013.11.012.
- U. Sen, S. Chatterjee, S. Sen, M. K. Tiwari, A. Mukhopadhyay and R. Ganguly, Dynamics of Magnetic Modulation of Ferrofluid Droplets for Digital Microfluidic Applications, J. Magn. Magn. Mater., 2017, 421, 165–176, DOI:10.1016/j.jmmm.2016.07.048.
Footnote |
| † Electronic supplementary information (ESI) available. See DOI: 10.1039/c7ra09710g |
| This journal is © The Royal Society of Chemistry 2017 |

