 Open Access Article
Creative Commons Attribution 3.0 Unported Licence
Salinity effect on production of PHA and EPS by Haloferax mediterranei†
You-Wei Cui *a,
Xiao-Yu Gonga,
Yun-Peng Shia and
Zhiwu (Drew) Wangb
aNational Engineering Laboratory for Advanced Municipal Wastewater Treatment and Reuse Technology, College of Energy and Environmental Engineering, Beijing University of Technology, 100 Pingleyuan, Chaoyang District, Beijing 100124, China. E-mail: cyw@bjut.edu.cn
bOccoquan Laboratory, Department of Civil and Environmental Engineering, Virginia Polytechnic Institute and State University, 9408 Prince William St. Manassas, VA 20110-5670, USA
First published on 22nd November 2017
Abstract
The halophilic archaeon, Haloferax mediterranei, is able to produce polyhydroxyalkanoates (PHAs) in large quantities. Along with the synthesis of PHAs by H. mediterranei, an extracellular polymeric substance (EPS) is excreted as a byproduct, lowering the efficiency of the production of PHAs. In this experiment, salinity effects on the carbon distribution to synthesis of PHAs and/or EPS were explored in order to control their production. It was found that high NaCl concentrations inhibited the productivity of EPS while encouraging the productivity of PHAs. The optimal salinity for the growth and proliferation of H. mediterranei was in the range of 150–200 g L−1. EPS productivity decreased from 371.36 to 319.74 mg EPS per g CDW as the concentration of NaCl increased from 75 g L−1 to 250 g L−1. However, high salinity promoted the synthesis of PHAs. When the NaCl concentration was 250 g L−1, the intracellular content of PHAs reached a maximum of 71.1%. This result indicated that a high NaCl concentration significantly stimulated the production of PHAs while depressing the production of EPS. This study provided a possible solution to adjust the carbon distribution to the synthesis of PHAs and EPS by H. mediterranei by controlling the concentration of NaCl.
Introduction
Polyhydroxyalkanoates (PHAs) are a family of intracellular polymers synthesized by various eubacteria and haloarchaeal species under conditions where there is a lack of nutrients for cell proliferation.1 PHAs are considered as an ideal substitute for plastics produced from petroleum due to their multidimensional physical properties, such as biodegradability, biocompatibility, non-toxicity and thermo-plasticity.1–3 These properties of PHAs also promote their application in medical and health care fields such as bone replacement, artificial blood vessels and scaffold materials.1,4 Due to the limit of high commercial cost, the production of low-cost PHAs has become a focus of current research in order to boost its wide application.5,6Haloferax mediterranei, an extreme halophilic archaeon, is reported to have the ability to accumulate PHA at high cell densities.7 The highly saline environment where Haloferax mediterranei survives, excludes the growth of the other microbes in open culture, which greatly reduces sterilization costs.8 In addition, H. mediterranei has a faster growth rate and a remarkable metabolic capacity than other halophilic bacteria under highly saline conditions.9 These advantages provide the potential for low-cost biosynthesis of PHAs by H. mediterranei.
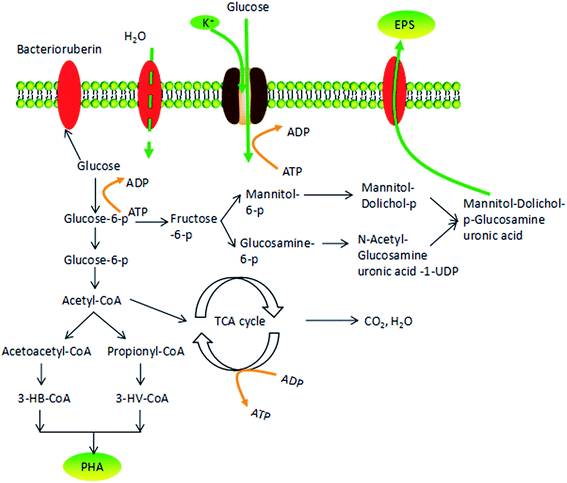
H. mediterranei secretes extracellular polymeric substance (EPS) during the production of PHAs regardless of the applied carbon sources used,10 which is considered as “an inherent disadvantage when using H. mediterranei for PHAs production”.11 The metabolic pathway for the production of EPS and PHAs by H. mediterranei using glucose has been reported, revealing their competition for external carbon.12,13 Glucose-6-phosphate is broken down into acetyl CoA, then into acetoacetyl-CoA, before being synthesized into PHAs. In the meantime, glucose-6-phosphate can partly decompose the intermediate metabolite fructose-6-phosphate and finally fructose-6-phosphate is used in EPS synthesis.13 Competition for glucose-6-phosphate increases substrate consumption and production cost. Furthermore, due to the high viscosity of EPS, mass transfer of oxygen, carbon and other nutrients can be hindered,13,14 increasing energy consumption and lowering the efficiency of PHA synthesis. Therefore, it is necessary to regulate EPS synthesis to harvest the target PHA product efficiently and cost-effectively.
Some parameters such as temperature,15 ratio of carbon and nitrogen (C/N) in the feed12,16 and carbon types17 have been investigated to explore their contribution to PHA production, which have provided some clues to maximize PHA production. In our previous study, the effects of C/N in feed on the simultaneous production of PHAs and EPS by H. mediterranei were explored via the developed model, shedding light on the regulation of PHA and EPS production.17 To the best of our knowledge, no effective regulation controlling the synthesis of EPS has been proposed until now.
This study aimed to explore the contribution of salinity to the regulation of EPS production by H. mediterranei when PHA was targeted as the end product. The effects of salinity on the synthesis of PHAs and EPS by H. mediterranei were fully investigated. With the optimal growth salinity as the control, a comparison of EPS and PHA production under high and low salinities was performed via both fermentation performance and calculating kinetic values.
Material and method
Strain culture
H. mediterranei (ATCC 33500) was obtained from the China General Microbiological Culture Collection Center (CGMCCC) in Beijing, China. CM media was used for strain activation and culture. The CM medium was composed of casamino acids (7.5 g L−1), yeast extract (10 g L−1), sodium citrate (3 g L−1), MgSO4·7H2O (20 g L−1), KCl (2 g L−1), FeSO4 (10 mg L−1), NaCl (150 g L−1) and agar (15 g L−1). The pH of CM was adjusted to 7.2 by adding NaOH solution. After strain activation, liquid CM solution without agar was used for cultivation shaking at 37 °C with shaking at 150 rpm.15Cultivation method
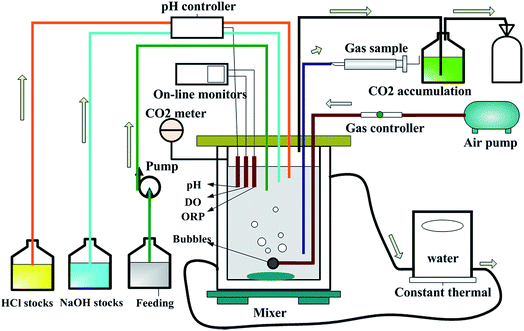
The cultivated H. mediterranei strain was inoculated into eight identical air lift fermenters with a working volume of 1.2 L. A diagram of the fermenter showing the control and on-line monitoring equipment is presented in Fig. 1. Four groups of experiments with different salinities (75, 150, 200 and 250 g NaCl per L) were carried out and each condition was repeated twice. The same aeration rate was supplied in each fermenter. The DO was monitored by WTW meters (Multi 3420 set B, Germany), which was control at 100% via a gas control device. Except for NaCl concentration, the feeds for the four experimental groups had the same composition. One liter feed contained 13 g MgCl2·6H2O, 0.69 g CaCl2·2H2O, 4 g KCl, 20 g MgSO4·7H2O, 0.25 g NaHCO3, 0.5 g NaBr, 10 g glucose, 0.48 g NH4Cl12 and 1 mL of SL-6 trace element solution.18 The C/N ratio in the feeds was maintained at approximately 20, which was determined based on previous research.12 Throughout the fermentation process, pH was maintained at 7.2 ± 0.1 using a pH controller (SC-200, Si Chen Apparatus Science and Technology Limited Company, China). The temperature was controlled at 37 °C by a thermal water circulation bath (Guohua Electric Appliance Limited Company, China). The fermentation reaction was run continually for 3 days. At scheduled time intervals samples were taken to measure the cell dry weight (CDW), PHA content, EPS, and the COD and nitrogen concentration in the solution.Chemical analysis
To determine the CDW, 5 mL of the sampled liquid culture was centrifuged at 3820 rcf for 10 min (HERMLE Labortechnik GmbH Z 206 A, German) and the supernatant was discarded. The remaining pellet was washed twice with distilled water to remove salts. The pellet was dried in a drying oven at 105 °C to a constant mass. The sampled mixed liquid was centrifuge at 3820 rcf for 10 min. The supernatant was filtered through a 0.45 mm microporous membrane (Jinteng PES, China). The filtrate was used for the determination of COD and ammonia nitrogen concentration according to standard methods.19Polyhydroxybutyrate (PHB) and polyhydroxyvalerate (PHV) were measured according to the method of Cui et al. using gas chromatography analysis (7890A, Agilent, USA).12 The mixed liquid samples (30 mL) were centrifuged at 3820 rcf for 10 minutes. The supernatant was discarded and the pellets were collected. The pellets were then dissolved in distilled water to the initial volume, and 1 mL of sodium hypochlorite solution (10%, w/v) was added to inactivate the cells. The following operation was carried out in accordance with previous literature.12
The formaldehyde sodium hydroxide method was used to extract the EPS.20 Firstly, a mixed liquid sample of 10 mL was centrifuged at 3820 rcf for 10 minutes, and the supernatant was discarded. Secondly, the pellets were resuspended in a neutral phosphate buffer solution (2 mmol L−1 Na3PO4, 4 mmol L−1 NaH2PO4, 9 mmol L−1 NaCl and 1 mmol L−1 KCl). The sample was centrifuged again as mentioned above and pellets were collected. Then the pellets were vortex mixed for one hour after the addition of 0.60 mL formaldehyde (37%). Finally, 4 mL NaOH solution (1 mol L−1) was added and vortex mixed for 3 h. The supernatant was filtered through a 0.45 mm microporous membrane (Jinteng PES, China) and the treated sample was then centrifuged at 3820 rcf for 10 minutes. Polysaccharide (PS) and protein (PN) contents were determined according to reported methods.21,22 The sum of PS and PN is regarded as the mass of the EPS.
Calculations
The specific growth rate (μ, h−1) was calculated by eqn (1).
 | (1) |
The PHA cell content (XPHA, mg PHA per mg CDW) was calculated as the percentage of CDW in eqn (2).
| XPHA = mg PHA/mg CDW × 100 | (2) |
The specific PHA synthesis rate (qPHA, h−1) during fermentation was calculated by the increase of PHA cell content in eqn (3).
 | (3) |
The EPS concentration was standardized as the expression of EPS concentration per milligram of CDW (mg EPS per mg CDW). Since the sodium hypochlorite solution used to deactivate the cell could lead to detachment of some EPS,23 the CDW weight was the sum of cells, PHA and a fraction of the EPS. The substrate utilization efficiencies for biological processes such as the cell growth, PHA accumulation and EPS accumulation were expressed as YCDW, YPHA and YEPS, which was calculated by the developed model.12 The kinetic parameters were determined using Matlab-Simulink (Version R2012b).
Results
Microbial proliferation
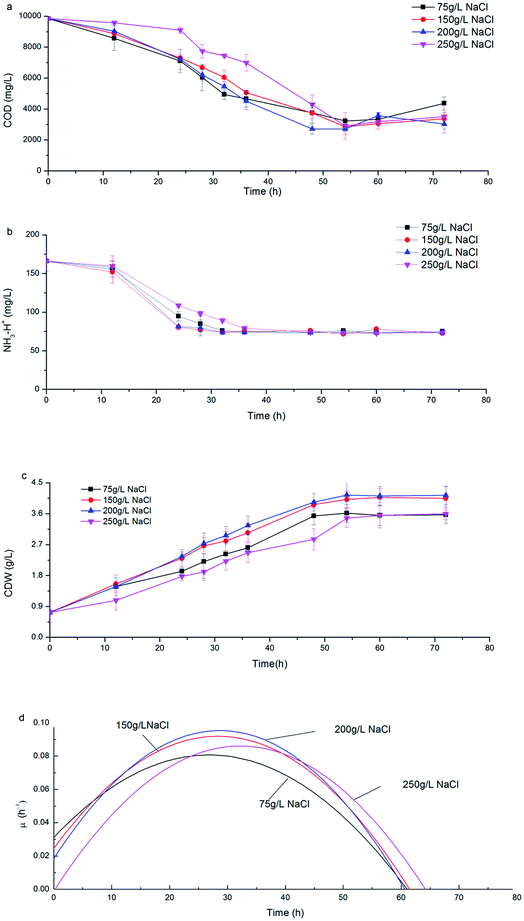
Along with the consumption of COD and ammonia nitrogen, CDW increased with a similar trend under various salinities (Fig. 2a–c). During the initial 24 h, H. mediterranei was in the logarithmic growth phase with rapid substrate consumption (Fig. 2c) and the specific growth rate (μ) continuously increased to a maximum (Fig. 2d). When fermentation continued to 36 h, the cell growth rate was stable with the maximal μ due to limited nitrogen. After 36 h fermentation, H. mediterranei entered the stationary growth phase, where μ continuously decreased (Fig. 2d) and the maximal CDW was harvested (Fig. 2c). A conspicuous phenomenon that was observed was the increasing secretion of a red pigment when H. mediterranei stains were fermented with 75 g L−1 NaCl.The effect of salinity on the growth of H. mediterranei can be observed since NaCl concentration was the sole variable in all experiments. The maximal CDW increased from 3.62 g L−1 to 4.15 g L−1 as salinity increased from 75 g L−1 to 200 g L−1 (Fig. 2c). When salinity increased to 250 g L−1, the maximal CDW decreased to 3.6 g L−1, which was only 87% of maximal CDW harvested at 200 g L−1 NaCl. The maximum μ of 0.096 h−1 was observed at 200 g L−1 NaCl, an increase of greater than 5% of that at 75 g L−1 NaCl and 13% of that at 250 g L−1 NaCl salinity. This result indicated the optimal growth salinity of H. mediterranei was in range of 150–200 g L−1, consistent with a report by D'Souza et al.24 The results indicated that lower or higher salinity than the optimal growth salinity could inhibit the growth of H. mediterranei, which resulted in lower biomass production.
PHAs production
Fig. 3a shows the dynamics of PHA production along with fermentation time at various salinities. During the first 12 h of fermentation, the PHA content at the four salinities decreased, probably due to adaptation to a new environment after strains were inoculated into the fermentation substrate. Following this, PHA contents increased continuously to the maximum. It can be observed that the dynamics of PHA content at 150 g L−1 and 200 g L−1 NaCl salinities showed similar tendencies to the maximal PHAs cell content of 57.7% and 61.1% mg PHA per mg CDW after 48 hour fermentation, respectively. The maximal PHA cell content under 75 g L−1 salinity was 46.7% mg PHAs per mg CDW after 55 hour fermentation, which was a decrease of 23.6% mg PHAs per mg CDW compared with that seen at 200 g L−1 NaCl. The elevated maximal PHA cell content of 71.1% mg PHAs per mg CDW was found at 250 g L−1 NaCl salinity. Despite the maximal PHA cell content being reached at different fermentation times, the times of harvesting the maximal PHA content at the four salinities all corresponded to the end of the exponential growth phase (Fig. 2a and b). After the substrate has been completely consumed, stored PHAs were used as a carbon and energy source. The PHV contents in the produced PHAs were similar at four salinities, and ranged from 8.93–12.67%, indicating salinity had limited influence on the product composition. According to the previously developed model,12 the specific PHA synthesis rate (qPHA) during fermentation was simulated in Fig. 3b. The maximal PHA specific synthesis rate (qPHA, max) under the four conditions with increasing salinities were 0.0013 h−1, 0.0024 h−1, 0.0028 h−1 and 0.0019 h−1 at salinity of 75 g L−1, 150 g L−1, 200 g L−1 and 250 g L−1, respectively. The low specific PHA production rate could be induced by the low substance consumption rate in the high salinity. The high salinity inhibited the substance consumption rate, which provided the longer feast time than the low salinity context. The low substance consumption rate contributed to the low PHA production rate. The results indicated that salinity higher or lower than the optimal growth salinity inhibited qPHA, although the maximal PHA cell content was found at high salinities.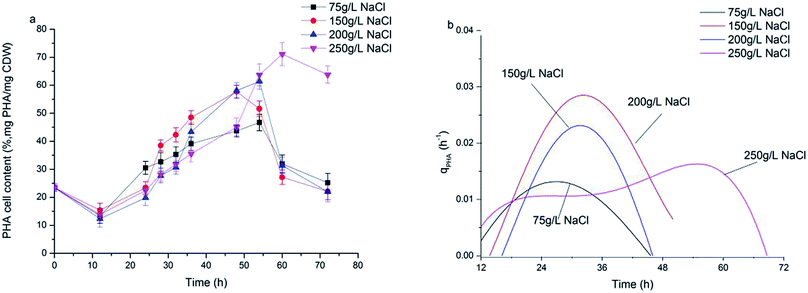 | ||
| Fig. 3 The synthesis of PHA at different NaCl concentrations. (a) PHA content in the cell (mg PHA per mg CDW); (b) PHA specific synthesis rate (qPHA). | ||
EPS biosynthesis
EPS biosynthesis at various NaCl salinities and fermentation times showed similar trends (Fig. 4). During the initial 28 h of fermentation, the EPS concentration at four NaCl salinities decreased, when the cells were in the logarithmic growth phase (Fig. 2c and d). Increased EPS production was found at stationary phase and EPS production reached a maximum at cell death phase (Fig. 2d). The results indicated that limited nutrients in the substrate could stimulate EPS synthesis. Salinities had a reduced influence on the maximal EPS production (Fig. 4). The maximal EPS productions at the four salinities were 371.36, 345.56, 313.93, 319.74 mg EPS per g CDW at salinity of 75 g L−1, 150 g L−1, 200 g L−1 and 250 g L−1, respectively. Low salinity supported high EPS synthesis by H. mediterranei. It can be found that an increase in EPS production was induced mainly by polysaccharide synthesis since the protein contents remained relatively stable during the whole batch fermentation (Fig. 4).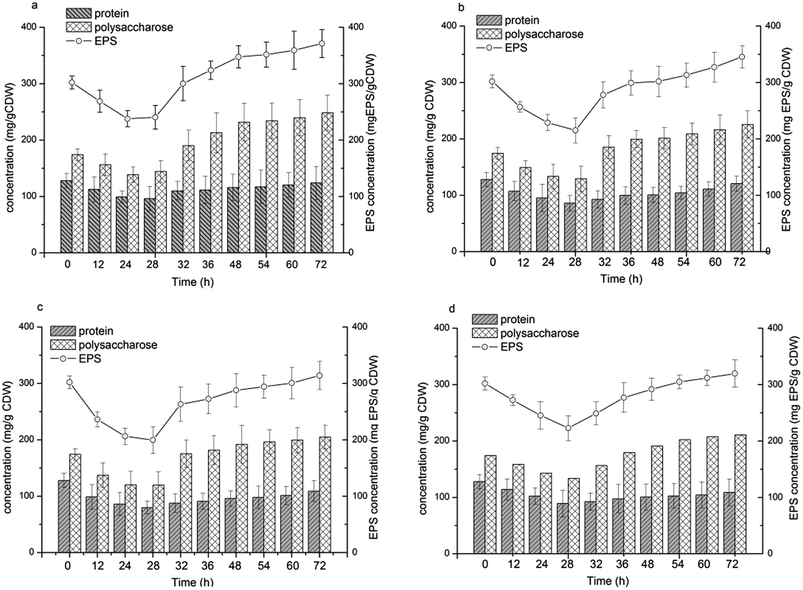 | ||
| Fig. 4 EPS concentration and the composition of polysaccharide and protein in EPS under different NaCl concentrations. (a) 75 g L−1 NaCl; (b) 150 g L−1 NaCl; (c) 200 g L−1 NaCl; (d) 250 g L−1 NaCl. | ||
Discussion
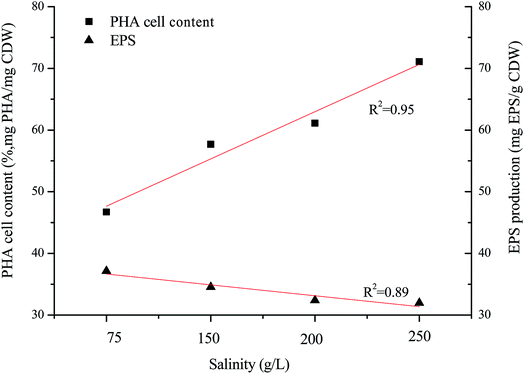
H. mediterranei is a halophile that requires high salt media for growth and survival, and has special osmosensors and osmoregulators.25 There is an optimal salinity for growth because the cell membrane shows adaptive changes in the face of altered salinity.26 In this study, the optimal growth salinity of H. mediterranei was 200 g L−1 in accordance with a previous report.24 Under conditions of non-optimal salinity, the growth of H. mediterranei was inhibited. The inhibition of cell growth by NaCl salinity could be induced by the different adaptive mechanisms to osmotic pressure under conditions lower or higher than the optimal growth salinity. The increasing secretion of a red pigment was observed when H. mediterranei stains were fermented with 75 g L−1 NaCl. Red pigment in halophiles functions to stabilize the plasma membrane and to prevent cell lysis under low osmotic pressure.27 The secretion of the red pigment is a response to stress, indicating that under low salt concentrations H. mediterranei struggled to regulate internal osmotic pressure. This phenomenon was not observed when salinity increased to 250 g L−1. The difference under low and high salinity implies that growth inhibition under high salinity was not related to an adaptation to different osmotic pressures. It was reported that high salinity decreases the solubility of oxygen in the fermentation solution,28 which may be one reason for the growth inhibition.Generally, it is assumed that stress conditions can alter polymer production and stimulate degradation potential to improve bacterial survival. The degradation ability of the strain showed negligible changes according to the profiles of substrate degradation (Fig. 2). PHA accumulation and EPS secretion, as significant stress responses, were observed in this study. The maximal PHA cell content increased along with increasing salinity, while the maximal EPS production decreased with increasing salinity, both showing a linear relationship to salinity (Fig. 5). It is well known that PHAs are stored as intracellular carbon and energy reserves under unbalanced or non-optimal growth conditions.1,2 Non-optimal growth salinities stimulated an increase of PHA storage according to this theory. However, the increase of PHA storage was found only at the salinity higher than the optimal growth salinity in this study, indicating the low salinity hinders the synthesis of PHA. In most studies, the stress response was accompanied by PHB degradation as halophiles respond to an exposure to osmotic stress by augmenting cellular trehalose content whose synthesis proceeds simultaneously with the breakdown of PHB.29,30 PHA in H. mediterranei is degraded to increase trehalose content and resist salt stress. At the same time, under conditions of low salinity bacteria synthesize more bacterioruberin (for example, red pigment) to prevent an influx of water, protecting H. mediterranei from lysis.
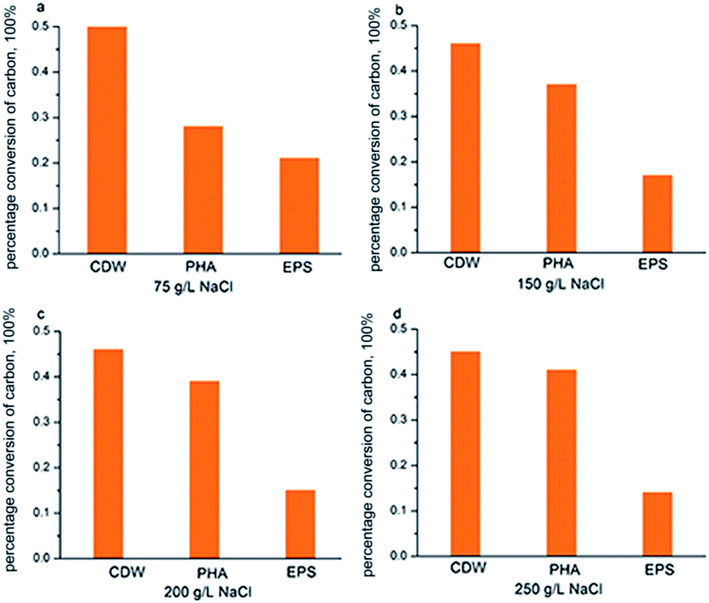
According to Fig. 7, COD consumption of the substrate should be reflected in the sum of those factors that contributed to new cell growth, PHA synthesis and EPS production. Fig. 6 shows the COD flow through these three pathways in H. mediterranei over the 10 hour cultivation period. Compared to low NaCl salinities (75 g L−1 and 150 g L−1 salinities), the carbon flow into growth maintained equal, which also supported by the CDW in both salinities (Fig. 2c). A difference in conversion of carbon can be observed between PHA and EPS synthesis. At high salinities, more carbon flow was converted into PHA rather than EPS. This result implies that PHA was stored because of the inhibition of EPS production, not because of the inhibition of growth in response to high salinity.
Osmotic pressure changes influence cell metabolism, including cell growth and polymer production. Fig. 7 shows the possible response mechanism of H. mediterranei to osmotic pressure, illustrating the decomposition pathway of glucose in cells.31 In the context of high salinity, the K+ transporter Trk AG/H accumulates more K+ in response to high salinity.32 In this process, ATP is used to provide energy, which causes a competitive relationship with glucose decomposition and polymer synthesis that need ATP to provide energy. This phenomenon leads to a decrease in glucose utilization. Considering that high osmotic pressure inhibits respiration, glucose tends to flow to polymer storage (PHA synthesis or EPS synthesis). However, since EPS production requires more energy than PHA synthesis, carbon was diverted to synthesize PHA instead of EPS, resulting in increased production of PHA and decreased amounts of EPS. High salinity promoted the transformation of the carbon source to PHA by disrupting EPS synthesis. Under low salt concentrations, more bacterioruberin in the cell membrane was synthesized, which was able to prevent the flow of water inside the membrane. Relatively high amounts of glucose were converted to bacterioruberin and most of the carbon source was used for cell proliferation and bacterioruberin synthesis.
H. mediterranei is an extremely halophilic archaeon that can accumulate significant amounts of PHAs.13 This strain is of interest for PHA production from waste materials by virtue of its low sterility demand in high salt cultivation environment. PHA produced in H. mediterranei was easily recovered by lysis with fresh water.13 Up to now, a variety of waste materials have been found to be effective for PHA production by H. mediterranei with low risk of contamination. They include stillage from the rice-based ethanol industry,8 whey lactose,33 extruded starch,34 extruded rice bran,11 vinasse,35 crude glycerol phase36 and molasses.15 Using these carbon sources, the PHA produced by H. mediterranei was found to be a co-polymer of poly(3-hydroxybutyrate-co-3-hydroxyvalerate) P(3HB-co-3HV). In addition, PHA volumetric productivity was reported to be 90–360 mg (L−1 h−1) depending on the fermentation condition and carbon source. However, the drawbacks of utilizing H. mediterranei are the simultaneous synthesis of EPS,37 which increases substrate consumption and production cost. This study proved that salinity can regulate the production of PHA and EPS. This means that salinity can be used as a control parameter to regulate the production of EPS by H. mediterranei when PHA is the targeted end product. It is of great importance to utilize H. mediterranei to produce low-cost polymers.
Conclusion
This study explored the effects of NaCl salinities on the production of PHA and EPS by H. mediterranei. Based on the production and yield of polymers, we found that salinity can regulate PHA and EPS production. Specific responses to low or high osmotic pressures were also established by performance tests and model analysis in this study. This study provides a possible solution to regulate EPS production when PHA is the targeted product, which boosts the application of H. mediterranei as good PHA producer. A possible mechanism that explains the polymer production of H. mediterranei in response to osmotic pressure was also proposed in this study. Further studies are needed to explore the inhibition mechanism of salinity on EPS synthesis and the relation between adaption to osmotic pressure and the polymer synthesis pathway, which will contribute to greater insights about H. mediterranei.Conflicts of interest
There are no conflicts to declare.Acknowledgements
This research was supported by the National Natural Science Foundation of China (Project No. 51478011).References
- A. Shrivastav, S. K. Mishra and S. Mishra, Int. J. Biol. Macromol., 2010, 46, 255–260 CrossRef CAS PubMed.
- C. S. Reddy, R. Ghai, Rashmi and V. C. Kalia, Bioresour. Technol., 2003, 87, 137–146 CrossRef CAS PubMed.
- F. Masood, T. Yasin and A. Hameed, Crit. Rev. Biotechnol., 2015, 35, 514–521 CrossRef PubMed.
- J. Lu, R. C. Tappel and C. T. Nomura, Polym. Rev., 2009, 49, 226–248 CrossRef CAS.
- V. Singh, D. K. Chaudhary, I. Mani and P. K. Dhar, Renewable Sustainable Energy Rev., 2016, 60, 1–10 CrossRef.
- M. Koller, L. Maršálek, M. M. de Sousa Dias and G. Braunegg, New Biotechnol., 2017, 37, 24–38 CrossRef CAS PubMed.
- J. Hou, B. Feng, J. Han, H. Liu, D. Zhao, J. Zhou and H. Xiang, Appl. Environ. Microbiol., 2013, 79, 5104–5111 CrossRef CAS PubMed.
- A. Bhattacharyya, J. Saha, S. Haldar, A. Bhowmic, U. K. Mukhopadhyay and J. Mukherjee, Extremophiles, 2014, 18, 463–470 CrossRef CAS PubMed.
- J. Han, F. Zhang, J. Hou, X. Liu, M. Li, H. Liu, L. Cai, B. Zhang, Y. Chen, J. Zhou, S. Hu and H. Xiang, J. Bacteriol., 2012, 194, 4463–4464 CrossRef CAS PubMed.
- J. Antón, I. Meseguer and F. Rodríguezvalera, Appl. Environ. Microbiol., 1988, 54, 2381–2386 Search PubMed.
- T. Huang, K. Duan, S. Huang and C. W. Chen, J. Ind. Microbiol. Biotechnol., 2006, 33, 701–706 CrossRef CAS PubMed.
- Y. Cui, Y. Shi and X. Gong, RSC Adv., 2017, 7, 18953–18961 RSC.
- D. Zhao, L. Cai, J. Wu, M. Li, H. Liu, J. Han, J. Zhou and H. Xiang, Appl. Microbiol. Biotechnol., 2013, 97, 3027–3036 CrossRef CAS PubMed.
- P. Mishra, P. Srivastava and S. Kundu, World J. Microbiol. Biotechnol., 2005, 21, 525–530 CrossRef CAS.
- Y.-W. Cui, H.-Y. Zhang, S.-Y. Ji and Z.-W. Wang, J. Polym. Environ., 2017, 25, 277 CrossRef CAS.
- V. Vinish, S. H. Sangeetha, J. Aravind, P. Kanmani and T. Sathiskumar, Int. J. Environ. Sci. Technol., 2015, 12, 2757–2764 CrossRef CAS.
- Y. Cui, H. Zhang, P. Lu and Y. Peng, Sci. Rep., 2016, 6, 30766 CrossRef CAS PubMed.
- J. Anton, I. Meseguer and F. Rodriguezvalera, Appl. Environ. Microbiol., 1988, 54, 2381–2386 CAS.
- A. D. Eaton, L. S. Clesceri and A. E. Greenberg, Standard methods for the examination of water and wastewater, American Public Health Association APHA, Washington, 20th edn, 1998 Search PubMed.
- H. Liu and H. H. P. Fang, J. Biotechnol., 2002, 95, 249–256 CrossRef CAS PubMed.
- M. Sajjad and K. S. Kim, Int. J. Environ. Sci. Technol., 2016, 13, 1697–1706 CrossRef CAS.
- S. S. Adav and D. Lee, J. Hazard. Mater., 2008, 154, 1120–1126 CrossRef CAS PubMed.
- K. Gobi and V. M. Vadivelu, Bioresour. Technol., 2015, 189, 169–176 CrossRef CAS PubMed.
- S. E. D'Souza, W. Altekar and S. F. D'Souza, Arch. Microbiol., 1997, 168, 68–71 CrossRef.
- J. M. Wood, Sci. STKE, 2006, 2006, e43 Search PubMed.
- N. J. Russell, J. Bioenerg. Biomembr., 1989, 21, 93–113 CrossRef CAS PubMed.
- L. Huang and A. Haug, Biochim. Biophys. Acta, 1974, 352, 361–370 CrossRef CAS.
- P. Passanha, G. Kedia, R. M. Dinsdale, A. J. Guwy and S. R. Esteves, Bioresour. Technol., 2014, 163, 287–294 CrossRef CAS PubMed.
- D. Kadouri, E. Jurkevitch and Y. Okon, Appl. Environ. Microbiol., 2003, 69, 3244–3250 CrossRef CAS PubMed.
- D. Kadouri, E. Jurkevitch and Y. Okon, Arch. Microbiol., 2003, 180, 309–318 CrossRef CAS PubMed.
- J. Meury, FEMS Microbiol. Lett., 1994, 121, 281–286 CrossRef CAS PubMed.
- J. M. Wood, in Methods in Enzymology, ed. D. Haussinger and H. Sies, 2007, vol. 428, pp. 77–107 Search PubMed.
- M. Koller, A. Atlic, Y. Gonzalez-Garcia, C. Kutschera and G. Braunegg, Macromol. Symp., 2008, 272, 87–92 CrossRef CAS.
- C. W. Chen, T. Don and H. Yen, Process Biochem., 2006, 41, 2289–2296 CrossRef CAS.
- A. Bhattacharyya, A. Pramanik, S. K. Maji, S. Haldar, U. K. Mukhopadhyay and J. Mukherjee, AMB Express, 2012, 2, 34 CrossRef PubMed.
- C. Hermann-Krauss, M. Koller, A. Muhr, H. Fasl, F. Stelzer and G. Braunegg, Archaea, 2013, 2013, 1–10 CrossRef PubMed.
- M. Koller, Chem. Biochem. Eng. Q., 2015, 29, 87–98 CrossRef CAS.
Footnote |
| † Electronic supplementary information (ESI) available. See DOI: 10.1039/c7ra09652f |
| This journal is © The Royal Society of Chemistry 2017 |

