 Open Access Article
Creative Commons Attribution 3.0 Unported Licence
A general synthesis of abundant metal nanoparticles functionalized mesoporous graphitized carbon†
Tao Wang a,
Yan Suna,
Ang Lia,
Yali Maa,
Danyang Fenga,
Youxing Fangb,
Yunling Liu
 a,
Qisheng Huoa,
Zhen-An Qiao
 *a and
Sheng Dai
 c
c
aState Key Laboratory of Inorganic Synthesis and Preparative Chemistry, Jilin University, Changchun, Jilin 130012, China. E-mail: qiaozhenan@jlu.edu.cn
bState Key Laboratory of Electroanalytical Chemistry, Changchun Institute of Applied Chemistry, Chinese Academy of Science, 5625 Renmin Street, Changchun, Jilin 130022, China
cChemical Sciences Division, Oak Ridge National Laboratory, Oak Ridge, TN 37831, USA
First published on 1st November 2017
Abstract
The abundant transition metal and carbon sources allow imaginative combinations to design porous functional metal–carbon composites for wide applications. However, cumbersome and restricted methods seriously limit the development of mesoporous metal–carbon composites. In this study, a general coordination–polymerization method is reported to construct metal–gallic acid resin, and mesoporous carbon with highly dispersed metal nanoparticles and high metal nanoparticle concentration up to 20 wt%. The metal element composited with polymer and carbon can be various transition metals containing Ti, V, Cr, Mn, Fe, Co, Ni, Cu, and Zn. Furthermore, the general strategy can be expanded to the fabrication of N doped bimetallic catalyst FeCo–MCN-900, which shows comparable electrocatalytic activity and higher stability compared to commercial Pt/C.
1. Introduction
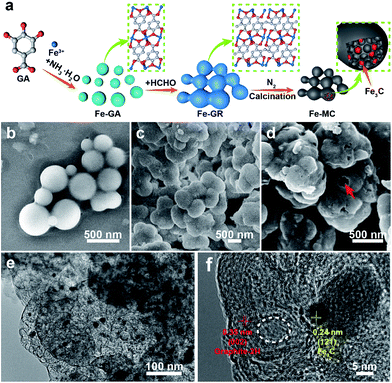
The development of society is heavily dependent on energy conversion and storage.1,2 As potential power sources, fuel cells powered by hydrogen from secure and renewable sources are the ideal solution for non-polluting vehicles, but demand highly efficient catalysts for anodic and cathodic reactions.3–7 Though Pt and its alloy meet the requirement of high activity, poor long-term duration and low abundant of Pt in nature restrict the practical large-scale commercialization of fuel cells.6,8–11 Scientists have invested much time and energy in getting candidates for Pt, such as non-precious-metal catalysts and metal free heteroatom-doped carbon materials.12–20 It is noteworthy that the abundant transition metal and carbon sources allow imaginative combinations to form porous functional metal–carbon composites and show comparable activity as commercial Pt/C catalyst.21–29 For example, He's group reported a hybrid material (Co–W–C/N) with tungsten carbide and cobalt nanoparticles encapsulated in an N-doped porous carbon framework, which exhibited excellent electrocatalytic activity and high stability.30 Mesoporous carbons (MCs) derived from polymers are a class of vibrant support materials that combine efficient mass transfer efficiency with good electrical conductivity.31–35 MCs with the critical sites such as metal nanoparticles and pyridinic N have been reported as efficient catalysts.36–44 There is still a problem in the reconciliation of high metal content (>10 wt%) and highly dispersed metal nanoparticles (<100 nm) supported by carbon materials. To this end, metal–ligand coordination materials including metal–organic frameworks (MOFs) and amorphous coordination compounds constructed by metal (clusters) and carboxylate or/and N-involved ligand with huge diversity and uniform heteroatom decoration, intuitively should be a class of available precursors to produce metal-rich carbon catalysts.22,36–44 However, the poor thermal stability of coordination materials generally leads to the failure of the conversion to metal-rich carbon catalysts.37,41,45 How to stabilize coordination materials is still a burning question that waiting for a new and effective solution.Merging concepts and tools from different methodologies is an important approach to develop defined functional materials targeting selected applications. Herein, we reported a general coordination–polymerization strategy combining flexible coordination mode with stable polymer network to construct metal–gallic acid resin (X–GR) and mesoporous carbon materials with high metal nanoparticle concentration as efficient ORR catalysts. As shown in Fig. 1a, gallic acid (GA) and FeIII were typically chosen as the organic ligand and the metal ions to form iron gallate (Fe–GA) nanoparticles at certain pH value. The coordination Fe–GA was further crosslinked by the polymerization of GA with formaldehyde to obtain iron gallate resin (Fe–GR). Fe–mesoporous carbon (Fe–MC) with dispersed Fe3C nanoparticles about 20 nm was obtained by the carbonization of Fe–GR under nitrogen atmosphere. The Fe content of Fe–MC are calculated to be up to 20 wt%. The synthesis strategy is universal that a variety of metal ions can be also used to form X–GR, and X–MC (X = Ti, V, Cr, Mn, Fe, Co, Ni, Cu or Zn) with similar stacked structure. Moreover, bimetallic polymer such as FeCo–GR can also be obtained by one-pot reaction and pyrolyzed into N doped mesoporous carbon (FeCo–MCN) under the mixture of N2 and NH3. FeCo–MCN-900 exhibits outstanding catalytic activity and excellent stability compared to those of the commercial Pt/C catalysts in oxygen reduction reaction (ORR).
2. Experimental section
2.1 Chemicals and materials
Gallic acid (GA), iron(III) chloride hexahydrate (FeCl3·6H2O), cobalt(II) chloride hexahydrate (CoCl2·6H2O), nickel(II) chloride hexahydrate (NiCl2·6H2O), copper(II) chloride dihydrate (CuCl2·2H2O), zinc chloride (ZnCl2), titanium(III) chloride solution (TiCl3, 20 wt% in H2O), vanadium(III) chloride (VCl3), chromium(III) chloride hexahydrate (CrCl3·6H2O), and manganese(II) chloride tetrahydrate (MnCl2·4H2O) were purchased from Aladdin. Ammonia (27 wt% aqueous solution), and ethanol were purchased from Beijing Chemical Works. All the chemicals were used without further purification.2.2 Synthesis of X–GR
For a typical synthesis of Fe–GR, 0.81 g of GA, 19.8 mL of water and 8.4 mL of EtOH were combined and stirred to form a clear solution at 40 °C. Then, 0.9 mL of FeCl3 solution (0.64 g mL−1) was added under stirring. The colour of solution changed from colourless to dark blue immediately, and 1.2 mL of ammonia (∼28 wt%) was added in the solution 30 minutes later. After 4 h, 0.9 mL of formaldehyde (∼35 wt%) was added, and the solution was kept at 40 °C under stirring for 6 h. The product was collected by centrifugation, washed with ethanol for several times, and dried under ambient temperature.X–GR with other metal was synthesized under the similar condition as Fe–GR.
2.3 Synthesis of FeCo–GR
0.81 g of GA, 19.8 mL of water and 8.4 mL of EtOH were combined and stirred to form a clear solution at 40 °C. Then, 0.5 mL of FeCl3 solution (0.64 g mL−1) and 0.4 mL of CoCl2 solution (0.64 g mL−1) was added under stirring. The color of solution changed from colorless to dark blue immediately, and 1.2 mL of ammonia (∼28 wt%) was added in the solution 30 minutes later. After 4 h, 0.9 mL of formaldehyde (∼35 wt%) was added, and the solution was kept at 40 °C under stirring for 6 h. The product was collected by centrifugation, washed with ethanol for several times, and dried under ambient temperature.2.4 Synthesis of X–MC and X–MCN
As for X–MC-600, the obtained X–GR were heated under a nitrogen atmosphere at 2 °C min−1 from room temperature to 150 °C and kept at 150 °C for 2 h. The temperature was then raised at 5 °C min−1 to 600 °C and kept at 600 °C for 1 h. X–MC-700, X–MC-800, X–MC-900, and X–MC-1000 were obtained by changing the final temperature to 700, 800, 900, and 1000 °C. The synthesis of X–MCN had the same heating steps as X–MC but changed N2 to the mixture of N2 and NH3.2.5 Material characterization
The structure and morphology of X–GR and X–MC were analyzed with an FEI Tecnai G2 F20 s-twin D573 field emission transmission electron microscope at an acceleration voltage of 200 kV and a JEOL JSM-6700F field-emission scanning electron microscope operated at 5 kV. The thermal gravimetric analyses (TG) were performed on a TGA Q500 thermogravimetric analyzer used in N2 with a heating rate of 10 °C min−1. N2 adsorption–desorption isotherms were obtained at −196 °C on a Quantachrome NovaWin 4200e instrument. Samples were degassed at 150 °C for a minimum of 6 h prior to analysis. Raman spectra of Fe–MC-x was performed on a Renishaw inVia Raman microscope. Powder X-ray diffraction (XRD) patterns were collected by using a Rigaku 2550 diffractometer with Cu Kα radiation (λ = 1.5418 Å). The X-ray photoelectron spectroscopy (XPS) measurements were performed on a ESCALAB250 system with Al Kα radiation (1486.6 eV). The metal contents were quantitatively analysed by X-ray fluorescence (XRF) using a PANalytical AXIOS XRF spectrometer. Infrared (IR) spectra were recorded within the 400–4000 cm−1 region using a Bruker IFS 66 V/S FTIR spectrometer with KBr pellets.2.6 Electrochemical measurements
Electrocatalytic activities for ORR of the as-prepared catalysts were evaluated on a CHI-660E electrochemical analyser. A three-electrode cell was used, consisting of a glass carbon RDE (5 mm in diameter, RRDE) as working electrode, an Hg/HgO, NaOH (1 M) electrode as the reference electrode, and a Pt wire electrode as the counter electrode. The electrolytes were 0.1 M KOH solution. The potential was scan between −0.70 and +0.30 V (vs. Hg/HgO) at a scan rate of 50 mV s−1 for CV at the ambient temperature after purging O2 or N2 gas for 30 min. All the working electrodes were prepared as following: 5 mg of catalysts and 20 μL of Nafion solution (5 wt%) were dispersed in 500 μL of EtOH by sonication to form a homogeneous ink. Then, 10 μL of ink was loaded onto polished glassy carbon rotating disk electrode of 0.196 cm2 surface, and the electrode was dried at room temperature. The loading amount of catalysts on the electrode was about 0.5 mg cm−2. For the RDE recording, the working electrode was scanned from +0.30 to −0.70 V at a rate of 10 mV s−1 with varying rotating speed from 400 rpm to 2500 rpm. Commercial 20 wt% Pt/C catalysts obtained from Alfa Aesar were used for comparison. The calibration of Hg/HgO reference electrode is performed in a standard three-electrode system with polished Pt wires as the working and counter electrodes, and the Hg/HgO electrode as the reference electrode. Electrolytes are pre-purged and saturated with high purity H2. Linear scanning voltammetry (LSV) is then run at a scan rate of 0.1 mV s−1, and the potential at which the current crossed zero is taken to be the thermodynamic potential (vs. Hg/HgO) for the hydrogen electrode reactions. In 0.1 M KOH, the zero-current point is at −0.900 V, so E (RHE) = E (vs. Hg/HgO) + 0.900 V.The Koutecky–Levich plots (J−1 vs. ω−1/2) were analyzed at various electrode potentials. The slopes of the linear lines were used to calculate the number of electrons transferred (n) according to the following Koutecky–Levich equation.
 | (1) |
| B = 0.62nFC0(D0)2/3ν−1/6 | (2) |
| JK = nFkC0 | (3) |
![[thin space (1/6-em)]](https://www.rsc.org/images/entities/char_2009.gif) 485 C mol−1), C0 is the bulk concentration of O2 (1.2 × 10⁻³ mol L−1 in 0.1 M KOH), D0 is diffusion coefficient of O2 (1.9 × 10⁻⁵ cm s−1 in 0.1 M KOH), ν is the kinematic viscosity of the electrolyte (0.01 cm2 s−1 in 0.1 M KOH). k is the electron transfer rate constant. The number of electrons transferred (n) and JK are obtained from the slope and intercept of the K–L plots. The durability test was carried out by means of the chronopotentiometry method for 20
485 C mol−1), C0 is the bulk concentration of O2 (1.2 × 10⁻³ mol L−1 in 0.1 M KOH), D0 is diffusion coefficient of O2 (1.9 × 10⁻⁵ cm s−1 in 0.1 M KOH), ν is the kinematic viscosity of the electrolyte (0.01 cm2 s−1 in 0.1 M KOH). k is the electron transfer rate constant. The number of electrons transferred (n) and JK are obtained from the slope and intercept of the K–L plots. The durability test was carried out by means of the chronopotentiometry method for 20![[thin space (1/6-em)]](https://www.rsc.org/images/entities/char_2009.gif) 000 s at 0.5 V (vs. RHE).
000 s at 0.5 V (vs. RHE).
As for RRDE measurements, the Pt ring electrode of the RRDE was polarized at 1.25 V to oxidize HO2− intermediate from the disk electrode. The n values were verified according to the following equations.
| n = 4|Id|/(|Id| + Ir/N) | (4) |
3. Results and discussion
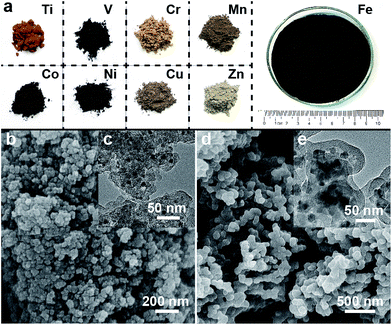
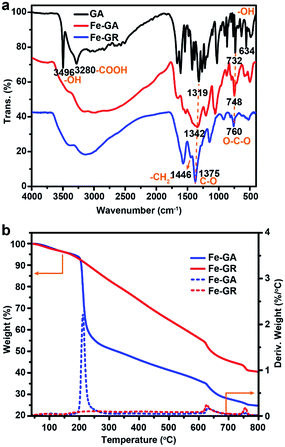
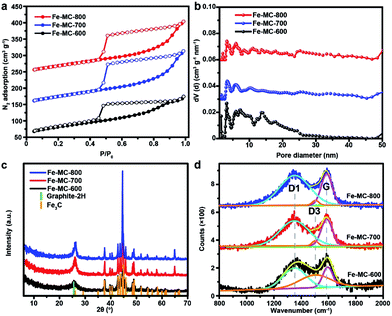
GA is not only a low-cost environmentally friendly drug but also an excellent ligand because it has five available oxygen atoms—a carboxyl group and three phenolic oxygens that can chelate to metal ions with various coordination modes.46 Iron gallate solution has been well known as an ink or a dye since antiquity. Thus, we typically choose FeIII and GA to obtain Fe–GA nanoparticles via a convenient expanded Stöber method. Water, alcohol, and iron gallate can form emulsion droplets through the hydrogen bonding. Ammonia solution was used to adjust the pH of the solution. Fe–GA nanoparticles precipitated in the emulsion droplets and grew to be nanospheres at pH = 9 (Fig. 1b). However, Fe–GA nanospheres will fuse together without mother liquor because the coordinate bonds were not stable enough (Fig. S1c, ESI†). Thus, formaldehyde was chosen to stabilize Fe–GA nanospheres by forming polymer networks (Fe–GR) similar to resorcinol/formaldehyde resins. The SEM image of Fe–GR shows stacked sphere structure originating from fixed Fe–GA nanospheres (Fig. 1c). Fe–GR was carbonized under nitrogen atmosphere. The pyrolysis product of Fe–GR is denoted as Fe–MC-x, where x is the calcination temperature (in °C). Fe–MC-600 showed hollow structure in the TEM image (Fig. 1e), because the inner cores were not as stable as the crosslinked shell during the pyrolysis step. The mesopores about 10 nm (Fig. 1f) are mainly attributed to metal accumulation and transfer during the pyrolysis process.47 Fe–MC-600 began to show layered graphitization structure in HRTEM image, because the high content of Fe can be used as efficient catalyst to accelerate graphitization in Fe–GR. The Fe content of Fe–MC were calculated to be as high as 20 wt% by X-Ray Fluorescence Spectrometer (XRF). To verify the universality of the method, other metals such as Ti, V, Cr, Mn, Co, Ni, Cu, and Zn were also used to fabricate X–GR with high yield more than 10 g from 250 mL of the reaction solution (Fig. 2a). SEM images show similar stacked structure in all these X–GRs (Fig. 2b, d and S2†) and TEM images of X–MC (Fig. 2c and e) show highly dispersed metal nanoparticles. By contrast, typical mesoporous carbon and commercial activated carbon with 10 wt% of the Fe content gave heavily agglomerated Fe3O4 particles after the same treatment as Fe–MC (Fig. S4†). Thus, the coordination–polymerization strategy has obvious advantages in the synthesis of graphitized mesoporous carbon with abundant dispersed metal nanoparticles.The general coordination–polymerization–carbonization synthetic processes were preliminarily studied as below. For the coordination–polymerization processes, Fourier transform infrared (FTIR) spectroscopy was used to identify the changes of characteristic functional group in Fe–GA and Fe–GR. Compared to the spectra of GA (Fig. 3a), the stretching vibration and bending vibration peaks of phenolic hydroxyl O–H groups at 3496 cm−1 and 634 cm−1, and carboxylic acid O–H group at 3280 cm−1 and 1425 cm−1 almost disappeared in the spectra of Fe–GA, indicating the formation of coordination bonds between FeIII and GA.48 The bending vibration peak of C–H group at 1446 cm−1 in the spectra of Fe–GR demonstrates the formation of the methylene group between benzene rings originated from cross-linking reaction. For the carbonization process, Fe–GR showed much better thermal stability with a higher carbonization yield of 40 wt% at 800 °C than that of Fe–GA (25 wt%), according to the thermogravimetry (TG) curves of Fe–GA and Fe–GR under N2 atmosphere (Fig. 3b). The obvious weight loss of Fe–GA between 200 and 250 °C can be mainly attributed to the sublimation of GA. This weight loss process is not observed in the curve of Fe–GR, because GA was crosslinked and stabilized by formaldehyde. The pore characteristics of Fe–MC-x were examined by nitrogen adsorption experiment at 77 K (Fig. 4a). The nitrogen adsorption–desorption isotherms of Fe–GR-x exhibit characteristics of type IV indicating the mesoporous structure of the pyrolysis products. The Brunauer–Emmett–Teller surface areas (SBET) of Fe–MC-600, Fe–MC-700, and Fe–MC-800, are 272, 255 and 235 m2 g−1 based on the N2 adsorption isotherm, respectively. Nonlinear Density Functional Theory (NLDFT) method was used to calculate the pore size distributions of Fe–GR-x (Fig. 4b). The mesopore distribution peaks at about 3 nm and 6 nm are mainly attributed to the thermal decomposition of Fe–GR, and metal accumulation and transfer during the pyrolysis process. X–MC-600 with various metals also showed similar porosity according to the nitrogen adsorption curves (Fig. S5†). Mesoporous carbon MC-600 without metal can be obtained after removing metal in Fe–MC-600 by acid, while the direct carbonization of GR can not obtain mesoporous carbon (Fig. S6†). Thus, the coordination process between metal ions and GA plays an important role in the formation of mesoporous carbon. The powder X-ray diffraction (XRD) patterns were used to confirm the formation of crystalline phase in Fe–MC-x. The peaks in XRD pattern of Fe–MC-x (Fig. 4c) are mainly matched with the diffraction peaks of Fe3C (PDF 35-0772) and graphite-2H (PDF 41-1487). No peaks of iron oxide are found according to the XRD analysis, which is owing to the reductive atmosphere during heat treatment. The Raman spectra of Fe–GR-x (Fig. 4d) can be fit into three peaks: ca. 1350 cm−1 (D1 band) arising from the defects in graphitic lattice, ca. 1590 cm−1 (G band) arising from the in-plane vibration of the sp2 carbon network and ca. 1500 cm−1 (D3 band) arising from amorphous carbon.49 The D1/G band ratio almost do not change at different calcination temperature. The D3/G band ratio drastically decreases from 1.96 to 0.08 with the increase of calcination temperature, indicating the increase of the graphitization degree of Fe–MC-x.
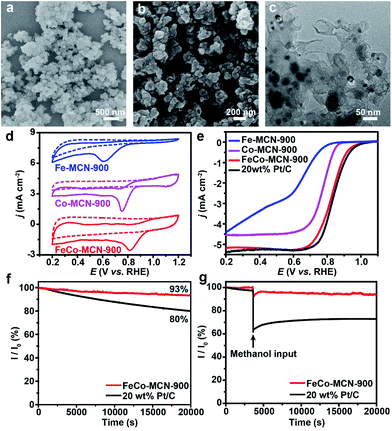
Transition metals Fe and/or Co loaded on N doped carbon catalyst containing the critical site pyridyl-metal have been reported as efficient catalysts for ORR.42,50 Taking advantage of the versatility of our fabrication method, we can conveniently one-pot synthesize bimetallic polymer FeCo–GR as the precursor of bimetallic catalyst. The precursor FeCo–GR, Fe–GR, and Co–GR was carbonized in the gas mixture of N2 and NH3 to obtain N doped catalyst FeCo–MCN, Fe–MCN, and Co–MCN. The electrocatalytic activities of FeCo–MCN-900, Fe–MCN-900 and Co–MCN-900 for ORR were initially investigated by cyclic voltammetry (CV) in 0.1 M KOH solution. In a nitrogen-saturated solution, the CV curves within the entire potential range showed no obvious reduction peaks for the cathodic current (Fig. 5d). In contrast, catalysts displayed well-defined cathodic peaks in the solution saturated with O2. The oxygen reduction peak potential of FeCo–MCN-900 was more positive (0.81 V versus the reversible hydrogen electrode, RHE) than that of Fe–MCN-900 (0.61 V) and Co–MCN-900 (0.75 V), indicating enhanced ORR catalytic activity of bimetallic catalyst. Linear-sweep voltammetry (LSV) was carried out on rotating disk electrode (RDE) in O2 saturated 0.1 M KOH at a scan rate of 10 mV s−1 to gain further insight into the ORR process for the electrodes. The RDE LSV curves (Fig. 4e) demonstrated clear enhancement of FeCo–MCN-900 based on several important indicators: the onset potential (Eonset), half-wave potential (E1/2) and diffusion limiting current density (jL). To verify the optimum calcination temperature, FeCo–GR was carbonized in the gas mixture of N2 and NH3 at different final temperature to obtain FeCo–MCN-x. As shown in Fig. 5e, E1/2 of FeCo–MCN-900 (0.83 V) were the most positive among FeCo–MCN-x, and were comparable to that of commercial Pt/C catalyst (0.84 V, Fig. 4b).
To shed light on the kinetics of electrochemical catalytic ORR, Koutecky–Levich (K–L) plots derived from the LSV curves of FeCo–MCN-900 for ORR at various rotation speeds were obtained at the potential range of the diffusion-controlled region (Fig. S9a†). The inverse current density and the inverse square root of the rotational speed (j−1 vs. ω−1/2) showed good linear relationships and parallelism (Fig. S9b†), indicating first-order reaction kinetics with respect to the dissolved O2. The average electron transfer number (n) was calculated to be 4.2 in the potential range between 0.2 and 0.6 V derived from the K–L plots, suggesting that FeCo–MCN-900 favors a 4e oxygen reduction process similar to that by Pt/C. The number of electrons transferred is 3.97 over the potential range of 0–0.8 V according to the results of RRDE (Fig. S10†), which is in agree with the results of RDE in Fig. S9.† Moreover, the stability of FeCo–MCN-900 and Pt/C catalyst is investigated at 0.5 V in O2-saturated 0.1 M KOH solution at a rotation speed of 1600 rpm. During the period of 20![[thin space (1/6-em)]](https://www.rsc.org/images/entities/char_2009.gif) 000 s, the current density of FeCo–MCN-900 remained 93%, whereas the Pt/C catalyst shows a much higher current loss of 20% (Fig. 5f). Furthermore, the methanol tolerant ability of FeCo–MCN-900 and Pt/C catalyst in 0.1 m KOH electrolyte was compared at the potential of 0.5 V in O2-saturated 0.1 M KOH solution at a rotation speed of 1600 rpm. As shown in Fig. 5g, Pt/C catalyst suffered an instant drop in current upon the introduction of methanol into the electrolyte, while the current of the electrolyte with FeCo–MCN-900 remain almost unchanged. Thus, FeCo–MCN-900 possess better stability and far better resistance to methanol crossover than commercial Pt/C catalyst.
000 s, the current density of FeCo–MCN-900 remained 93%, whereas the Pt/C catalyst shows a much higher current loss of 20% (Fig. 5f). Furthermore, the methanol tolerant ability of FeCo–MCN-900 and Pt/C catalyst in 0.1 m KOH electrolyte was compared at the potential of 0.5 V in O2-saturated 0.1 M KOH solution at a rotation speed of 1600 rpm. As shown in Fig. 5g, Pt/C catalyst suffered an instant drop in current upon the introduction of methanol into the electrolyte, while the current of the electrolyte with FeCo–MCN-900 remain almost unchanged. Thus, FeCo–MCN-900 possess better stability and far better resistance to methanol crossover than commercial Pt/C catalyst.
Several essential characterizations were performed to explore the nature of FeCo–MCN-900 catalyst. The TEM image of FeCo–MCN-900 (Fig. 5c) shows dispersed metal nanoparticles encapsulated in graphited porous carbon. The formation of crystalline phase in FeCo–MCN-900 was confirmed by XRD patterns (Fig. 6a). The peaks in XRD pattern of FeCo–MCN-900 are mainly matched with the diffraction peaks of Fe3N (PDF 49-1662), Co3Fe7 alloy (PDF 48-1816) and graphite-2H (PDF 41-1487). According to XPS of FeCo–MCN-900 (Fig. S9†), the high-resolution C 1s peak was fitted into several peaks corresponding to Fe–C bond at 283.0 eV, C![[double bond, length as m-dash]](https://www.rsc.org/images/entities/char_e001.gif) C bond at 284.8 eV, and C–N bond at 286.0 eV, indicating the incorporation of nitrogen into the graphitic basal plane.19 High-resolution XPS N 1s spectra (Fig. 6c) demonstrates four types of nitrogen atoms and the peaks located at 398.5, 399.6, 401.2 and 402.9 eV in a percentage of 30.8, 15.3, 43.4 and 10.5%, related to the pyridinic N, metal N, graphitic N and oxidized N, respectively.51 The N content reached 2.0 at% in FeCo–MCN-900 and pyridinic N content constituted 30.8% of the total nitrogen content, suggesting effective enrichment of pyridinic N in FeCo–MCN-900 via thermal treatment in NH3. The Fe and Co content in FeCo–MCN-900 are calculated to be about 14 and 13 wt% by XRF (Fig. 6d), respectively. However, the Fe and Co 2p peaks were very weak in XPS spectra (Fig. S11†) and fitted into several peaks corresponding to FeIII and CoII, suggesting that Co3Fe7 was entirely encapsulated by carbon shells. The encapsulated Co3Fe7 alloy NPs can activate the surrounding graphitic layers, which also act as active sites towards the ORR.52 Considering all the above, the excellent electrocatalytic activities and stability of FeCo–MCN-900 can originate from the porous structure and critical sites, including abundant pyridinic N, graphited carbon coated Fe3N and Co3Fe7 alloy.53 Some controlled trials, such as Fe–MCN-900, Co–MCN-900, Fe–MC-600 and FeCo–MC-600 containing part of the catalytic activity sites in FeCo–MCN-900, also exhibited certain activity, but not as well as FeCo–MCN-900 (Fig. 5 and S8†). Thus, these catalytic sties of FeCo–MCN-900 sample, such as Fe–N–C, Co–N–C, N–C, metal nitrides and metal carbides, possibly work together by a synergetic effect in ORR and lead to the excellent performance of FeCo–MCN-900.
C bond at 284.8 eV, and C–N bond at 286.0 eV, indicating the incorporation of nitrogen into the graphitic basal plane.19 High-resolution XPS N 1s spectra (Fig. 6c) demonstrates four types of nitrogen atoms and the peaks located at 398.5, 399.6, 401.2 and 402.9 eV in a percentage of 30.8, 15.3, 43.4 and 10.5%, related to the pyridinic N, metal N, graphitic N and oxidized N, respectively.51 The N content reached 2.0 at% in FeCo–MCN-900 and pyridinic N content constituted 30.8% of the total nitrogen content, suggesting effective enrichment of pyridinic N in FeCo–MCN-900 via thermal treatment in NH3. The Fe and Co content in FeCo–MCN-900 are calculated to be about 14 and 13 wt% by XRF (Fig. 6d), respectively. However, the Fe and Co 2p peaks were very weak in XPS spectra (Fig. S11†) and fitted into several peaks corresponding to FeIII and CoII, suggesting that Co3Fe7 was entirely encapsulated by carbon shells. The encapsulated Co3Fe7 alloy NPs can activate the surrounding graphitic layers, which also act as active sites towards the ORR.52 Considering all the above, the excellent electrocatalytic activities and stability of FeCo–MCN-900 can originate from the porous structure and critical sites, including abundant pyridinic N, graphited carbon coated Fe3N and Co3Fe7 alloy.53 Some controlled trials, such as Fe–MCN-900, Co–MCN-900, Fe–MC-600 and FeCo–MC-600 containing part of the catalytic activity sites in FeCo–MCN-900, also exhibited certain activity, but not as well as FeCo–MCN-900 (Fig. 5 and S8†). Thus, these catalytic sties of FeCo–MCN-900 sample, such as Fe–N–C, Co–N–C, N–C, metal nitrides and metal carbides, possibly work together by a synergetic effect in ORR and lead to the excellent performance of FeCo–MCN-900.
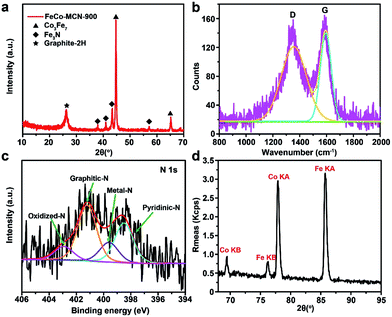 | ||
| Fig. 6 Characterizations of FeCo–MCN-900. (a) XRD pattern. (b) Raman spectra. (c) N 1s XPS spectra. (d) XRF spectra. | ||
4. Conclusions
In conclusion, we have demonstrated the general coordination–polymerization strategy using formaldehyde to crosslink coordination nanospheres to synthesize a series of polymers and mesoporous carbons with abundant dispersed metal nanoparticles. Various transition metal such as Ti, V, Cr, Mn, Fe, Co, Ni, Cu, and Zn can be used to fabricate X–GR and X–MC with similar stacked structure. Furthermore, the general strategy can be expanded to the fabrication of bimetallic catalyst FeCo–MCN-900, which possesses comparable ORR catalytic activity, better stability and far better resistance to methanol crossover compared to those of commercial Pt/C catalyst. Obviously, the applications of X-MC are not limited to ORR, and still worth for deeper research. The design concept presented here is expected to stabilize more fragile coordination complexes and prepare a series of heterometal catalysts.Conflicts of interest
There are no conflicts to declare.Acknowledgements
This work was supported by the Young Thousand Talented Program and the National Natural Science Foundation of China (No. 21671073, 21621001, 21671074, 21371067 and 21373095), and the “111” Project of the Ministry of Education of China (B17020).Notes and references
- A. S. Aricò, P. Bruce, B. Scrosati, J. M. Tarascon and S. W. Van, Nat. Mater., 2005, 4, 366–377 CrossRef PubMed.
- X. Lu and C. Zhao, Nat. Commun., 2015, 6, 6616 CrossRef CAS PubMed.
- M. K. Debe, Nature, 2012, 486, 43–51 CrossRef CAS PubMed.
- X. Zhou, J. Qiao, Y. Lin and J. Zhang, Adv. Energy Mater., 2014, 4, 1289–1295 Search PubMed.
- M. Shao, Q. Chang, J. P. Dodelet and R. Chenitz, Chem. Rev., 2016, 116, 3594–3657 CrossRef CAS PubMed.
- C. Chen, Y. Kang, Z. Huo, Z. Zhu, W. Huang, H. L. Xin, J. D. Snyder, D. Li, J. A. Herron and M. Mavrikakis, Science, 2014, 343, 1339–1343 CrossRef CAS PubMed.
- Y. Li, W. Zhou, H. Wang, L. Xie, Y. Liang, F. Wei, J. C. Idrobo, S. J. Pennycook and H. Dai, Nat. Nanotechnol., 2012, 7, 394–400 CrossRef CAS PubMed.
- I. E. L. Stephens, J. Rossmeisl and I. Chorkendorff, Science, 2016, 354, 1378–1379 CrossRef CAS PubMed.
- L. Bu, N. Zhang, S. Guo, X. Zhang, J. Li, J. Yao, T. Wu, G. Lu, J. Y. Ma and D. Su, Science, 2016, 354, 1410–1414 CrossRef CAS PubMed.
- M. Li, Z. Zhao, T. Cheng, A. Fortunelli, C. Y. Chen, R. Yu, Q. Zhang, L. Gu, B. Merinov and Z. Lin, Science, 2016, 354, 1414–1419 CrossRef CAS PubMed.
- J. Snyder, K. Livi and J. Erlebacher, Adv. Funct. Mater., 2013, 23, 5494–5501 CrossRef CAS.
- M. Justus, X. Wei, M. Martin and S. Wolfgang, Angew. Chem., Int. Ed., 2015, 54, 10102–10120 CrossRef PubMed.
- R. Bashyam and P. Zelenay, Nature, 2006, 443, 63–66 CrossRef CAS PubMed.
- X. Tian, J. Luo, H. Nan, Z. Fu, J. Zeng and S. Liao, J. Mater. Chem. A, 2015, 3, 16801–16809 CAS.
- G. Jiang, H. Zhu, X. Zhang, B. Shen, L. Wu, S. Zhang, G. Lu, Z. Wu and S. Sun, ACS Nano, 2015, 9, 11014–11022 CrossRef CAS PubMed.
- L.-B. Lv, T.-N. Ye, L.-H. Gong, K.-X. Wang, J. Su, X.-H. Li and J.-S. Chen, Chem. Mater., 2015, 27, 544–549 CrossRef CAS.
- S. Guo, S. Zhang and S. Sun, Angew. Chem., Int. Ed., 2013, 52, 8526–8544 CrossRef CAS PubMed.
- J. Shui, M. Wang, F. Du and L. Dai, Sci. Adv., 2015, 1, e1400129 Search PubMed.
- Z. Lin, G. Waller, Y. Liu, M. Liu and C. P. Wong, Adv. Energy Mater., 2012, 2, 884–888 CrossRef CAS.
- J. X. Feng, H. Xu, Y. T. Dong, S. H. Ye, Y. X. Tong and G. R. Li, Angew. Chem., Int. Ed., 2016, 55, 3694–3698 CrossRef CAS PubMed.
- Y. C. Wang, Y. J. Lai, S. Lin, Z. Y. Zhou, J. G. Liu, W. Qiang, X. D. Yang, C. Chi, S. Wei and Y. P. Zheng, Angew. Chem., Int. Ed., 2015, 54, 9907–9910 CrossRef CAS PubMed.
- P. Yin, T. Yao, Y. Wu, L. Zheng, Y. Lin, W. Liu, H. Ju, J. Zhu, X. Hong and Z. Deng, Angew. Chem., Int. Ed., 2016, 55, 10800–10805 CrossRef CAS PubMed.
- U. I. Kramm, I. Herrmanngeppert, J. Behrends, K. Lips, S. Fiechter and P. Bogdanoff, J. Am. Chem. Soc., 2015, 138, 635–640 CrossRef PubMed.
- R. J. White, K. Tauer, M. Antonietti and M.-M. Titirici, J. Am. Chem. Soc., 2010, 132, 17360–17363 CrossRef CAS PubMed.
- D. Higgins, F. M. Hassan, H. S. Min, J. Y. Choi, M. A. Hoque, U. L. Dong and Z. Chen, J. Mater. Chem. A, 2015, 3, 6340–6350 CAS.
- M. Lefèvre, E. Proietti, F. Jaouen and J. P. Dodelet, Science, 2009, 324, 71–74 CrossRef PubMed.
- K. Ai, Y. Liu, C. Ruan, L. Lu and G. M. Lu, Adv. Mater., 2013, 25, 998–1003 CrossRef CAS PubMed.
- H. Xue, J. Tang, H. Gong, H. Guo, X. Fan, T. Wang, J. He and Y. Yamauchi, ACS Appl. Mater. Interfaces, 2016, 8, 20766–20771 CAS.
- H. Gong, H. Xue, T. Wang, H. Guo, X. Fan, L. Song, W. Xia and J. He, ACS Appl. Mater. Interfaces, 2016, 8, 18060–18068 CAS.
- L. Song, T. Wang, Y. Ma, H. Xue, H. Guo, X. Fan, W. Xia, H. Gong and J. He, Chem.–Eur. J., 2017, 23, 3398–3405 CrossRef CAS PubMed.
- X. Cui, S. Yang, X. Yan, J. Leng, S. Shuang, P. M. Ajayan and Z. Zhang, Adv. Funct. Mater., 2016, 26, 5708–5717 CrossRef CAS.
- Y. Wan, Y. Shi and D. Zhao, Chem. Mater., 2007, 20, 932–945 CrossRef.
- H. Bi, T. Lin, F. Xu, Y. Tang, Z. Liu and F. Huang, Nano Lett., 2016, 16, 349–354 CrossRef CAS PubMed.
- Y. Zhang, S. Wei, F. Liu, Y. Du, S. Liu, Y. Ji, T. Yokoi, T. Tatsumi and F. S. Xiao, Nano Today, 2009, 4, 135–142 CrossRef CAS.
- Y. Niu, X. Huang, X. Wu, L. Zhao, W. Hu and C. Ming Li, Nanoscale, 2017, 9, 10233–10239 RSC.
- Y. Z. Chen, C. Wang, Z. Y. Wu, Y. Xiong, Q. Xu, S. H. Yu and H. L. Jiang, Adv. Mater., 2015, 27, 5010–5016 CrossRef CAS PubMed.
- M. Hu, Y. Ju, K. Liang, T. Suma, J. Cui and F. Caruso, Adv. Funct. Mater., 2016, 26, 5827–5834 CrossRef CAS.
- Q. Lin, X. Bu, A. Kong, C. Mao, F. Bu and P. Feng, Adv. Mater., 2015, 27, 3431–3436 CrossRef CAS PubMed.
- L. Li, C. Yuan, D. Zhou, A. E. Ribbe, K. R. Kittilstved and S. Thayumanavan, Angew. Chem., Int. Ed., 2015, 54, 12991–12995 CrossRef CAS PubMed.
- J. Wei, Y. Liang, Y. Hu, B. Kong, J. Zhang, Q. Gu, Y. Tong, X. Wang, S. P. Jiang and H. Wang, Angew. Chem., Int. Ed., 2016, 55, 12470–12474 CrossRef CAS PubMed.
- M. A. Rahim, K. Kempe, M. Müllner, H. Ejima, Y. Ju, M. P. V. Koeverden, T. Suma, J. A. Braunger, M. G. Leeming and B. F. Abrahams, Chem. Mater., 2015, 27, 5825–5832 CrossRef CAS.
- B. Wurster, D. Grumelli, D. Hötger, R. Gutzler and K. Kern, J. Am. Chem. Soc., 2016, 138, 3623–3626 CrossRef CAS PubMed.
- K. Strickland, E. Miner, Q. Jia, U. Tylus, N. Ramaswamy, W. Liang, M. T. Sougrati, F. Jaouen and S. Mukerjee, Nat. Commun., 2015, 6, 7343 CrossRef CAS PubMed.
- J. Wei, Y. Liang, Y. Hu, B. Kong, G. P. Simon, J. Zhang, S. P. Jiang and H. Wang, Angew. Chem., Int. Ed., 2016, 55, 1355–1359 CrossRef CAS PubMed.
- H. Ejima, J. J. Richardson, K. Liang, J. P. Best, M. P. van Koeverden, G. K. Such, J. Cui and F. Caruso, Science, 2013, 341, 154–157 CrossRef CAS PubMed.
- R. K. Feller and A. K. Cheetham, Solid State Sci., 2006, 8, 1121–1125 CrossRef CAS.
- M. Zhao and H. Song, J. Mater. Sci. Technol., 2011, 27, 266 CAS.
- L. L. Justino, I. Reva and R. Fausto, J. Chem. Phys., 2016, 145, 014304 CrossRef PubMed.
- V. Perazzolo, C. Durante, R. Pilot, A. Paduano, J. Zheng, G. A. Rizzi, A. Martucci, G. Granozzi and A. Gennaro, Carbon, 2015, 95, 949–963 CrossRef CAS.
- M. Sun, H. Liu, Y. Liu, J. Qu and J. Li, Nanoscale, 2015, 7, 1250–1269 RSC.
- X. Li, H. Wang, J. T. Robinson, H. Sanchez, G. Diankov and H. Dai, J. Am. Chem. Soc., 2009, 131, 15939–15944 CrossRef CAS PubMed.
- M. Li, T. Liu, L. Fan, X. Bo and L. Guo, J. Alloys Compd., 2016, 686, 467–478 CrossRef CAS.
- X. Huang, Z. Yang, B. Dong, Y. Wang, T. Tang and Y. Hou, Nanoscale, 2017, 9, 8102–8106 RSC.
Footnote |
| † Electronic supplementary information (ESI) available: SEM images of X–GR, TG curves of Fe–GA and Fe–GR, pore size distribution analysis for Fe–MC-x, N2 adsorption–desorption isotherms of X–MC-600, PXRD patterns of X–MC-x, characterizations of FeCo–MCN-900. See DOI: 10.1039/c7ra09560k |
| This journal is © The Royal Society of Chemistry 2017 |

