 Open Access Article
Creative Commons Attribution 3.0 Unported Licence
Enhanced adsorption capacity and selectivity towards strontium ions in aqueous systems by sulfonation of CO2 derived porous carbon†
S. Baika,
H. Zhang b,
Y. K. Kima,
D. Harbottle*b and
J. W. Lee
 *a
*a
aDepartment of Chemical and Biomolecular Engineering, Korea Advanced Institute of Science and Technology (KAIST), 291 Daehak-ro (373-1 Guseong-dong), Yuseong-gu, Daejeon 34141, Republic of Korea. E-mail: jaewlee@kaist.ac.kr
bSchool of Chemical and Process Engineering, University of Leeds, Leeds LS2 9JT, UK. E-mail: D.Harbottle@leeds.ac.uk
First published on 28th November 2017
Abstract
Oxygen-enriched carbon materials derived from carbon dioxide were functionalized using sulfonic acid to remove Sr2+ ions from aqueous solutions. Synthesized sulfonated porous carbon materials (PC-SO3H) showed higher adsorption capacity and selectivity towards Sr2+ than non-functionalized porous carbons (PC). The formation of the C-SO3H functional group in PC-SO3H and its ability to proton exchange with Sr2+ was the main contributor to the enhanced performance. The maximum uptake capacity of Sr2+ by PC-SO3H was 18.97 mg g−1, which was 1.74 times greater than PC. PC-SO3H removed 99.9% and 97.6% of Sr2+ from aqueous solutions with initial Sr2+ concentrations of 5 mg L−1 and 10 mg L−1, respectively. Sr2+ adsorption showed rapid kinetics, reaching the adsorption equilibrium within 1 h with high adsorption capacity at equilibrium which is 3.52 times greater than that of PC. Additionally, PC-SO3H selectively adsorbed Sr2+ even in the presence of excess amounts of competing ions. Sulfonation of oxygen-enriched carbon had a significant effect on enhancing the affinity towards Sr2+ and suppressing adsorption towards other competing ions.
Introduction
Nuclear power is considered a promising candidate to satisfy the increased demand for energy. Currently nuclear power accounts for 4.8% of the world's total energy supply, and the proportion of energy supplied by nuclear is anticipated to grow.1,2 However, radioactive waste from nuclear power can cause long-term environmental and health threats. In particular, 89Sr and 90Sr are radioactive isotopes which are present in nuclear reactors and various forms of nuclear waste,3 and if released into the environment (e.g. nuclear incidents such as Chernobyl and Fukushima), 89Sr and 90Sr can present a significant public health risk following exposure to the radioactivity.4,5 Furthermore, strontium exhibits a long half-life (28.8 years) and a high decay energy; therefore effective ways to treat strontium (Sr2+) contaminated environments must be considered.6Adsorption is often considered a feasible and somewhat economical method for the recovery of radioactive isotopes from liquid wastes.7–10 Numerous studies have considered the removal of Sr2+ from aqueous environments using various adsorbents. Clay minerals such as kaolinite11 and attapulgite12 were frequently studied due to its large edge surface and high ability for ion exchange which is common and effective mechanism for adsorption in aqueous systems.13,14 Along with the ability for ion exchange, the porous structure is usually favored when designing effective adsorbents.15–17 Therefore, studies moves onto various materials with those characteristics such as zeolite,18 silica,19,20 titanosilicate,21 Prussian blue,22 and titanate nanotubes.23
While carbon exhibits the right physical properties along with low cost and its abundance, removal performance of Sr2+ is poor with carbon-based adsorbents exhibiting low removal efficiencies below 70% (ref. 24–26) and low selectivity for Sr2+.27,28 Research to improve the adsorption properties of carbon-based materials, especially the removal of Sr2+, has been limited but is the focus of this study.
In the current study, carbon dioxide (CO2)-derived porous carbon materials have been functionalized with sulfonic acid to enhance removal of Sr2+. The sulfonic acid groups have been identified to improve the removal efficiency of heavy metal ions such as cadmium,29 lead30 and uranium,31 but there is no evidence relating to strontium adsorption. Recently, Aguila et al.32 reported a metal organic framework (MOF)-SO3H for the removal of Sr2+. The authors suggested the possibility of cation exchange between the proton in SO3H and Sr2+, but experimental confirmation of this hypothesis was not provided. To the best of our knowledge, this is the first study to confirm the effect of SO3H functional group for improved Sr2+ removal from aqueous systems. The reaction to functionalize the carbon backbone with SO3H groups is demonstrated and supplemented with detailed material characterization. Various comparative adsorption studies between the sulfonated porous carbon and non-functionalized porous carbon were investigated to highlight the performance characteristics of SO3H groups, specifically Sr2+ adsorption, with the mechanism for ion exchange clearly demonstrated and discussed.
Experimental
1. Materials
Sodium borohydride (NaBH4, >96%), hydrochloric acid (HCl, 37 wt%), strontium standard solution (1000 mg L−1, for AAS), sodium chloride (NaCl, >99%) and seawater whose cations composition was 10![[thin space (1/6-em)]](https://www.rsc.org/images/entities/char_2009.gif) 409 ppm Na+, 359 ppm K+, 1327 ppm Mg2+ and 176 ppm Ca2+ (ref. 33) were purchased from Sigma-Aldrich. Concentrated sulfuric acid (H2SO4, 95–98%) and potassium chloride (KCl, 99.9%) were obtained from Fluka. CO2 used to prepare the carbon particles and acetylene and N2O (>99.8%) for the atomic adsorption spectrometry were supplied by BOC gas. All chemicals were used without further purification. Ultrapure Milli-Q water (distilled water, DIW) with a resistivity of 18.2 MΩ cm was used in all experiments.
409 ppm Na+, 359 ppm K+, 1327 ppm Mg2+ and 176 ppm Ca2+ (ref. 33) were purchased from Sigma-Aldrich. Concentrated sulfuric acid (H2SO4, 95–98%) and potassium chloride (KCl, 99.9%) were obtained from Fluka. CO2 used to prepare the carbon particles and acetylene and N2O (>99.8%) for the atomic adsorption spectrometry were supplied by BOC gas. All chemicals were used without further purification. Ultrapure Milli-Q water (distilled water, DIW) with a resistivity of 18.2 MΩ cm was used in all experiments.
2. Preparation of porous carbon (PC) from CO2
The procedure to form the CO2-derived porous carbon was adopted from earlier studies.34–37 5 g of NaBH4 powder was loaded into a steel-alloy tube and the tube was placed inside the furnace (MTF 12/25/400, Carbolite Gero Ltd.). The powder was heated to 500 °C from room temperature at a heating rate of 5 °C min−1. The sample was then held at this temperature for 2 h, before natural convection cooling to room temperature under a continuous flow of CO2 at 100 mL min−1. The solid product (CO2-derived porous carbon (PC)) was then washed with 1 M HCl at 50 °C for 30 min while stirring the suspension at 300 rpm to remove any unreacted NaBH4 and other impurities. The product was washed with DIW for 15 min and filtered. The wash and filtration processes were repeated further five times until the pH of the wash water was above pH 5.5. Finally, the product underwent 15 min washing in ethanol before evaporating the ethanol in air for 6 h at 100 °C.3. Attachment of sulfonic acid functional group to porous carbon (PC-SO3H)
1 g of the prepared PC was dispersed in 20 mL of H2SO4. The mixture was heated to 130 °C in an oil bath and held at a constant temperature for 15 h while gently stirring the suspension at 200 rpm using a magnetic stirrer. Following the hydrothermal treatment the sample was cooled to room temperature and diluted in DIW and then filtered using filter paper (grade 1). Following the filtration the product was washed with DIW for 15 min and subsequently filtered. The wash and filtration processes using DIW were once again repeated until the pH exceeded 5. Finally, the product (sulfonated porous carbon (PC-SO3H)) was air dried for 24 h at 120 °C.4. Characterization
Elemental analysis was conducted using a CHNS/O elemental analyzer (Thermo Fisher Scientific, Flash 2000). Fourier transform infrared (FTIR) spectra were collected using the Thermo Fisher Scientific Nicolet iS10 with an attenuated total reflection (ATR) accessory. X-ray photoelectron spectroscopy (XPS) data were acquired using a multi-purpose XPS device (Thermo Fisher Scientific, Sigma Probe) equipped with an MXR1 gun (400 μm). Scanning electron microscopy (SEM) images and energy dispersive spectroscopy (EDS) data were obtained using a field emission SEM (FEI Company, Magellan 400). Prior to the measurement (XPS and SEM) the powder samples were deposited onto a carbon tape. The nitrogen adsorption/desorption isotherms at 77 K were obtained using a Micromeritics 3Flex. The surface area for PC and PC-SO3H was calculated according to the Brunauer–Emmett–Teller (BET) method, and the pore size distribution was determined from a non-local density functional theory (NLDFT) method.5. Strontium adsorption experiments
To determine the equilibrium adsorption capacity of the formed products, a Sr2+ adsorption isotherm was constructed by measuring the Sr2+ uptake at a range of initial Sr2+ concentrations. The initial Sr2+ concentrations (1, 5, 10, 20, 50, 100, 200 and 350 mg L−1) were determined by diluting a stock solution (1000 mg L−1) using DIW. 20 mg of the powdered sample was added to 20 mL of each Sr2+ solution (solid to liquid ratio = 1 g L−1), and the suspension was shaken for 24 h at room temperature using an orbital shaker.For the adsorption kinetic test the initial Sr2+ concentration was fixed at 20 mg L−1 and the suspension (1 g L−1) was shaken at room temperature for 0.17, 0.33, 0.66, 1, 2, 3 and 5 h. For both isotherm and kinetic studies, following Sr2+ adsorption, the suspension was centrifuged at 11![[thin space (1/6-em)]](https://www.rsc.org/images/entities/char_2009.gif) 000 rpm for 15 min and the supernatant was recovered and filtered using a 0.45 μm syringe filter. The Sr2+ concentration remaining in the supernatant was quantified using a fast sequential atomic absorption spectrometer (AAS, VARIAN AA240FS).
000 rpm for 15 min and the supernatant was recovered and filtered using a 0.45 μm syringe filter. The Sr2+ concentration remaining in the supernatant was quantified using a fast sequential atomic absorption spectrometer (AAS, VARIAN AA240FS).
Results & discussion
1. Structural analysis for synthesized PC-SO3H
The chemical composition of the synthesized PC-SO3H measured by elemental analyzer (EA) is shown in Table 1. Sulfur and oxygen contents were shown to increase following the sulfonation of PC even though the observed sulfur composition is a bit lower than its expected value. This suggests that the sulfonic acid groups are chemically bound to the carbon surface in the PC-SO3H as intended.| PC | PC-SO3H | |||
|---|---|---|---|---|
| Expecteda | Observed | Expecteda | Observed | |
| a The expected chemical composition of PC is averaged value from previous studies,34,37 and that of PC-SO3H is determined based on the assumption that 10% of C–H bonds in PC are replaced by C-SO3H bonds. | ||||
| C | 74% | 76.89% | 65.26% | 65.73% |
| H | 2% | 2.51% | 0.21% | 2.13% |
| N | — | 0.20% | 0.17% | 0.19% |
| S | — | — | 6.82% | 1.77% |
| O | 17% | 15.44% | 23.33% | 25.93% |
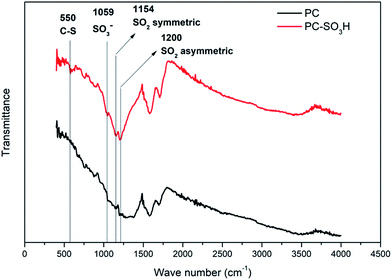
Attachment of the sulfonic acid groups to the PC was verified from the FTIR spectra as shown in Fig. 1. The peak at 550 cm−1 can be assigned to the C–S stretch38 and the peak at 1059 cm−1 corresponds to the SO3− stretch.39 Peaks at 1154 cm−1 and 1200 cm−1 confirm the existence of SO2 related bonds while the peaks are slightly shifted (higher wave numbers) when compared to the literature values.40,41 This shift was also reported from the previous studies for sulfonic acid-treated carbon materials.38,42 The remaining peaks in the spectra can be assigned to either C–O or C–B, which are observed in both PC and PC-SO3H samples that are synthesized from CO2.35–37 It should be noted that the presence of both C–S and S–O bonds in PC-SO3H but the absence in PC indicate the successful chemical bonding of sulfonic acid group to the carbon in PC-SO3H.
The surface elemental composition of the two samples was confirmed by XPS. From the data, PC contained 82.93% carbon, 13.74% oxygen and 3.34% boron, with the composition changing to 78.36% carbon, 17.54% oxygen, 1.84% boron and 2.26% sulfur for PC-SO3H. In good agreement with the elemental compositions shown in Table 1, the sulfonation of PC increased both the oxygen and sulfur content in PC-SO3H. The slight increase in sulfur content when measured by XPS compared to EA suggests that the sulfur atoms are enriched on the surface of carbon. To better understand the nature of the chemical bonds in PC and PC-SO3H, deconvolution of the C 1s, O 1s, S 2p and B 1s spectra was conducted. As shown in the C 1s spectra of PC (Fig. 2(a)), the three peaks can be assigned to C![[double bond, length as m-dash]](https://www.rsc.org/images/entities/char_e001.gif) C (283.6 eV), C–C (285.2 eV) and C
C (283.6 eV), C–C (285.2 eV) and C![[double bond, length as m-dash]](https://www.rsc.org/images/entities/char_e001.gif) O (288.5 eV),43–48 while the additional peak observed in the C 1s spectra of PC-SO3H (Fig. 2(b)) corresponds to C–S bonds (287.1 eV).44,46,49 Deconvolution of the O 1s spectra is shown in Fig. 2(c) and (d). A main peak centered at 531.7 eV is attributed to the O–C group, and a second peak observed for PC-SO3H can be assigned to O
O (288.5 eV),43–48 while the additional peak observed in the C 1s spectra of PC-SO3H (Fig. 2(b)) corresponds to C–S bonds (287.1 eV).44,46,49 Deconvolution of the O 1s spectra is shown in Fig. 2(c) and (d). A main peak centered at 531.7 eV is attributed to the O–C group, and a second peak observed for PC-SO3H can be assigned to O![[double bond, length as m-dash]](https://www.rsc.org/images/entities/char_e001.gif) S bonds.46,47 The C–S and O
S bonds.46,47 The C–S and O![[double bond, length as m-dash]](https://www.rsc.org/images/entities/char_e001.gif) S bonds of the PC-SO3H can be clearly identified through the deconvolution of the XPS spectra (Fig. 2(b) and (d)). Moreover, for PC-SO3H (Fig. 3(b)) the S 2p peak centered at 167.4 eV corresponds to C–S–O bonds,43,45,50 which is absent for PC. Deconvolution of the B 1s spectra confirmed no changes following the sulfonation step, as shown in Fig. 3(c) and (d). As such, it is reasonable to state that the sulfur atoms bind to the carbon and oxygen atoms and not the boron atoms. Hence, the majority of the sulfur exists in the form of C–S–O, which is present in the C-SO3H functional group.
S bonds of the PC-SO3H can be clearly identified through the deconvolution of the XPS spectra (Fig. 2(b) and (d)). Moreover, for PC-SO3H (Fig. 3(b)) the S 2p peak centered at 167.4 eV corresponds to C–S–O bonds,43,45,50 which is absent for PC. Deconvolution of the B 1s spectra confirmed no changes following the sulfonation step, as shown in Fig. 3(c) and (d). As such, it is reasonable to state that the sulfur atoms bind to the carbon and oxygen atoms and not the boron atoms. Hence, the majority of the sulfur exists in the form of C–S–O, which is present in the C-SO3H functional group.
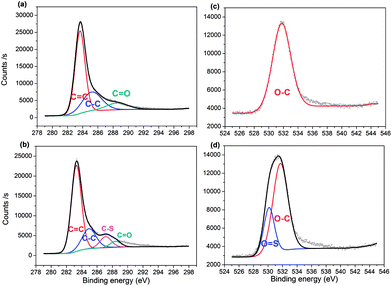 | ||
| Fig. 2 XPS spectra of C 1s peaks for (a) PC and (b) PC-SO3H, respectively; and O 1s peaks for (c) PC and (d) PC-SO3H. | ||
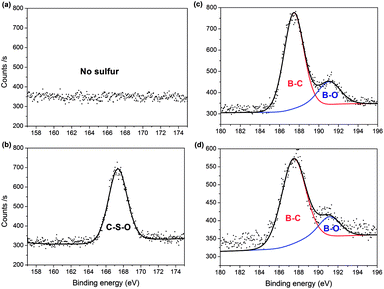 | ||
| Fig. 3 XPS spectra showing: absence and presence of S 2p peaks in (a) PC and (b) PC-SO3H, respectively; and B 1s peaks for (c) PC and (d) PC-SO3H. | ||
Chemical composition and elemental mapping was determined by SEM-EDS (Fig. 4 and S1†). For PC-SO3H the composition profile (Fig. 4(a)) was shown to be 69.73% carbon, 26.33% oxygen, 1.39% boron and 2.56% sulfur, which is in excellent agreement with the composition determined by EA shown in Table 1. Elemental maps in Fig. 4(b–f) show that all atoms including sulfur are uniformly distributed and dispersed across the carbon surface. Although PC-SO3H shows porous morphology similar to PC in SEM images (Fig. S1†), the specific BET surface area decreased after sulfonation (Table S1†). Both isotherm curve and pore size distribution (Fig. S2†) indicate the collapse of pores by sulfuric acid, which may be the reason why specific surface area was reduced.
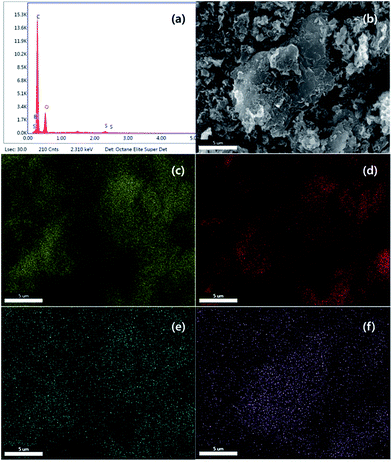 | ||
| Fig. 4 SEM-EDS (a) composition profile, (b) image, (c) carbon map, (d) oxygen map, (e) boron map and (f) sulfur map for PC-SO3H. | ||
2. Strontium ion adsorption
The Sr2+ adsorption capacity of PC and PC-SO3H was determined by fitting the equilibrium adsorption data to the Langmuir-isotherm model:
 | (1) |
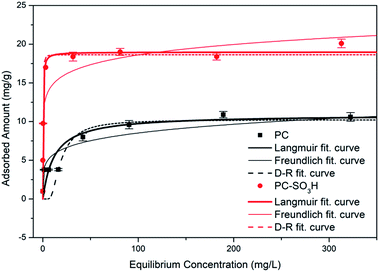 | ||
| Fig. 5 Adsorption isotherms of Sr2+ onto PC and PC-SO3H with fitted Langmuir, Freundlich, and Dubinin–Radushkevich isotherm curves. | ||
| PC | PC-SO3H | ||
|---|---|---|---|
| Langmuir | Qm | 10.89 mg g−1 | 18.97 mg g−1 |
| b | 0.085 L mg−1 | 4.399 L mg−1 | |
| R2 | 0.995 | 0.990 | |
| Freundlich | KF | 3.73 L mg−1 | 11.69 L mg−1 |
| NF | 5.07 | 9.89 | |
| R2 | 0.923 | 0.757 | |
| Dubinin–Radushkevich | Qm | 10.24 mg g−1 | 18.64 mg g−1 |
| β | 4.57 × 10⁻⁵ mol2 J−2 | 8.92 × 10⁻⁹ mol2 J−2 | |
| R2 | 0.972 | 0.959 | |
| E | 0.11 kJ mol−1 | 7.49 kJ mol−1 | |
Other isotherm models were tested to fit the data as well, but Langmuir isotherm showed the highest accordance based on R2 value. Freundlich isotherm curve was fitted with the equation defined as
| Qe = KFCe1/NF | (2) |
The Dubinin–Radushkevich (D–R) curve was fitted with the equation
Qe = Qm![[thin space (1/6-em)]](https://www.rsc.org/images/entities/char_2009.gif) exp(−βε2) exp(−βε2)
| (3) |
 | (4) |
 | (5) |
As both PC and PC-SO3H have the E value smaller than 8 kJ mol−1, physical adsorption may be the dominant mechanism. However, the E value of PC-SO3H is close to 8 kJ mol−1, which indicates adsorption also occurred in terms of ion exchange.51,52
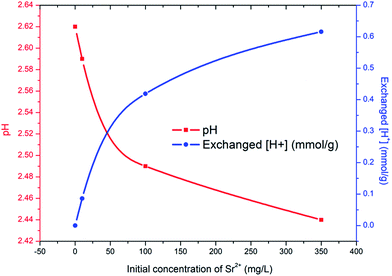
The improved adsorption capacity of PC-SO3H is attributed to the ion exchange between Sr2+ and the proton in SO3H. To validate this mechanism the exchanged amount of ions was confirmed by measuring the pH of the Sr2+ solution following the adsorption test. As shown in Fig. 6, the proton concentration per gram of PC-SO3H increased with the increasing concentration of Sr2+. For 100 and 350 mg L−1 Sr2+ solutions, 0.42 and 0.62 mmol g−1 of protons were exchanged, respectively. These values appear reasonable considering that the adsorbed amount of Sr2+ from initial solution concentrations of 100 and 350 mg L−1 equalled 0.22 mmol g−1 and 0.25 mmol g−1, respectively. These data not only support the mechanism of Sr2+ removal by ion exchange with the proton in PC-SO3H, but also quantify the exchange ratio of proton to Sr2+ to be approximately 2.
Ion exchange between Sr2+ and proton was confirmed in XPS results as well. The clear peak shift was observed in comparison between O 1s spectra of pristine PC-SO3H and Sr2+-adsorbed PC-SO3H (Fig. S3(a)†). This shift is caused by the replacement of H+ into Sr2+ which is bonded to oxygen atoms. In addition, Sr 3d peaks obtained from PC-SO3H after adsorption (Fig. S3(b)†) show peak shift compared to element Sr. That is due to the bond between Sr and electronegative moiety of oxygen.
The enhanced Sr2+ adsorption performance of the synthesized PC-SO3H was compared to previously reported values for carbon-based adsorbents. As shown in Table 3, PC-SO3H exhibits outstanding or equivalent performance among carbon-based adsorbents including CNTs and graphenes which often require complex synthesis routes. As such, sulfonation of carbon materials is a viable facile method to produce economical adsorbents for Sr2+.
| Materials | Adsorption capacitya (mg g−1) |
|---|---|
| a Theoretical maximum Sr2+ adsorption capacity calculated by the Langmuir isotherm model. | |
| PC-SO3H | 18.97 (this work) |
| Oxidatively modified carbon | 0.48 (ref. 24) |
| Multi-walled CNT/iron oxide | 9.18 (ref. 25) |
| Graphene oxide | 23.66 (ref. 26) |
| Activated carbon | 12.11 (ref. 27) |
| MWCNTs–SMP hybrids | 14.92 (ref. 53) |
| Oxidized MWCNTs | 10.87 (ref. 53) |
Furthermore, the Sr2+ removal efficiency from aqueous solutions of low Sr2+ concentration is an important performance parameter when evaluating adsorbents, since these often represent conditions encountered in the environment. Sr2+ removal efficiencies of PC and PC-SO3H from aqueous solutions containing 5 mg L−1 and 10 mg L−1 Sr2+ are shown in Table 4. For 5 mg L−1 Sr2+ solution, the removal efficiencies were 99.9% and 75.6% for PC-SO3H and PC, respectively. These efficiencies reduced to 97.6% and 37.8% when the particles were dispersed in 10 mg L−1 Sr2+ solution. Hence, the data demonstrates the high removal efficiency of PC-SO3H when adsorbing trace amounts of Sr2+ in aqueous solutions.
| PC | PC-SO3H | |
|---|---|---|
| Removal efficiency at 5 mg L−1 | 75.6% | 99.9% |
| Removal efficiency at 10 mg L−1 | 37.8% | 97.6% |
| Kd at 10 mg L−1 (mL g−1) | 6.08 × 10² mL g−1 | 4.07 × 10⁴ mL g−1 |
The distribution coefficient (Kd, mL g−1), which represents the affinity between Sr2+ and adsorbent, is another indicator to verify the performance of adsorbents. Kd is calculated as follows:
 | (6) |
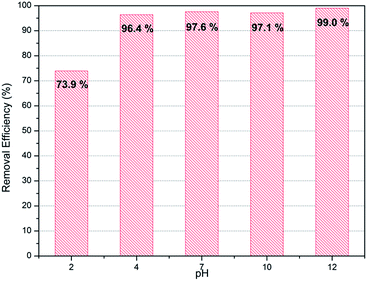
Normally removal efficiency of ions is affected by the pH of liquid. Therefore confirmation of adsorbents' performance in various pH conditions is important to ensure their applicability in industry. PC-SO3H was tested with the initial solution of varying pH conditions from 2 to 12. As show in Fig. 7, PC-SO3H shows high removal efficiency both in acidic (pH 4) as well as basic conditions (pH 10). However, it shows reduced adsorption performance in extreme acidic media with pH 2. On the other hands, adsorption capacity was increased by 99% in extremely basic solution with pH 12. That may be because the mechanism for the adsorption of PC-SO3H is based on ion exchange between proton and strontium, which may be hindered in acidic conditions and promoted in basic conditions.
Along with the removal efficiency the Sr2+ adsorption kinetics, more specifically the initial adsorption rate, is an important performance parameter. The adsorption kinetics of both carbon-based adsorbents was quantified using the following pseudo-second-order kinetics model:
 | (7) |
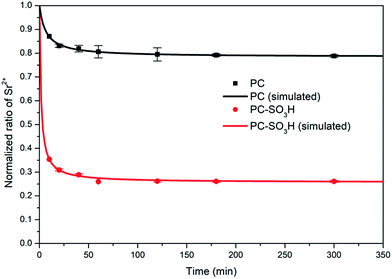 | ||
| Fig. 8 Normalized ratio of Sr2+ (C0 = 20 mg L−1) as a function of time. Lines represent the fits of the pseudo-second order rate equation. | ||
| PC | PC-SO3H | |
|---|---|---|
| Qe | 4.317 mg g−1 | 15.195 mg g−1 |
| k2 | 0.03532 g (mg−1 min−1) | 0.0444 g (mg−1 min−1) |
| R2 | 0.9938 | 0.9861 |
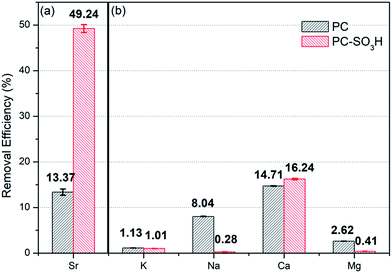
As demonstrated, the sulfonic acid groups of PC-SO3H promote the enhancement of Sr2+ removal performance (adsorption kinetics and capacity) when compared to PC. Moreover, the sulfonic acid groups improve the selectivity of the carbon-based adsorbent for trace amounts of Sr2+ when in the presence of excess competing ions, see Fig. 9. When dispersed in seawater PC-SO3H removed 49.24% of Sr2+ from seawater having 10 mg L−1 Sr2+ (Fig. 9(a)). Although the adsorption efficiency from seawater is much lower than pure water condition (97.6% for 10 mg L−1 Sr2+) due to the blocking effect caused by excess amount of other competing ions, however, PC removed only 13.37% of Sr2+ under the same condition. It should be noted that PC-SO3H is much more effective at removing Sr2+ from complex ionic solutions such as seawater. To better understand the effect of competing ions, a model solution consisting of 10 mg L−1 Sr2+, 400 mg L−1 K+, 10![[thin space (1/6-em)]](https://www.rsc.org/images/entities/char_2009.gif) 000 mg L−1 Na+, 200 mg L−1 Ca2+ and 1300 mg L−1 Mg2+ was used to re-evaluate the effect of competing ions. Compared to the Sr2+ adsorption from the Sr2+ diluted solution, the adsorption of Na+, K+ and Mg2+ is nearly negligible. Interestingly, removal efficiencies of PC-SO3H towards K+, Na+ and Mg2+ were even reduced compared to those of PC as shown in Fig. 9(b). It means that sulfonation not only improves the affinity towards Sr2+, but also inhibits the adsorption of competing ions at the same time. Especially for Na+, which accounts for the biggest part of cations in seawater, sulfonation in PC-SO3H can reduce Na removal by about 1/30 compared to the PC case. Bivalent Sr2+ can be more selectively bound to the sulfonic acid sites than monovalent Na+. That is an encouraging result and the functionalization of carbon with sulfonic acid group is an effective way for the selective removal of Sr2+ in contaminated water.
000 mg L−1 Na+, 200 mg L−1 Ca2+ and 1300 mg L−1 Mg2+ was used to re-evaluate the effect of competing ions. Compared to the Sr2+ adsorption from the Sr2+ diluted solution, the adsorption of Na+, K+ and Mg2+ is nearly negligible. Interestingly, removal efficiencies of PC-SO3H towards K+, Na+ and Mg2+ were even reduced compared to those of PC as shown in Fig. 9(b). It means that sulfonation not only improves the affinity towards Sr2+, but also inhibits the adsorption of competing ions at the same time. Especially for Na+, which accounts for the biggest part of cations in seawater, sulfonation in PC-SO3H can reduce Na removal by about 1/30 compared to the PC case. Bivalent Sr2+ can be more selectively bound to the sulfonic acid sites than monovalent Na+. That is an encouraging result and the functionalization of carbon with sulfonic acid group is an effective way for the selective removal of Sr2+ in contaminated water.
Conclusions
We have introduced a facile method to functionalize CO2-derived porous carbon materials with SO3H group for the Sr2+ removal in aqueous solutions. Due to the ion exchange between the proton in SO3H group and Sr2+ in the solution, synthesized PC-SO3H shows enhanced Sr2+ adsorption performance in terms of removal capacity, selectivity and kinetics. In addition, PC-SO3H provides outstanding selectivity towards Sr2+ even in aqueous solutions with excess amounts of competing ions though its exact mechanism is still needed to be studied. This work suggests a potential of functionalized carbons as adsorbents to remove the traced amounts of Sr2+ ions in contaminated water with nuclear wastes.Conflicts of interest
There are no conflicts to declare.Acknowledgements
The authors are grateful for the financial support from the UK Korea Joint Research Program through NRF grants (NRF-2015M2A7A1000219) funded by the Ministry of Science, ICT, and Future Planning. D. Harbottle acknowledges the support of Engineering and Physical Sciences Research Council grant number EP/M026426/1.Notes and references
- I. E. Agecy, Key world energy statistics, International Energy Agecy, 2016 Search PubMed.
- Y. Kim, Y. K. Kim, S. Kim, D. Harbottle and J. W. Lee, Chem. Eng. J., 2017, 313, 1042–1050 CrossRef CAS.
- S. Chegrouche, A. Mellah and M. Barkat, Desalination, 2009, 235, 306–318 CrossRef CAS.
- B. O. Boehm, S. Rosinger, D. Belyi and J. W. Dietrich, N. Engl. J. Med., 2011, 365, 676–678 CrossRef CAS PubMed.
- Y. K. Kim, Y. Kim, S. Kim, D. Harbottle and J. W. Lee, J. Environ. Chem. Eng., 2017, 5, 975–986 CrossRef CAS.
- A. Ahmadpour, M. Zabihi, M. Tahmasbi and T. R. Bastami, J. Hazard. Mater., 2010, 182, 552–556 CrossRef CAS PubMed.
- A. Shahzad, W. Miran, K. Rasool, M. Nawaz, J. Jang, S.-R. Lim and D. S. Lee, RSC Adv., 2017, 7, 9764–9771 RSC.
- M. R. Awual, T. Yaita, T. Taguchi, H. Shiwaku, S. Suzuki and Y. Okamoto, J. Hazard. Mater., 2014, 278, 227–235 CrossRef CAS PubMed.
- H.-M. Yang, S.-C. Jang, S. B. Hong, K.-W. Lee, C. Roh, Y. S. Huh and B.-K. Seo, J. Alloys Compd., 2016, 657, 387–393 CrossRef CAS.
- H. Yang, L. Sun, J. Zhai, H. Li, Y. Zhao and H. Yu, J. Mater. Chem. A, 2014, 2, 326–332 CAS.
- Z. Ning, M. Ishiguro, L. K. Koopal, T. Sato and J. i. Kashiwagi, Soil Sci. Plant Nutr., 2017, 63, 14–17 CrossRef CAS.
- D. Liu and H. Zheng, J. Radioanal. Nucl. Chem., 2017, 311, 1883–1890 CrossRef CAS.
- B. Yıldız, H. N. Erten and M. Kış, J. Radioanal. Nucl. Chem., 2011, 288, 475–483 CrossRef.
- H. Zhang, Y. K. Kim, T. N. Hunter, A. P. Brown, J. W. Lee and D. Harbottle, J. Mater. Chem. A, 2017, 5, 15130–15143 CAS.
- Y. F. Jia, B. Xiao and K. M. Thomas, Langmuir, 2002, 18, 470–478 CrossRef CAS.
- S. Biniak, M. Pakuła, G. S. Szymański and A. Świątkowski, Langmuir, 1999, 15, 6117–6122 CrossRef CAS.
- X. Mao, Z. Yan, T. Sheng, M. Gao, H. Zhu, W. Xiao and D. Wang, Carbon, 2017, 111, 162–172 CrossRef CAS.
- Y. Zhang, X. Lin, S. Hu, X. Zhang and X. Luo, RSC Adv., 2016, 6, 73959–73973 RSC.
- Y. Song, H. Ou, W. Bian, Y. Zhang, J. Pan, Y. Liu and W. Huang, J. Inorg. Organomet. Polym. Mater., 2013, 23, 1325–1334 CrossRef CAS.
- A. Y. Zhang, E. Kuraoka and M. Kumagai, Sep. Purif. Technol., 2006, 50, 35–44 CrossRef CAS.
- H. Liu, A. Yonezawa, K. Kumagai, M. Sano and T. Miyake, J. Mater. Chem. A, 2015, 3, 1562–1568 CAS.
- T. Li, F. He and Y. Dai, J. Radioanal. Nucl. Chem., 2016, 310, 1139–1145 CrossRef CAS.
- L. K. Dhandole, J. Ryu, J.-M. Lim, B.-T. Oh, J. H. Park, B.-G. Kim and J. S. Jang, RSC Adv., 2016, 6, 98449–98456 RSC.
- A. Khannanov, V. V. Nekljudov, B. Gareev, A. Kiiamov, J. M. Tour and A. M. Dimiev, Carbon, 2017, 115, 394–401 CrossRef CAS.
- C. Chen, J. Hu, D. Shao, J. Li and X. Wang, J. Hazard. Mater., 2009, 164, 923–928 CrossRef CAS PubMed.
- A. Y. Romanchuk, A. S. Slesarev, S. N. Kalmykov, D. V. Kosynkin and J. M. Tour, Phys. Chem. Chem. Phys., 2013, 15, 2321–2327 RSC.
- E. Kaçan and C. Kütahyalı, J. Anal. Appl. Pyrolysis, 2012, 97, 149–157 CrossRef.
- A. Y. Romanchuk, A. S. Kuzenkova, A. S. Slesarev, J. M. Tour and S. N. Kalmykov, Solvent Extr. Ion Exch., 2016, 34, 594–602 CrossRef CAS.
- E. W. Shin and R. M. Rowell, Chemosphere, 2005, 60, 1054–1061 CrossRef CAS PubMed.
- V. V. Kulkarni, A. K. Golder and P. K. Ghosh, RSC Adv., 2016, 6, 5341–5349 RSC.
- Z.-B. Zhang, X.-F. Yu, X.-H. Cao, R. Hua, M. Li and Y.-H. Liu, J. Radioanal. Nucl. Chem., 2014, 301, 821–830 CrossRef CAS.
- B. Aguila, D. Banerjee, Z. Nie, Y. Shin, S. Ma and P. K. Thallapally, Chem. Commun., 2016, 52, 5940–5942 RSC.
- Y. K. Kim, T. Kim, Y. Kim, D. Harbottle and J. W. Lee, J. Hazard. Mater., 2017, 340, 130–139 CrossRef CAS PubMed.
- J. Zhang and J. W. Lee, Carbon, 2013, 53, 216–221 CrossRef CAS.
- A. Byeon, J. Park, S. Baik, Y. Jung and J. W. Lee, J. Mater. Chem. A, 2015, 3, 5843–5849 CAS.
- Y. Kim, W. Lee, G. M. Kim and J. W. Lee, RSC Adv., 2016, 6, 54889–54897 RSC.
- S. Baik, B. L. Suh, A. Byeon, J. Kim and J. W. Lee, J. CO2 Util., 2017, 20, 73–80 CrossRef CAS.
- H. Yu, Y. Jin, Z. Li, F. Peng and H. Wang, J. Solid State Chem., 2008, 181, 432–438 CrossRef CAS.
- K. Nakajima and M. Hara, ACS Catal., 2012, 2, 1296–1304 CrossRef CAS.
- W. W. Mar and E. Somsook, Procedia Eng., 2012, 32, 212–218 CrossRef CAS.
- B. Xie, L. Hong, P. Chen and B. Zhu, Polym. Bull., 2015, 73, 891–908 CrossRef.
- S. Madakbaş, E. Çakmakçı and M. V. Kahraman, Thermochim. Acta, 2013, 552, 1–4 CrossRef.
- F. Liu, J. Sun, L. Zhu, X. Meng, C. Qi and F.-S. Xiao, J. Mater. Chem., 2012, 22, 5495 RSC.
- X. Li, S. P. Lau, L. Tang, R. Ji and P. Yang, Nanoscale, 2014, 6, 5323–5328 RSC.
- H. Huang, Y.-C. Lu, A.-J. Wang, J.-H. Liu, J.-R. Chen and J.-J. Feng, RSC Adv., 2014, 4, 11872 RSC.
- Q. Xu, P. Pu, J. Zhao, C. Dong, C. Gao, Y. Chen, J. Chen, Y. Liu and H. Zhou, J. Mater. Chem. A, 2015, 3, 542–546 CAS.
- B. P. Vinayan, Z. Zhao-Karger, T. Diemant, V. S. Chakravadhanula, N. I. Schwarzburger, M. A. Cambaz, R. J. Behm, C. Kubel and M. Fichtner, Nanoscale, 2016, 8, 3296–3306 RSC.
- Q. Xu, Y. Liu, C. Gao, J. Wei, H. Zhou, Y. Chen, C. Dong, T. S. Sreeprasad, N. Li and Z. Xia, J. Mater. Chem. C, 2015, 3, 9885–9893 RSC.
- U. Siemeling, H. Memczak, C. Bruhn, F. Vogel, F. Trager, J. E. Baio and T. Weidner, Dalton Trans., 2012, 41, 2986–2994 RSC.
- C. Xu, Q. Han, Y. Zhao, L. Wang, Y. Li and L. Qu, J. Mater. Chem. A, 2015, 3, 1841–1846 CAS.
- B. Ma, S. Oh, W. S. Shin and S.-J. Choi, Desalination, 2011, 276, 336–346 CrossRef CAS.
- Y. Park, Y.-C. Lee, W. S. Shin and S.-J. Choi, Chem. Eng. J., 2010, 162, 685–695 CrossRef CAS.
- N. Asadollahi, R. Yavari and H. Ghanadzadeh, J. Radioanal. Nucl. Chem., 2015, 303, 2445–2455 CAS.
- H. Yang, H. Li, J. Zhai, L. Sun, Y. Zhao and H. Yu, Chem. Eng. J., 2014, 246, 10–19 CrossRef CAS.
- J. L. Mertz, Z. H. Fard, C. D. Malliakas, M. J. Manos and M. G. Kanatzidis, Chem. Mater., 2013, 25, 2116–2127 CrossRef CAS.
Footnote |
| † Electronic supplementary information (ESI) available: SEM images, BET measurements details. See DOI: 10.1039/c7ra09541d |
| This journal is © The Royal Society of Chemistry 2017 |

