
 Open Access Article
 This Open Access Article is licensed under a Creative Commons Attribution-Non Commercial 3.0 Unported Licence
Investigating the lithium ion battery electrolyte additive tris (2,2,2-trifluoroethyl) phosphite by gas chromatography with a flame ionization detector (GC-FID)
Tim Daggerab,
Jonas Henschelab,
Babak Radc,
Constantin Lürenbauma,
Falko M. Schappachera,
Martin Winterabc and
Sascha Nowak *a
*a
aMEET Battery Research Center, Westfälische Wilhelms-Universität Münster, Corrensstr. 46, D-48149 Münster, Germany. E-mail: sascha.nowak@uni-muenster.de; Fax: +49 251 83 36032; Tel: +49 251 83 36735
bInstitute of Physical Chemistry, Westfälische Wilhelms-Universität Münster, Corrensstr. 28/30, D-48149 Münster, Germany
cHelmholtz Institute Münster, IEK-12, Research Center Jülich GmbH, Corrensstr. 46, D-48149 Münster, Germany
First published on 16th November 2017
Abstract
The quantification of lithium ion battery electrolyte additives provides challenges in terms of methods and instrumentation. In this work, the detectability of the flame retardant additive tris(2,2,2-trifluoroethyl) phosphite (TTFPi) differs unusually when added to a standard electrolyte (1 M LiPF6 in ethylene carbonate (EC)![[thin space (1/6-em)]](https://www.rsc.org/images/entities/char_2009.gif) :dimethyl carbonate (DMC) 1:1 wt%) using gas chromatography with a flame ionization detector (GC-FID). In this work, nuclear magnetic resonance (NMR), ion trap time of flight mass spectrometry (IT-TOF™ MS) and gas chromatography-mass spectrometry (GC-MS) are used to investigate a pure TTFPi solution and a standard battery electrolyte with TTFPi as an additive with regard to parasitic TTFPi consuming reactions and different TTFPi concentrations, respectively. NMR and IT-TOF™ MS measurements confirm the chemical stability of the TTFPi/standard electrolyte mixture and concentration dependent GC-MS and GC-FID experiments indicate a premature FID saturation limit for TTFPi in presence of standard electrolyte. The findings explain the counterintuitive absence of TTFPi for higher concentrations and provide important information for future sample preparation.
:dimethyl carbonate (DMC) 1:1 wt%) using gas chromatography with a flame ionization detector (GC-FID). In this work, nuclear magnetic resonance (NMR), ion trap time of flight mass spectrometry (IT-TOF™ MS) and gas chromatography-mass spectrometry (GC-MS) are used to investigate a pure TTFPi solution and a standard battery electrolyte with TTFPi as an additive with regard to parasitic TTFPi consuming reactions and different TTFPi concentrations, respectively. NMR and IT-TOF™ MS measurements confirm the chemical stability of the TTFPi/standard electrolyte mixture and concentration dependent GC-MS and GC-FID experiments indicate a premature FID saturation limit for TTFPi in presence of standard electrolyte. The findings explain the counterintuitive absence of TTFPi for higher concentrations and provide important information for future sample preparation.
1. Introduction
Lithium ion batteries (LIBs) provide high energy density as well as high power density. Therefore, LIBs represent the benchmark battery technology and are commonly used to power portable consumer electronics, plug-in hybrid (PHEVs) vehicles and battery electric vehicles (BEVs).1–3 Due to an increasing market share of electric vehicles (xEVs), the demand for LIBs is excessively growing. With currently over one billion cells in the market place and just few documented safety events, LIBs can be considered as relatively safe if treated responsibly.4 However, the safety of LIBs gets intense media attention. Reports of battery incidents including BEVs, children's toys and mobile phones raise people's awareness of the remaining safety challenges regarding LIB technology. Nowadays, LIBs comprise a graphite negative electrode, a highly energetic positive electrode out of layered metal oxides and an aprotic organic electrolyte. The electrolyte typically consists of a conducting lithium salt dissolved in a mixture of highly flammable carbonates;5,6 in the present example: 1 M LiPF6 in ethylene carbonate (EC):dimethyl carbonate (DMC) 1:1 wt%, LP30. The flammability of the electrolyte still offers room for further improvement in LIB safety. The usage of electrolyte additives that lower the electrolyte's flammability is a cost efficient strategy to improve LIB safety characteristics. Phosphorous agents are frequently used as flame retardant additives. Among them, the phosphites are used as functional electrolyte additives and can fulfill various tasks. Typical functions attributed to phosphites are the improvement of the capacity retention during cycling with elevated cut-off voltages,7–11 improvement of the thermal stability12 and the improvement of the cell safety due to reduction of the electrolyte's flammability.7,13–16
Nevertheless, phosphites applied in the standard electrolyte are likely to decompose due to oxidation on the cathode during prolonged cycling.8,10 They are even known to be consumed during storage due to spontaneous reactions with LiPF6.17 The flame retardant additive tris(2,2,2-trifluoroethyl) phosphite (TTFPi) was investigated towards its electrochemical performance in LIBs via gas chromatography methods, which are the commonly applied analytical techniques for this kind of investigations.18,19 However, post-mortem investigations of the TTFPi electrolyte that were applied in LIB cells revealed that the additive was not detectable during GC-FID measurements even though it could be easily detected by GC-MS experiments. In order to understand this phenomenon, GC-MS and GC-FID measurements with pure TTFPi and 5 wt% TTFPi in the standard LP30 electrolyte were repeated and deeply investigated. Fig. 1 displays the chromatograms of the same mixture of TTFPi in the LP30 electrolyte measured with GC-MS in Fig. 1a and with GC-FID in Fig. 1b. It is clearly observable, that the TTFPi is not detectable via GC-FID. However, pure TTFPi is detectable in GC-MS as well as in GC-FID (Fig. 1c and d).
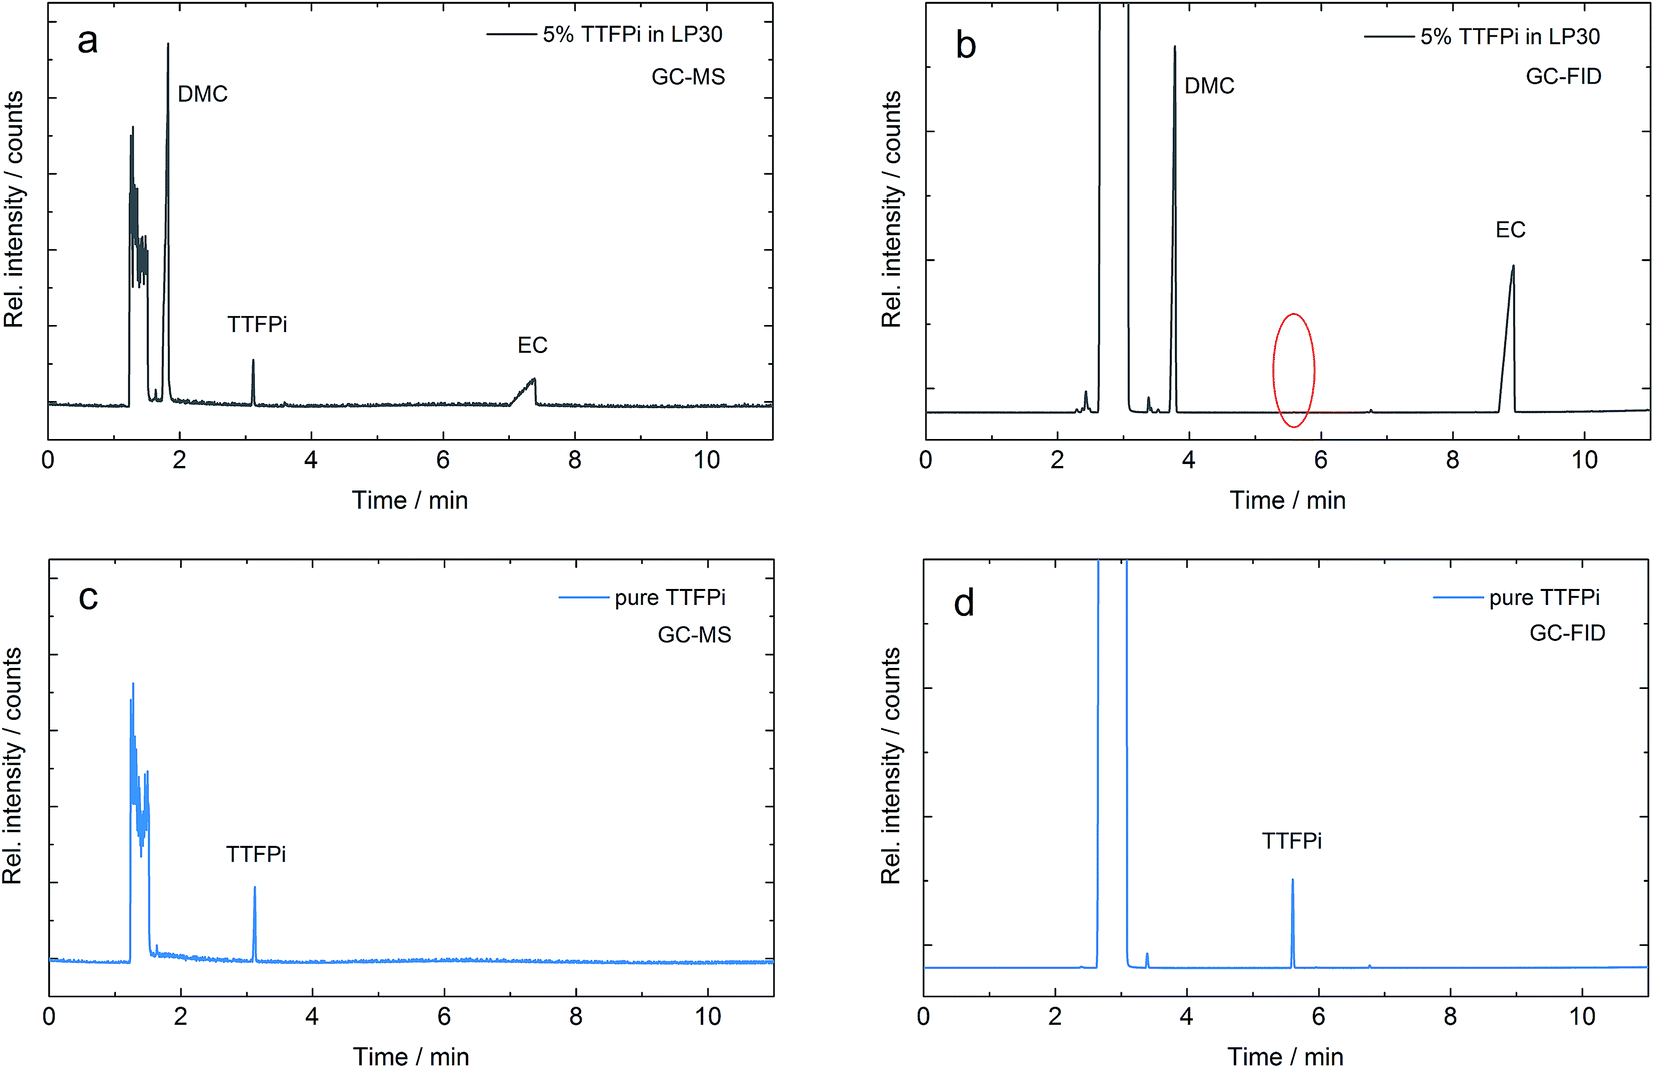 | ||
| Fig. 1 (a) GC-MS and (b) GC-FID measurements of the same mixture of 5 wt% TTFPi in LP30. (c) GC-MS and (d) GC-FID measurement of pure TTFPi. Samples are diluted (1:50) with acetonitrile. The missing TTFPi signal is indicated by a red circle. | ||
The findings serve as starting point and give the rise to the question why TTFPi cannot be detected in the GC-FID measurement after added to LP30. Therefore two hypotheses can be proposed:
(1) The molecule decomposes after addition to LP30. Apparent decomposition products reveal similar spectra to TTFPi and are therefore difficult to distinguish from TTFPi by GC-MS. Nevertheless, apparent decomposition is clearly visible in GC-FID.
(2) The molecule remains stable, but is harder to detect by GC-FID when added to LP30, indicating a severe matrix dependency. Therefore, samples of TTFPi in LP30 are easy to detect via GC-MS, but almost not visible during GC-FID experiments.
The first hypothesis is investigated by a comparison of the pure TTFPi with TTFPi in LP30 via NMR and high-resolution MS. Both methods are suitable and have been applied for the analysis of electrolyte constituents.20–23 Decomposition products in the solution of TTFPi with LP30 would indicate parasitic reactions of the additive and the electrolyte and thus confirm hypothesis 1.
The second hypothesis is reviewed with the help of GC-MS and GC-FID measurements using different concentrations of TTFPi. Since a diluted sample is not detectable, a more concentrated solution of TTFPi and LP30 would provide a TTFPi signal even in the GC-FID experiments.
2. Experimental
Two solutions of (I) pure TTFPi and (II) 5 wt% TTFPI in LP30 were investigated. Therefore, LP30 (1 M LiPF6 in ethylene carbonate (EC):dimethyl carbonate (DMC) 1:1 wt%) (battery grade, BASF) was mixed with 5 wt% TTFPi (>98.5%, Sigma Aldrich). Samples were diluted with acetonitrile (99.9% VWR) according to Table 1.
| Dilution number | Target TTFPi concentrations/mg g−1 | Actual TTFPi concentrations sd pure TTFPi/mg g−1 | Actual TTFPi concentrations sd 5 wt% TTFPi in LP30/mg g−1 |
|---|---|---|---|
| 1 | 0.25 | 0.19 | 0.28 |
| 2 | 0.75 | 0.77 | 0.71 |
| 3 | 1.25 | 1.53 | 1.04 |
| 4 | 2.00 | 2.33 | 2.03 |
| 5 | 3.00 | 3.12 | 2.67 |
| 6 | 3.50 | 3.91 | 3.26 |
Gas chromatography-mass spectrometry (GC-MS) measurements were performed using a Perkin Elmer GC-MS Clarus 600 including a Restek Rxi-5Sil MS column (30 m × 0.25 mm × 0.25 μm) with related TurboMass 5.4.2- and Clarity 7.3.0.0.95 software. At 200 °C injector temperature, 1 μL of the diluted sample was injected to the injector. Helium with a constant column flow of 1 mL min−1 was used as carrier gas. The method used a split of 1:20 and the following oven program: the initial temperature of 40 °C was held for 3 min, followed by a first ramp with a rate of 12 °C min−1 up to 85 °C, and a second ramp with 30 °C min−1 up to 200 °C (held for 1 min). Electron ionization with an ion source temperature of 250 °C and a detector voltage of 350 V at a filament voltage of 70 eV was applied. Recorded masses were in between m/z = 30–600.
The Perkin Elmer equipment offers two injectors. Therefore, quantitative experiments with detection via flame ionization (GC-FID) were performed using the same Perkin Elmer GC-MS Clarus 600 Chromatograph and a nonpolar Restek Rxi-5ms column (30 m × 0.25 mm × 0.25 μm). Software, temperature program and measurement properties were adapted from GC-MS measurements.
Nuclear Magnetic Resonance (NMR) experiments were performed using a Bruker Avance III 400 (400.03 MHz, 1H; 376.37 MHz, 19F; 161.93 MHz, 31P) spectrometer. All experiments were performed at 26.85 °C and were internally referenced to residual solvent resonances. Chemical shifts (δ) were reported in parts per million (ppm). Pure TTFPi and 5 wt% TTFPi in LP30 were diluted with pre-dried deuterated benzene (C6D6; water content less than 10 ppm) in an argon filled glovebox. For the purity check of TTFPi, 50 mg of TTFPi were dissolved in 600 μL C6D6. A J. Young NMR tube has been used for NMR experiments to avoid any contact with air. In order to analyze the chemical reactivity of TTFPi with LP30 and avoid any side reaction between the residual amount of HF (originated from LiPF6 in LP30) and glass, a fluorinated ethylene propylene (FEP) NMR tube (3 mm Ø, Wilmad-labglass) were used. The FEP tube containing 300 μL of sample was closed by a polytetrafluorethylene (PTFE) plug and placed in a J-Young NMR tube (5 mm Ø) containing 100 μL of benzene-d6 (C6D6, 99.6 at% D, Sigma Aldrich). In this way, any contact between the deuterated solvent and electrolyte mixtures, which could produce unwanted products, was prevented.
For qualitative investigation of pure TTFPi and TTFPi in contact with LP30, the LCMS-IT-TOF™ from Shimadzu (Kyoto, Japan) in the direct injection mode was used. Therefore, 1 μL sample was injected by the UHPLC Nexera X2 SIL-30AC auto sampler. It was directed to the hybrid ion trap time of light mass spectrometer (IT-TOF™ MS) with a flow rate of 0.2 mL min−1 (80:20 acetonitrile/water). The ionization was performed with electrospray ionization in the positive mode at 4.5 kV. The curved desolvation line temperature was 230 °C, the heat block temperature 230 °C and the nebulizing gas flow was set to 1.5 L min−1. The pressure of the nitrogen drying gas was 97 kPa, the detector voltage at 1.67 kV. The mass range was set from 150–2000 Da. For confirmation of the structure, MS4 experiments were performed. The collision induced dissociation energy (CID) was optimized for every MSn stage.
3. Results and discussion
3.1. Nuclear magnetic resonance
In order to investigate whether the TTFPi is chemical stable in LP30, and thereby question hypothesis 1, long-term NMR experiments were performed. The findings revealed, that pure TTFPi (>98.5%, Sigma Aldrich) contains some impurities of trifluoroethyl phosphate (TFP) (Fig. 2). Further, the measurements prove that TTFPi is stable in mixture with LP30. No decomposition products could be observed after three weeks of storage under inert atmosphere (Fig. 3).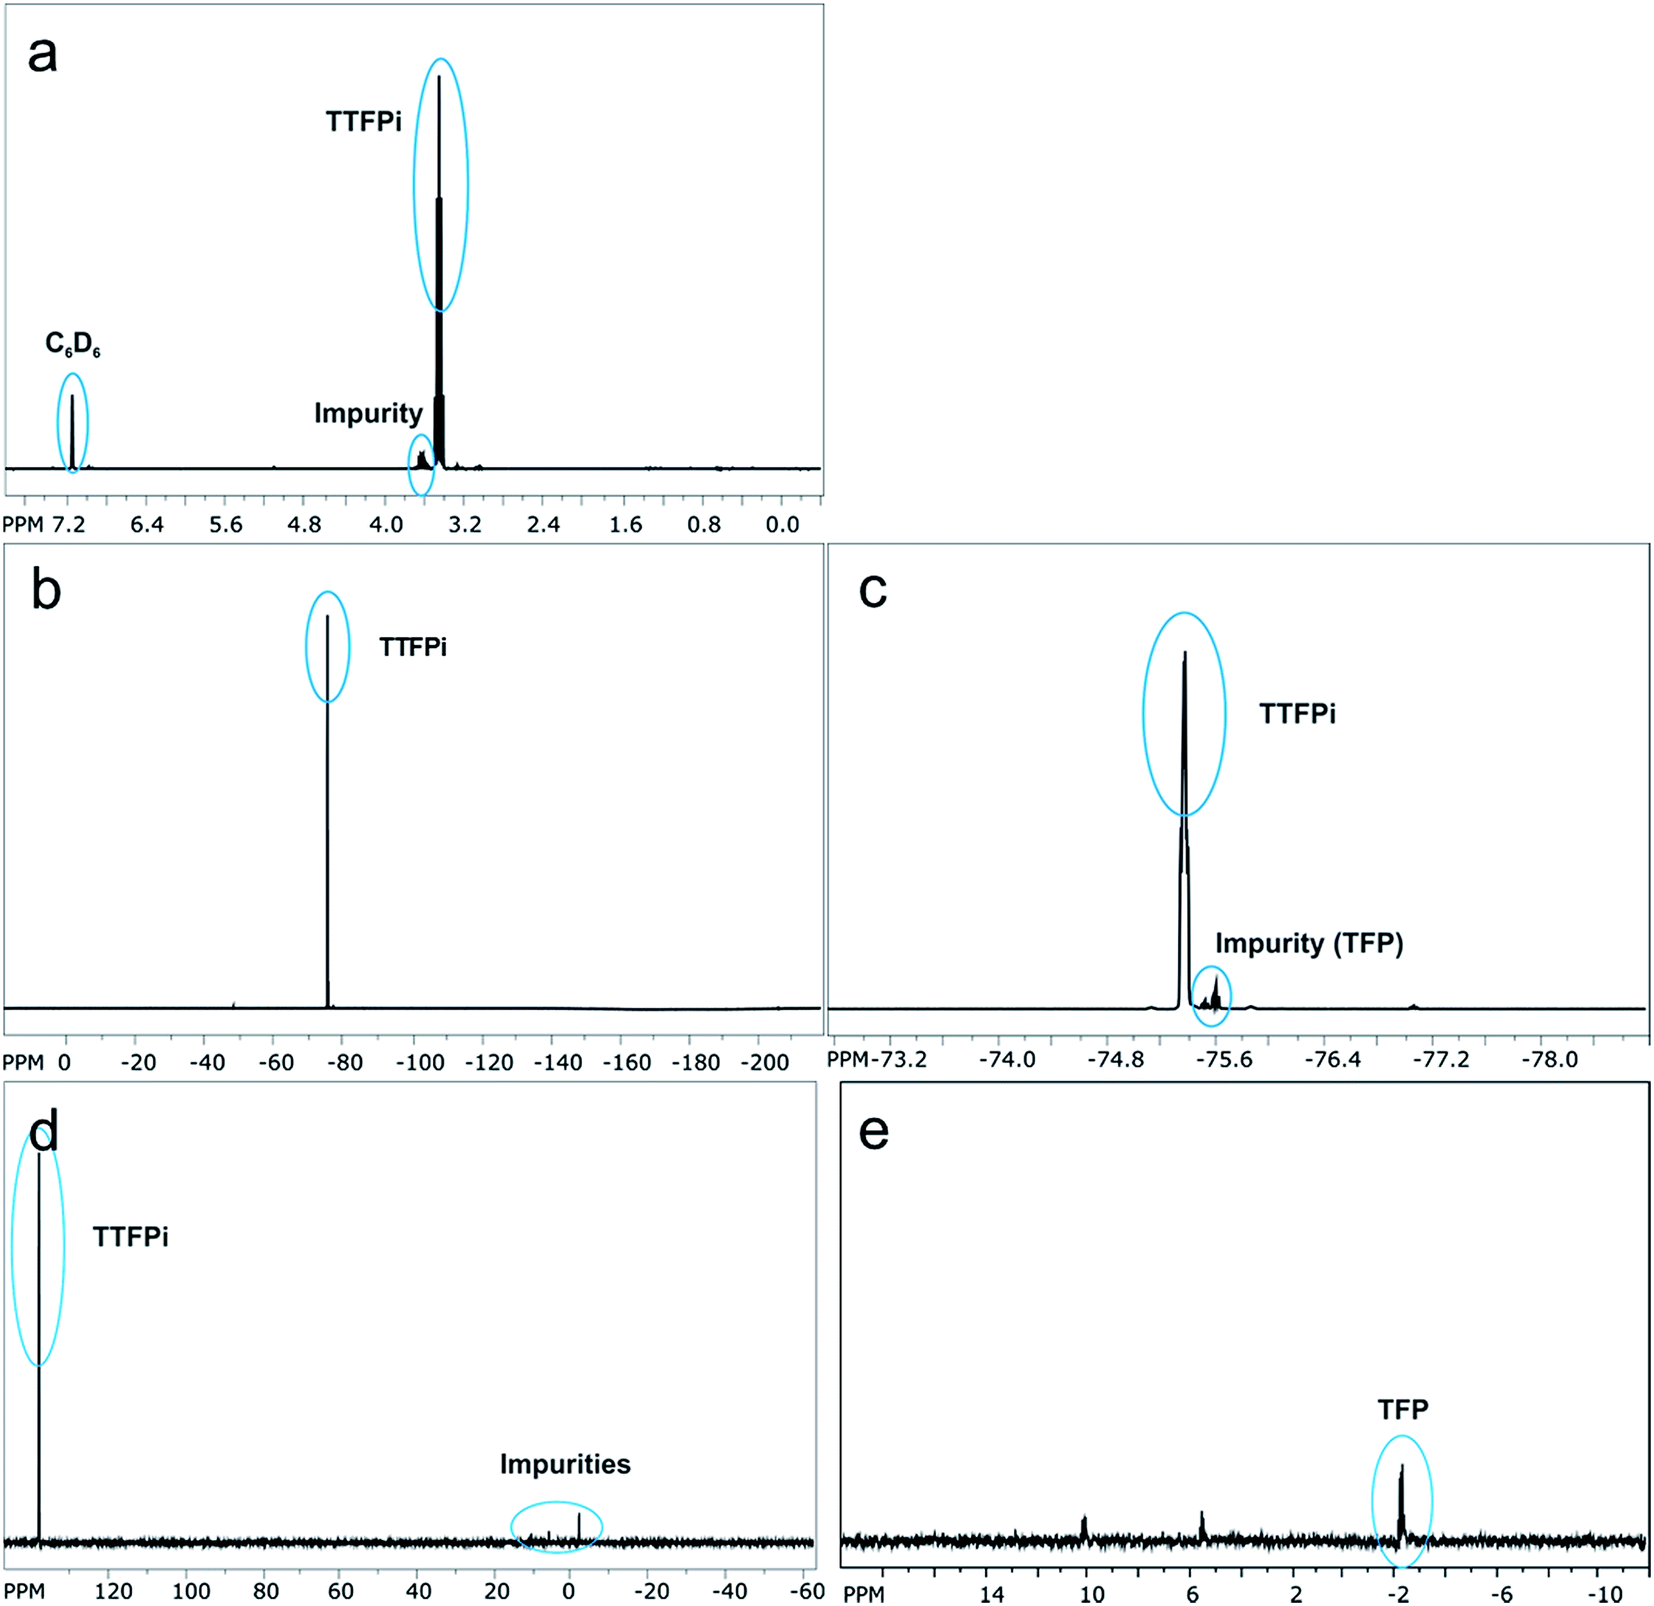 | ||
| Fig. 2 (a) 1H NMR-spectrum of pure TTFPi, (b) 19F NMR-spectrum of pure TTFPi, (c) zoom of 19F NMR-spectrum of pure TTFPi. (d) 31P NMR-spectrum of pure TTFPi. (e) Zoom of 31P NMR-spectrum of pure TTFPi. | ||
 | ||
| Fig. 3 NMR-spectra of the electrolyte containing 5 wt% additive investigated six weeks after formulation. (a) 19F NMR-spectrum of TTFPi. (b) 31P NMR-spectrum of TTFPi. | ||
3.2. Ion trap time of flight mass spectrometry
In order to investigate the stability of the TTFPi in LP30, solutions of pure TTFPi, pure LP30 and of a mixture of 5 wt% TTFPi with LP30 are measured using an ion trap of flight mass spectrometer (IT-TOF MS). The results of the single solutions can be compared with the mixture of TTFPi and LP30. Fig. 4a and b display the spectra of pure TTFPi. Fig. 4b is zoomed out, so that a wider scaling of the Y-axis is presented. The scale of Fig. 4b displays the same scale that is used in Fig. 4c and d for reasons of comparability. Fig. 4c shows the spectrum of LP30 and Fig. 4d presents a spectrum of 5 wt% TTFPi in LP30. The spectrum of TTFPi (Fig. 4a) shows a signal for the m/z value of 328.9963 (intensity of 360000 counts), which can be clearly attributed to TTFPi (molecular mass of 327.9911). In addition, a m/z value of 437.1945 (180000 counts) is visible. By comparison of the spectrum of LP30, which is depicted in Fig. 4c, with the spectrum of TTFPi mixed with LP30 depicted in Fig. 4d, just one additional signal is observable. This peak shows the m/z value of 328.9991 and can be attributed to TTFPi (mass deviation 2.13 ppm). The intensity of this signal (33000 counts) is in accordance to the dilution of TTFPi in LP30. The Fig. 4b–d provide the same scaling of the Y-axis, so that the intensities are roughly comparable. Besides the signal for TTFPi, there were no additional signals found in the spectra of Fig. 4d. This is an indication that no TTFPi decomposition products are formed. Therefore, it can be concluded that TTFPi is stable in LP30 according to the IT-TOF™ MS results.
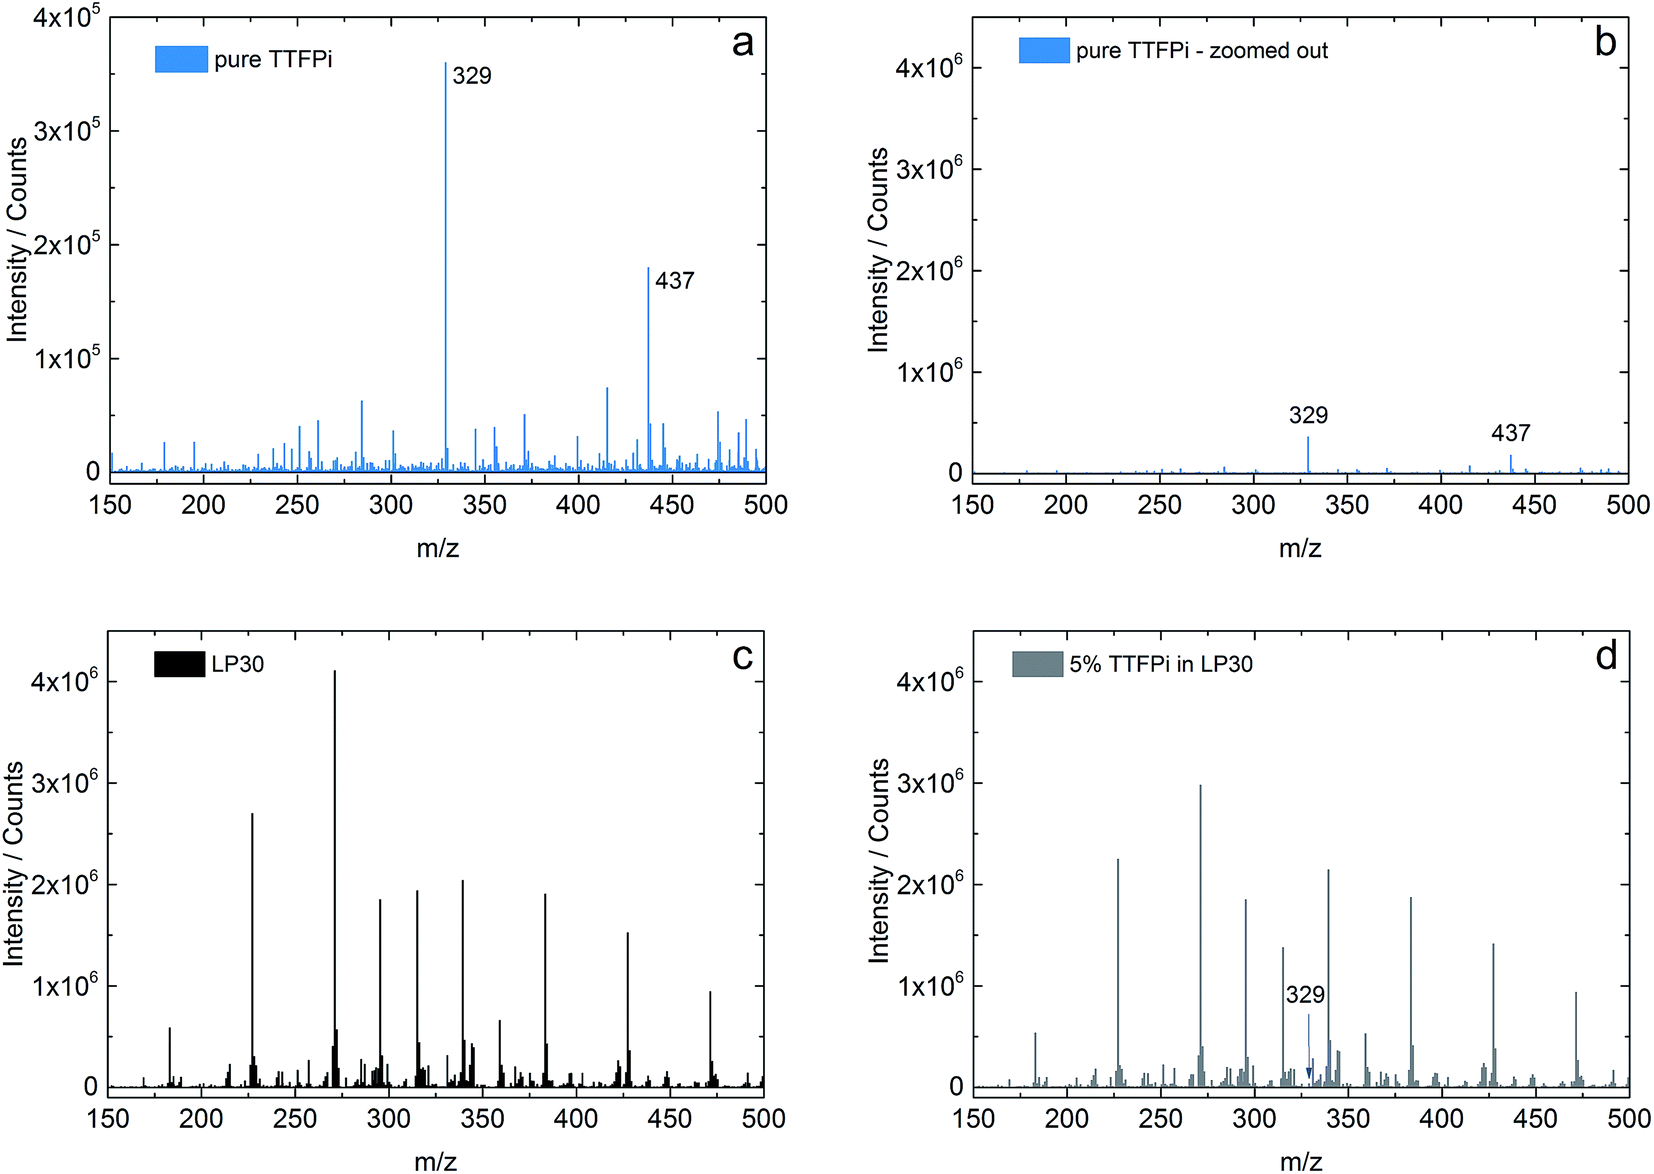 | ||
| Fig. 4 Mass spectra of pure TTFPi, LP30 and 5 wt% TTFPi in LP30 measured with IT-TOF™ MS. | ||
In order to specifically confirm the structure of the TTFPi, MS4 experiments are performed. The results of the MS4 fragmentation are presented in Fig. 5. With a m/z value of 328.9963 for pure TTFPi, the signal in Fig. 4d (m/z value of 328.9991) can be clearly attributed to TTFPi and not to a decomposition product with a similar spectrum as proposed in hypothesis 1. The IT-TOF™ MS results therefore confirm the NMR results in terms of the TTFPi stability in LP30. TTFPi is stable in LP30 and does not decompose. Consequently, it can be concluded, that hypothesis 1 is not valid:
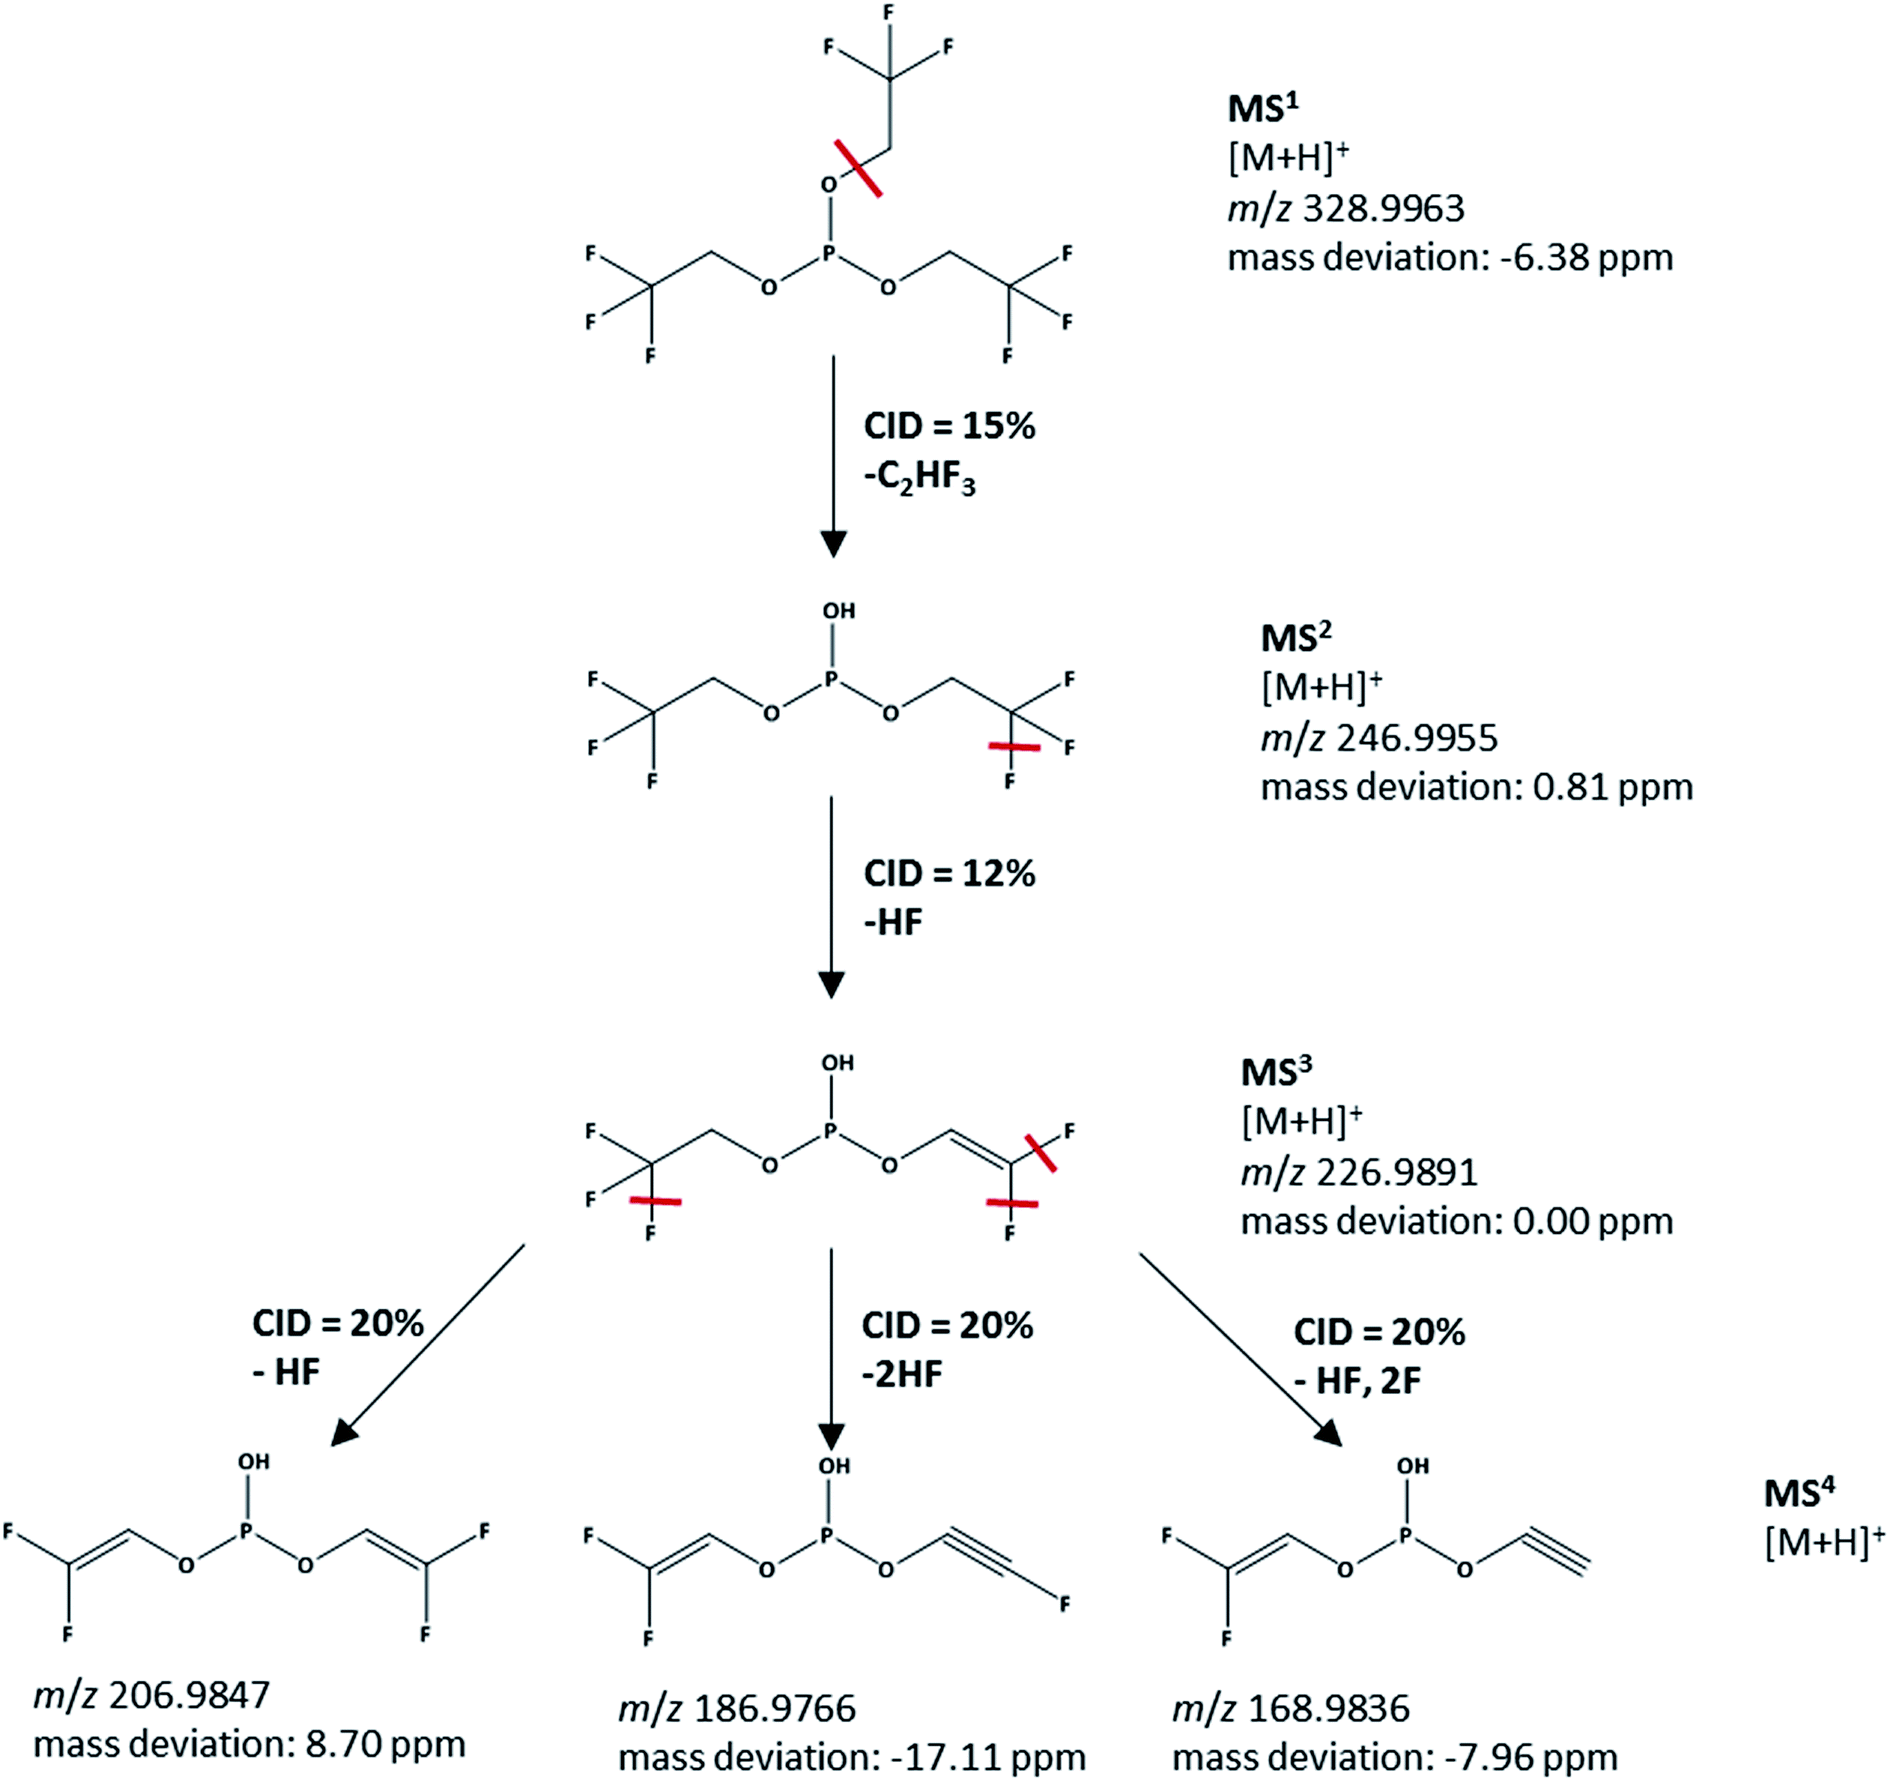 | ||
| Fig. 5 MS4 fragmentation pattern of pure TTFPi measured with IT-TOF™ MS. | ||
(1) The molecule decomposes after addition of LP30. Apparent decomposition products reveal similar spectra to TTFPi and are therefore difficult to distinguish from TTFPi by GC-MS. Nevertheless, the apparent decomposition process is clearly visible in the GC-FID results.
3.3. Concentration dependence of GC-MS and GC-FID measurements in comparison
In order to investigate whether according to hypothesis 2 a more concentrated solution of TTFPi and LP30 would provide a TTFPi signal even in the GC-FID experiments, two serial dilutions (sd) of TTFPi are investigated (Table 1).(2) The molecule remains stable, but is harder to detect by GC-FID when mixed with LP30, indicating a severe matrix dependency. Therefore, samples of TTFPi in LP30 are easy to detect via GC-MS, but almost not visible during GC-FID experiments.
The first sd includes 6 samples of pure TTFPi diluted in acetonitrile. The second sd includes 6 samples of 5 wt% TTFPi in LP30 diluted in acetonitrile. Both sd show comparable TTFPi amounts for each dilution of the series. Table 1 summarizes the target TTFPi concentrations of both sd, the actual concentration of the pure TTFPi sd and the actual TTFPi concentration of the sd of the 5 wt% TTFPi in LP30 mixture. It can be seen, that the TTFPi concentrations of both sd are comparable.
Fig. 6 combines the GC-MS and GC-FID results of the sd of pure TTFPi and TTFPi in mixture with LP30. The GC-MS measurements depicted in Fig. 6a show the decreasing TTFPi concentration in the samples 6 to 1 of diluted pure TTFPi. Even the smallest concentration of 0.19 mg g−1 is recognizable. With increasing TTFPi (3.2 min) concentrations of the dilution number 4, 5 and 6, the TFP (4.7 min) impurities appear clearer. The TFP impurities could also be detected via NMR measurements before. Regarding Fig. 6b, additional signals for DMC and EC can be attributed to the LP30. Furthermore, the decreasing concentration of TTFPi, TFP and EC from dilution number 6 to sample 1 is visible. In addition, the TFP signal is already observable in dilution number 3, even though the TTFPi concentration in dilution number 3 of the sd of TTFPi in LP30 is lower in comparison to the TTFPi concentration of the pure TTFPi sd (1.04 mg g−1 compared to 1.53 mg g−1). However, in both GC-MS results Fig. 6a and b the decreasing TTFPi concentration is visible.
 | ||
| Fig. 6 Results of concentration depending (a and b) GC-MS and (c) GC-FID measurements of pure TTFPi and 5 wt% TTFPi in LP30. Red circles indicate missing TTFPi peaks for higher concentrations. | ||
The results of the GC-FID measurements of both sd are shown together in Fig. 6c. Just like the GC-MS results, the GC-FID results of the pure TTFPi (blue) show a consistently decreasing TTFPi concentration. The TFP is already detectible in dilution number 1, which is two dilutions prior to the GC-MS measurements. Due to the lower LOD of the GC-FID measurement results appear more sensitive for TFP. The biggest difference between the results of the GC-MS and the GC-FID results is that the TTFPi concentration do not increase from dilution number 1 to dilution number 6. The TTFPi concentration just increases up to dilution number 3. Samples with the dilution numbers 4 to 6 which contained initially ≈2 mg g−1 to ≈3 mg g−1 TTFPi show no TTFPi signal.
Hypothesis 2 can partly be confirmed. TTFPi as flame retardant additive is in general hard to detect via FID. The molecule serves just six carbon atoms and is therefore hard to ionize. Especially in combination with the carbonates of the LP30 LIB electrolyte, the saturation point of TTFPi is reached early (between 1 mg g−1 and 2 mg g−1). Therefore, a higher concentration of TTFPi in mixture with LP30 does not provide increased TTFPi signals in the GC-FID measurements. A reason for that could be a lack of the TTFPi volatility that develop from methylation and ethylation of the TTFPi with linear carbonates during high temperature within the detector. Counterintuitively, a higher concentrated TTFPi LP30 mixture results in absence of TTFPi signals due to GC-FID saturation. However, flame extinguishment was reported for similar compounds which could hint on a likewise mechanism.24
The findings are of fundamental importance, since it is common practice to dilute GC-MS and GC-FID samples ≈1/100 (ref. 25 and 26) or ≈1/50 with acetonitrile. A dilution of 1:100 of 5 wt% TTFPi in LP30 would result in an overall concentration of ≈0.65 mg g−1 TTFPi which is below the saturation point. A dilution of 1:50 of 5 wt% TTFPi in LP30 with acetonitrile however, would result in an overall concentration of ≈1.3 mg g−1 TTFPi and might exceed the saturation limit. All in all, the same electrolyte which contains 5 wt% of TTFPi would show different results in the GC-FID measurements depending on its dilution with acetonitrile.
4. Conclusion
Within this study it was shown that the flame retardant electrolyte additive tris (2,2,2-trifluoroethyl) phosphite (TTFPi) provided a GC-FID saturation limit when combined with an organic carbonate solvent based electrolyte. The hypothesis that the TTFPi decomposes in presence of LP30 could be disproved by NMR and IT-TOF™ MS. The hypothesis that TTFPi remains stable, but is less detectable in presence of LP30 could be partly confirmed. An increased TTFPi-LP30 (1 M LiPF6 in ethylene carbonate (EC):dimethyl carbonate (DMC) 1:1 wt%) mixture resulted in the absence of TTFPi signals due to GC-FID saturation. Added to LP30 and acetonitrile, the saturation point of TTFPi for the FID was between 1 mg g−1 and 2 mg g−1. The results revealed that the sample preparation and sample dilution degree highly influenced the outcome of GC-FID TTFPi investigation. This finding is of great importance for post-mortem analysis of lithium ion battery electrolytes in which TTFPi are applied. Therefore, it is concluded that GC-FID measurements of fluorinated phosphites should be conducted in combination with further techniques like GC-MS. Further option are displayed by GC in combination with an electron capture detector (ECD) or a flame photometric detector (FPD). Future investigation could target the exact GC-FID TTFPi saturation limit of 5% TTFPi in LP30. Further it would be interesting to investigate the GC-FID saturation limit of pure TTFPi as well as the saturation limit of TTFPi in dependence of the LP30 concentration.
Conflicts of interest
There are no conflicts to declare.Acknowledgements
The authors would like to thank the German Federal Ministry of Education and Research (BMBF) for financial support. This work was conducted within the context of the project “Elektrolytlabor 4e” (03X4632). Marco Fritzen is acknowledged for help during sample preparation.References
- R. Wagner, N. Preschitschek, S. Passerini, J. Leker and M. Winter, J. Appl. Electrochem., 2013, 43, 481–496 CrossRef CAS.
- T. Placke, R. Kloepsch, S. Dühnen and M. Winter, J. Solid State Electrochem., 2017, 1–26 Search PubMed.
- P. Meister, H. Jia, J. Li, R. Kloepsch, M. Winter and T. Placke, Chem. Mater., 2016, 28, 7203–7217 CrossRef CAS.
- Z. J. Zhang, P. Ramadass and W. Fang, Lithium-Ion Batteries—Advances and Applications, ed. G. Pistoia, 2014, pp. 409–435 Search PubMed.
- R. W. Schmitz, P. Murmann, R. Schmitz, R. Müller, L. Krämer, J. Kasnatscheew, P. Isken, P. Niehoff, S. Nowak and G.-V. Röschenthaler, Prog. Solid State Chem., 2014, 42, 65–84 CrossRef CAS.
- C. Korepp, H. Santner, T. Fujii, M. Ue, J. Besenhard, K.-C. Möller and M. Winter, J. Power Sources, 2006, 158, 578–582 CrossRef CAS.
- N. von Aspern, S. Röser, B. Rezaei Rad, P. Murmann, B. Streipert, X. Mönnighoff, S. D. Tillmann, M. Shevchuk, O. Stubbmann-Kazakova, G.-V. Röschenthaler, S. Nowak, M. Winter and I. Cekic-Laskovic, J. Fluorine Chem., 2017, 198, 24–33 CrossRef CAS.
- S. Mai, M. Xu, X. Liao, J. Hu, H. Lin, L. Xing, Y. Liao, X. Li and W. Li, Electrochim. Acta, 2014, 147, 565–571 CrossRef CAS.
- Z. Li, Y. Zhang, H. Xiang, X. Ma, Q. Yuan, Q. Wang and C. Chen, J. Power Sources, 2013, 240, 471–475 CrossRef CAS.
- J. Pires, A. Castets, L. Timperman, J. Santos-Peña, E. Dumont, S. Levasseur, C. Tessier, R. Dedryvère and M. Anouti, J. Power Sources, 2015, 296, 413–425 CrossRef CAS.
- Y.-M. Song, J.-G. Han, S. Park, K. T. Lee and N.-S. Choi, J. Mater. Chem. A, 2014, 2, 9506–9513 CAS.
- H. Xu, S. Xie, Q. Wang, X. Yao, Q. Wang and C. Chen, Electrochim. Acta, 2006, 52, 636–642 CrossRef CAS.
- X. Yao, S. Xie, C. Chen, Q. Wang, J. Sun, Y. Li and S. Lu, J. Power Sources, 2005, 144, 170–175 CrossRef CAS.
- N. D. Nam, I. J. Park and J.-G. Kim, ECS Trans., 2011, 33, 7–15 CAS.
- T.-H. Nam, E.-G. Shim, J.-G. Kim, H.-S. Kim and S.-I. Moon, J. Power Sources, 2008, 180, 561–567 CrossRef CAS.
- S. Zhang, K. Xu and T. Jow, J. Power Sources, 2003, 113, 166–172 CrossRef CAS.
- X. Qi, L. Tao, H. Hahn, C. Schultz, D. R. Gallus, X. Cao, S. Nowak, S. Röser, J. Li and I. Cekic-Laskovic, RSC Adv., 2016, 6, 38342–38349 RSC.
- P. Murmann, X. Monnighoff, N. von Aspern, P. Janssen, N. Kalinovich, M. Shevchuk, O. Kazakova, G. V. Roschenthaler, I. Cekic-Laskovic and M. Winter, J. Electrochem. Soc., 2016, 163, A751 CrossRef CAS.
- X. Mönnighoff, P. Murmann, W. Weber, M. Winter and S. Nowak, Electrochim. Acta, 2017, 246, 1042–1051 CrossRef.
- C. Schultz, S. Vedder, M. Winter and S. Nowak, Anal. Chem., 2016, 88, 11160–11168 CrossRef CAS PubMed.
- S. Wiemers-Meyer, M. Winter and S. Nowak, Phys. Chem. Chem. Phys., 2016, 18, 26595–26601 RSC.
- S. Wiemers-Meyer, M. Winter and S. Nowak, Phys. Chem. Chem. Phys., 2017, 19, 4962–4966 RSC.
- S. Wiemers-Meyer, S. Jeremias, M. Winter and S. Nowak, Electrochim. Acta, 2016, 222, 1267–1271 CrossRef CAS.
- J. Riches, L. Knutsen, E. Morrey and K. Grant, Fire Saf. J., 2002, 37, 287–301 CrossRef CAS.
- M. Grützke, V. Kraft, W. Weber, C. Wendt, A. Friesen, S. Klamor, M. Winter and S. Nowak, J. Supercrit. Fluids, 2014, 94, 216–222 CrossRef.
- A. Friesen, C. Schultz, G. Brunklaus, U. Rodehorst, A. Wilken, J. Haetge, M. Winter and F. Schappacher, ECS Trans., 2015, 69, 89–99 CrossRef CAS.
| This journal is © The Royal Society of Chemistry 2017 |