 Open Access Article
Creative Commons Attribution 3.0 Unported Licence
A pharmaceutical hydrogen-bonded covalent organic polymer for enrichment of volatile iodine†
Lin Lina,
Heda Guana,
Donglei Zoua,
Zhaojun Donga,
Zhi Liub,
Feifan Xua,
Zhigang Xiec and
Yangxue Li *a
*a
aKey Lab of Groundwater Resources and Environment, Ministry of Education, Jilin University, 2519 Jiefangda Road, Changchun 130021, P. R. China. E-mail: yangxueli@jlu.edu.cn
bChangchun Institute of Urban Planning and Design, Changchun 13000, P. R. China
cState Key Laboratory of Polymer Physics and Chemistry, Changchun Institute of Applied Chemistry, Chinese Academy of Sciences, 5625 Renmin Street, Changchun 130022, P. R. China
First published on 27th November 2017
Abstract
Porous organic polymers (POPs) are emerging porous materials for various applications. So far, POPs are currently synthesised by a few limited synthetic chemical reactions, leading to a lack of new structures and properties. Thus, expanding structural diversity is highly desired for the development of this promising class of porous materials. Herein, adopting pharmaceutical isoniazid as a difunctional linker, a pharmaceutical hydrogen-bonded covalent organic polymer (pha-HCOP-1) has been synthesised for iodine enrichment. The structure and morphology are studied by TGA, FT-IR, FE-SEM, HR-TEM and 13C CP/MAS NMR. Powder X-ray diffraction and N2 adsorption–desorption analysis show that pha-HCOP-1 is amorphous and porous with a surface area of 217.31 m2 g−1. The pha-HCOPs are spherical particles with an average size of 20 nm. Due to the abundant porosity, π-conjugated phenyl rings, as well as functional –CO–NH– building units, pha-HCOP-1 exhibits a good adsorption ability for iodine molecules. The pha-HCOP-1 has a high uptake value of 131 wt% via vapor trapping adsorption. Meanwhile, pha-HCOP-1 also exhibits an outstanding iodine adsorption in solution, and the maximum adsorption capacity reaches as high as 833.33 mg g−1 analyzed using a Langmuir model. In addition, the thermodynamic parameters ΔG, ΔH and ΔS indicate that the adsorption of iodine by pha-HCOP-1 is feasible, spontaneous and endothermic. pha-HCOP-1 represents an elegant example of using pharmaceutical molecules as building blocks to construct porous POPs for reversible adsorption of radioactive iodine.
Introduction
Porous organic polymers (POPs), as the organic analogues of zeolites and metal–organic frameworks (MOFs), have become a rising star in the field of porous materials during the last few years by virtue of their large surface area along with facile synthesis and low skeleton density.1–9 To name a few, crystalline covalent organic frameworks (COFs) by Yaghi,10 covalent triazine-based frameworks (CTFs) by Antonietti and Thomas,11 hyper-cross-linked polymers (HCPs),12 amorphous conjugated microporous polymers (CMPs)13 by Cooper, polymers of intrinsic microporosity (PIMs) by Budd and McKeown,14 and porous aromatic frameworks (PAFs) by Zhu and Qiu15 have shown their outstanding properties and functions in gas storage and separation, catalysis, sensing and electronics.16–30 Generally, POPs are constructed from two monomer units through one type of coupling or condensation reaction, such as Sonogashira–Hagihara coupling, Yamamoto coupling, Suzuki coupling, alkyne–alkyne homo-coupling, imine condensation reactions, amide condensation reactions, boroxine ring condensation reactions and so on.31,32 However, compared to MOFs, the structural heterogeneity and functional diversity of POPs are quite restricted because of the finite synthetic chemical reactions and monotonous building blocks. Thus, it is a crucial and emergent task to avoid such limitations and allow multiple linkages for the construction of POPs.Inspired by the heterostructural mixed linker approach, which is commonly used in MOF, designing crystalline COFs with mixing blocks could create novel topologies and improve structural heterogeneity.33 For example, Jiang's group adopted a double-stage synthesis technique to construct new type of COFs with enhanced structural complexity and diversity, and Zhao's group developed COFs by reversible formations of two types of covalent bonds, respectively.34,35 Similarly, explorating amorphous POP materials with multiple linkages and various different multi-functional components might also be a powerful tool to advance the research progress of this class of porous materials.
With the increasing energy demand and environmental deterioration in the world nowadays, nuclear energy is becoming more and more popular because of its high energy density and no pollutant emission.36,37 During the normal operation of nuclear power plants, the radioactive waste would be generated from the nuclear fission of uranium.38,39 Among these radionuclides including 129I and 131I, 3H, 14CO2, and 85Kr, the radiological iodine attracts particular attention because of the long-lived isotope of 129I (half-life of 1.57 × 10⁷ years) and the involvement in human metabolic processes of 131I.40–42 In particular, the nuclear accident at Fukushima, Japan in 2011 has raised understanding of the urgent need for radiation protection and awareness of proper nuclear waste management. Hence, taking effective measures to control radioactive iodine pollution becomes a pressing problem in the field of environment.
In view of the specific activity and high volatile characteristic of the radioactive iodine, it is highly desired to develop effective methods for capture and storage of radioactive. Many methods have been reported on the treatment of radioactive I2. Adsorption, ion exchange, membrane separation, evaporation recovery, electrolysis and chemical precipitation are well-known processes to trap the radioactive iodine.42 Notably, among the methods mentioned above, adsorption has been proven to be a simple, clean, low cost and high-efficient method. So far, a variety of absorbents have been used for effective enrichment of radiological iodine, such as inorganic porous materials, metal–organic frameworks (MOFs) and porous organic polymers (POPs), etc.43–46 Among these absorbents, because of the intrinsic porous architectures and the devisable adsorption sites for iodine, the exploration of POPs in the capture of iodine is in full swing. Just recently, Zhu's and Deng's groups reported charged PAFs and CMP nanotubes used for efficient volatile iodine capture and storage, respectively.47,48 Despite the impressive progress in this area, it is still desirable to develop other novel improved materials for addressing iodine absorption.
Herein, starting from pharmaceutical isoniazid, a porous hydrogen-bonded covalent organic polymer (pha-HCOP-1) was designed and synthesized for iodine enrichment. The new material design relies on both the functionalization and structural chemistry: (1) incorporating monomers containing –CO–NH– functionality as material building blocks to enhance the binding affinity between the adsorbent and iodine molecules.49,50 (2) HCOPs constructed by two types of linkages and three different components, could expand structural diversity and complexity, thus providing a new phase for structural design and functional exploration.51–53 We have studied that pha-HCOP-1 served as a host framework for iodine enrichment. Additionally, as far as we know, the iodine adsorption and storage properties of pharmaceutical HCOPs is rare.
Experimental
Materials and measurements
All starting materials were purchased from commercial suppliers and used without further purification unless otherwise noted. Solvents were purified according to standard procedures. Trimethyl benzene-1,3,5-tricarboxylate, benzene-1,3,5-tricarbohydrazide and reference compound of INH–BA (isoniazid–benzaldehyde) were synthesized according to the reported literature.54–56 The thermogravimetric analysis (TGA) was performed using a NetzchSta 449c thermal analyzer system at the heating rate of 10 °C min−1 in air atmosphere. Elemental analyses were measured by Elementar model Vario Micro analyzer. The Fourier transform infrared spectrometer (FT-IR) spectra were measured using a Nicolet Impact 410 Fourier transform infrared spectrometer. The nitrogen adsorption isotherm was measured on an Autosorb iQ2 adsorptometer, Quantachrome Instruments. The powder X-ray diffraction (PXRD) was performed by a Riguku D/MAX2550 diffractometer using CuKα radiation, 40 kV, 200 mA with scanning rate of 4° min−1. Transmission electron microscopies (TEM) and high resolution transmission electron microscopies (HR-TEM) were recorded using a FEI Tecnai G2F20 s-twin D573 with an acceleration voltage of 300 kV. The TEM samples were prepared by drop-casting a supersonicated dichloromethane suspension of pha-HCOPs onto a copper grid. Field-scanning electron microscopies (FE-SEM) were performing on JEOLJXA-840 under an accelerating voltage of 15 kV. The FE-SEM samples were prepared by adhering pha-HCOP-1 powders to mica substrate using conductive tape and then coating with gold. The 1H-NMR spectra were recorded at 400 MHz in DMSO-d6 as internal standard with TMS, and the solid-state 13C cross polarization/magic angle spinning nuclear magnetic resonance (CP/MAS NMR) spectrum was recorded at 5 kHz. The X-ray photoelectron spectroscopy (XPS) was recorded on a ESCALAB 250Xi X-ray photoelectron spectroscopy.Synthesis of trimethyl benzene-1,3,5-tricarboxylate
Benzene-1,3,5-tricarboxylic acid (2 g) was added into 200 mL CH3OH, then TsOH (100 mg) was added in, then the mixture was heated to reflux for 48 h under N2 atmosphere. Next, the reaction was quenched with a saturated aqueous NaHCO3 solution and the resulting mixture was extracted with diethyl ether. The organic layer was washed with water and brine, then dried over Na2SO4. The solvent were evaporated in vacuo, yielding trimethyl benzene-1,3,5-tricarboxylate (2 g) as a white powder. 1H NMR (400 MHz, CDCl3) δ 8.86 (d, J = 1.5 Hz, 1H), 3.98 (s, 3H).Synthesis of benzene-1,3,5-tricarbohydrazide
Hydrazine monohydrate (5 mL) was added in portions to a solution of trimethyl benzene-1,3,5-tricarboxylate (1 g) in methanol. The mixture was stirred for 48 h under reflux, yielding white slurry. Then filtered and washed with methanol, yielding benzene-1,3,5-tricarbohydrazide as a white powder. 1H NMR (400 MHz, DMSO-d6) δ 9.83 (s, 1H), 8.32 (s, 1H), 4.58 (s, 2H).Synthesis of pha-HCOP-1
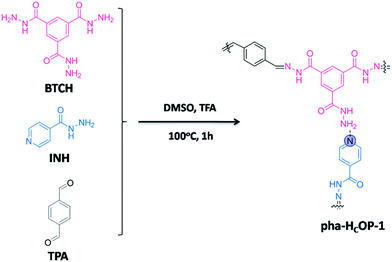
Into a 20 mL glass vial was added benzene-1,3,5-tricarbohydrazide (BTCH, 0.2 mmol, 0.05 g), isoniazid (INH, 0.3 mmol, 0.042 g), terephthalaldehyde (TPA, 0.3 mmol, 0.04 g), CF3COOH (TFA, 2 d) and a solution of dimethyl sulphoxide (DMSO, 10 mL). The reaction mixture was heated at 100 °C for 1 h to afford a yellow precipitate and washed with various organic solvents, such as methanol and acetone, to afford pharmaceutical hydrogen-bonded covalent organic polymer 1 (pha-HCOP-1) in 85% yields. Elemental analysis (wt%) calcd for {C32H40N9O4}n: C 62.52, H 6.56, N 20.51; found: C 60.55, H 6.16, N 21.44.Uptake of iodine
The solid iodine adsorption experiments were performed in the following manner. First, the pha-HCOP samples were placed into a sealed vessel, which filled with nonradioactive iodine vapor at 353 K and atmospheric pressure. Then, gravimetric method was conducted to determine the iodine uptake of pha-HCOPs at various time intervals. The uptake of iodine for pha-HCOPs samples were calculated according to the formula:
 | (1) |
To examine the adsorption capacity of iodine in hexane, the pha-HCOPs (10 mg) were immersed in the iodine/hexane solution (100–1000 mg L−1, 10 mL) and kept for a period of time. Then the absorbency of supernatant was measured by using UV-vis at various time intervals.
The removal efficiency (E, %) and the amount of iodine adsorbed qe (mg g−1) were given according to the formula:
 | (2) |
 | (3) |
Release of iodine
The samples with iodine uptake (named as I2@pha-HCOP-1, 10 mg) were immersed in the methanol solution (10 mL) and kept for a certain time. Then the absorbency of supernatant was measured by using UV-vis at various time intervals.Results and discussion
Physicochemical characterization of the adsorbents
Isoniazid (INH), with common name isonicotinic acid hydrazide has been well known as an essential anti-TB model drug at present.57 The structure of INH consists of two different reactive groups, pyridine N and hydrazine functionalities, allowing it as a bioactive bifunctional linker to link the other two monomers into frameworks. In our design, the pyridine N atoms of INH and amide H atoms of BTCH as hydrogen-bond acceptors and donors have been used to construct hydrogen bonds, whereas hydrazine of INH and aldehyde of TPA have been used for the preparation of hydrazone linkages. The combination of these hydrogen-bonds and hydrazone linkages using a bifunctional linker unit thus connects two different units with amino and aldehyde functionalities into a single HCOP material.Typically, pha-HCOP-1 was synthesized by solvothermal reaction of benzene-1,3,5-tricarbohydrazide (BTCH), isoniazid (INH) and terephthalaldehyde (TPA) in dimethyl sulphoxide (DMSO) with CF3COOH (TFA) as catalyst, at 100 °C for 1 hour, which afforded a yellow solid with 85% yield (Scheme 1). The pha-HCOPs were characterized by TGA, FT-IR, FE-SEM, TEM, HR-TEM, nitrogen adsorption, 13C CP/MAS NMR and PXRD.
To gain structural information about the pha-HCOPs, 13C CP/MAS NMR as well as FT-IR were acquired. As shown in Fig. S3,† the FT-IR spectra of pha-HCOPs show stretching modes at 1253 cm−1 that are characteristic of νC![[double bond, length as m-dash]](https://www.rsc.org/images/entities/char_e001.gif) N moieties. The characteristic peak of isoniazid at 1660 cm−1 in the pha-HCOPs whereas at 1667 cm−1 in free isoniazid, is due to the amide (C
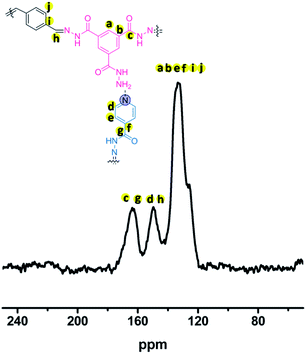
N moieties. The characteristic peak of isoniazid at 1660 cm−1 in the pha-HCOPs whereas at 1667 cm−1 in free isoniazid, is due to the amide (C![[double bond, length as m-dash]](https://www.rsc.org/images/entities/char_e001.gif) O stretching), consistent with a previous report.58 This indicates the successful incorporation of isoniazid into the network. The BTCH displays a strong band at 3299 cm−1 corresponding to stretching vibration of free amine. In the pha-HCOPs, the former band disappears, while a strong band appears at 3032 cm−1 indicating the H-bonding exist.59 Solid-state 13C CP/MAS NMR analysis provides further confirmation that pha-HCOPs are constructed from the hydrazone bonds. As shown in Fig. 1, the presence of –NH–N
O stretching), consistent with a previous report.58 This indicates the successful incorporation of isoniazid into the network. The BTCH displays a strong band at 3299 cm−1 corresponding to stretching vibration of free amine. In the pha-HCOPs, the former band disappears, while a strong band appears at 3032 cm−1 indicating the H-bonding exist.59 Solid-state 13C CP/MAS NMR analysis provides further confirmation that pha-HCOPs are constructed from the hydrazone bonds. As shown in Fig. 1, the presence of –NH–N![[double bond, length as m-dash]](https://www.rsc.org/images/entities/char_e001.gif) C– bonds formed between TPA and INH or BTCH are proved by the characteristic signals at 150.4 ppm. Except from the hydrazone bonds, all of the resonance signals between 120 and 170 ppm correspond to carbon atoms of the BTCH, INH and phenyl linkers.
C– bonds formed between TPA and INH or BTCH are proved by the characteristic signals at 150.4 ppm. Except from the hydrazone bonds, all of the resonance signals between 120 and 170 ppm correspond to carbon atoms of the BTCH, INH and phenyl linkers.
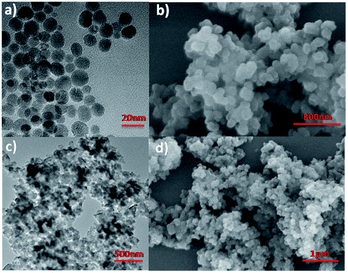
In order to probe the long-range structure of pha-HCOPs, transmission electron microscopy (TEM) and powder X-ray diffraction (PXRD) studies were performed. As shown in Fig. 2a and c, the TEM and HR-TEM images illustrate that the pha-HCOPs are isolated spherical nanoparticles with an average diameter of about 20 nm. FE-SEM was used to investigate the morphology of the pha-HCOPs which cast from the dichloromethane suspension on the Si wafer. SEM images also give similar spherical aggregates with an average diameter of 20 nm, as shown in Fig. 2b and d. The PXRD pattern of the pha-HCOPs is amorphous in nature as shown in Fig. S4.†
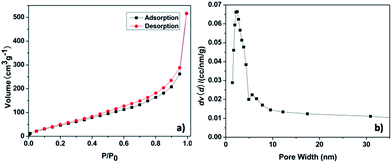
The thermal stability was investigated by TGA under air. TGA shows a good thermal stability of the pha-HCOPs, with 30% weight loss at temperature of 346 °C (Fig. S5†). The porosity of the pha-HCOPs was revealed by nitrogen sorption measurements at 77 K. The pha-HCOPs were degassed at 100 °C for 8 h before analysis. As shown in Fig. 3, the pha-HCOPs exhibit type II adsorption according to the IUPAC classification. The Brunauer–Emmett–Teller (BET) surface area and the total pore volume for pha-HCOP-1 are 217.31 m2 g−1 and 1.048 cm3 g−1. Majority of gas is absorbed at high relative pressures P/P0 > 0.90. Moreover, the pore size in pha-HCOPs mainly centered at 2.45 nm, as obtained by the non-local density functional theory (NLDFT).
Iodine capture
The good porous characters of these pha-HCOPs prompted us to investigate their adsorption properties for radical I2 molecules. We successfully carried out efficient iodine enrichment based on pha-HCOPs by exposing pha-HCOPs powder to excess iodine vapor in a closed system at 353 K and ambient pressure. As time went on, the color of the solid powder changed apparently, and the quality of pha-HCOPs after capture was measured by the gravimetric method. The adsorption equilibrium of pha-HCOPs were reached quickly (1–4 h) and no obvious weight gain of the samples were observed after 6 h. The saturated iodine loading of pha-HCOPs was measured to be 131 wt% (Fig. 4a). With this value, pha-HCOP-1 could be comparable to some metal–organic frameworks (MOFs)60 and even some recent CMPNs48 (Table S1†),while far exceeding the commercial activated carbon with 30 wt% iodine vapor uptake capability.40 The high iodine sorption capacity of pha-HCOP-1 is considered to be attributed to three main reasons: first, the specific surface area and porous structures may improve the adsorption capacity for iodine; second, the plentiful π-conjugated phenyl rings would lead to an increase in iodine uptake; third, the introducing of –CO–NH– functionality could lead to an enhancement for their interactions with iodine molecules.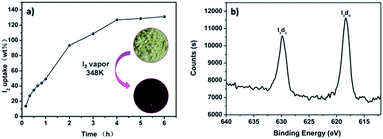 | ||
| Fig. 4 (a) Gravimetric uptake of iodine as a function of time at 353 K. Inset photographs showing the color change when pha-HCOP-1 was exposed to iodine vapor 4 h. (b) XPS spectrum of I2@pha-HCOP-1. | ||
For the iodine-loaded samples (named as I2@pha-HCOPs), the XPS spectroscopy indicated that the valence of the iodine adsorbed on the surface of pha-HCOPs is zero, confirming that the iodine remains neutral (Fig. 4b). After I2@pha-HCOPs were washed with ethanol three times, XPS verified the iodine encapsulated in the pores transformed into various polyiodide states such as I3− suggesting chemisorption taking place together with the physisorption (Fig. S6†).61 Furthermore, the FT-IR spectra illustrated that the iodine-loaded pha-HCOPs exhibited considerably enhanced N–H stretching vibrations compared to parent pha-HCOPs, suggesting noncovalent interactions between amine groups of pha-HCOPs with iodine (Fig. S7†). This is most likely due to the charge-transfer (CT) interactions between the N–H and C![[double bond, length as m-dash]](https://www.rsc.org/images/entities/char_e001.gif) O units as well as aromatic electron donor and iodine acceptor according to a previous literature.62 Thus, the –CO–NH– fragments and aromatic rings in the polymer skeleton might play a crucial role in the iodine capture.
O units as well as aromatic electron donor and iodine acceptor according to a previous literature.62 Thus, the –CO–NH– fragments and aromatic rings in the polymer skeleton might play a crucial role in the iodine capture.
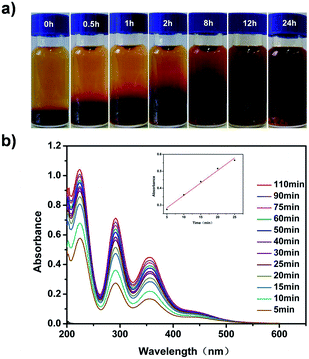
Furthermore, we found that the iodine adsorption of pha-HCOP-1 is reversible. To this end, the I2@pha-HCOPs were immersed in several organic solvents such as ethanol, methanol and hexane. As shown in Fig. 5a, when the I2@pha-HCOPs were immersed in methanol, the color of the solution was observed from colorless to dark brown. At suitable time intervals, the absorbency of solvent was monitored at the 288 nm show the release kinetics of sample I2@pha-HCOPs, and the I2 delivery is empirically adjusted as a zero-order reaction (Fig. 5b).
Iodine adsorption
Moreover, the iodine adsorption of pha-HCOPs was further investigated by immersing pha-HCOPs (10 mg) in iodine/hexane solution (100–350 mg L−1, 10 mL). And with adsorption process prolong, the dark purple solutions of iodine fade slowly to very pale red and finally colorless. The results demonstrated that the iodine was encapsulated into the pha-HCOP networks to successively generate iodine-loaded systems in solution.Adsorption dynamics analysis
In order to understand the iodine adsorption kinetics in pha-HCOP-1, the experimental data are processed by pseudo-first and second order kinetic models. The pseudo-first-order and pseudo-second-order kinetic models can be described as:63,64
ln(qe − qt) = ln![[thin space (1/6-em)]](https://www.rsc.org/images/entities/char_2009.gif) qe − k1t qe − k1t
| (4) |
 | (5) |
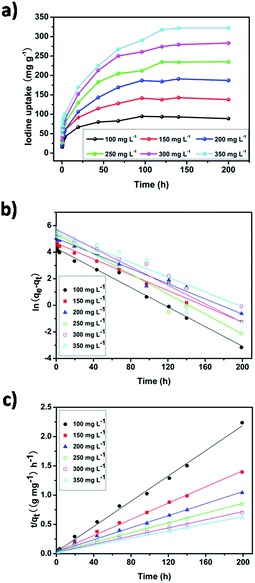
The effect of contact time and the initial solution concentration on the uptake of iodine by pha-HCOP-1 are presented in Fig. 6a. As expected, the amount of iodine adsorbed by pha-HCOP-1 increases with increasing contact time and increasing initial iodine concentration. 120 h were required for the pha-HCOP-1 to reach adsorption equilibrium. In the first 12 h, the adsorption capacity increased quickly, and then gradually became slowly until reaches the adsorption equilibrium in about 120 h. The maximum adsorption capacity and removal efficiency for pha-HCOP-1 were found to be 94.70 mg g−1 & 93.03%, 142.88 mg g−1 & 94.70%, 191.06 mg g−1 & 95.25%, 235.30 mg g−1 & 95.53%, 283.18 mg g−1 & 94.12%, and 322.27 mg g−1 & 94.39% with the initial concentration of 100–350 mg L−1, respectively.
Fig. 6b and c show the curve-fitting plots of the pseudo-first- and second-order models, respectively. As shown in Table 1, the adsorption process of pha-HCOP-1 to iodine fits well in pseudo-second order kinetics model and provides much better linear correlation coefficient R2 (0.99, 0.99, 0.99, 0.99, 0.99 and 0.99) than that of pseudo first-order kinetic model (0.99, 0.98, 0.97, 0.94, 0.99 and 0.94), which indicates that the iodine adsorption process in pha-HCOP-1 was dominated by the pseudo-second-order kinetic model instead of the pseudo-first-order model. Furthermore, the closer qe,cal calculated by pseudo-second-order model was also in accordance with the aforementioned conclusion. Moreover, this pseudo-second-order model effectively described the chemisorption-type process, and further verified the assumption of strong interaction between the surface and the adsorbate, confirming the formation of charge transfer complexes between iodine and the pha-HCOP-1 framework.65
| C0 (mg L−1) | Qe (exp) (mg g−1) | Pseudo-first order kinetics | Pseudo-second order kinetics | ||||
|---|---|---|---|---|---|---|---|
| K1 (h−1) | Qe (theor.) (mg g−1) | R2 | K2 ((mg g−1)h−1) | Qe (theor.) (mg g−1) | R2 | ||
| 100 | 94.70 | 0.037 | 71.98 | 0.99 | 0.0036 | 92.59 | 0.99 |
| 150 | 142.88 | 0.030 | 107.24 | 0.98 | 0.0016 | 144.93 | 0.99 |
| 200 | 191.06 | 0.029 | 155.35 | 0.97 | 0.00080 | 196.08 | 0.99 |
| 250 | 235.30 | 0.038 | 214.78 | 0.94 | 0.00068 | 238.10 | 0.99 |
| 300 | 283.18 | 0.028 | 236.65 | 0.99 | 0.00054 | 285.71 | 0.99 |
| 350 | 322.27 | 0.035 | 300.55 | 0.94 | 0.00045 | 322.58 | 0.99 |
Adsorption isotherms analysis
Temperature is another factor determining the maximum adsorption capacity. So batch experiments were performed in the temperature range of 288–308 K at different initial iodine concentrations (200–1000 mg L−1). The experimental adsorption isotherm data were then analyzed by classical Langmuir and Freundlich adsorption isotherms.The Langmuir sorption isotherm is one of the most common isotherm equations which is based on several basic assumptions, including (i) the adsorbent is structurally homogeneous; (ii) it is monolayer adsorption on the solid surface of adsorbate; (iii) the active sites are independent. The Langmuir isotherm model can be represented as:66
 | (6) |
 | (7) |
 | (8) |
RL > 1 unfavourable, RL = 1 linear, 0 < RL < 1 favourable, RL = 0 irreversible.
On the contrary, the well-known Freundlich isotherm, is based on adsorption on heterogeneous surface. The Freundlich isotherm can be represented as:68
| qe = KFC1/ne | (9) |
 | (10) |
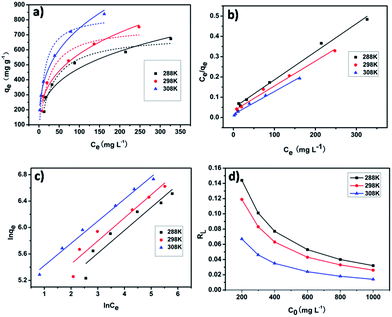
As shown in Fig. 7a–c, the experimental results showed that Langmuir adsorption isotherm could be well describe the iodine adsorption by pha-HCOPs. The values (qm, KL, KF, RL, n and R2) of the adsorption constants obtained from each model are tabulated in Tables 2 and 3, respectively. The values of R2 (0.91, 0.93 and 0.98) of the Freundlich isotherm were much lower than the values of R2 (0.99, 0.99 and 0.99) of the Langmuir isotherm. This suggests that the adsorption of iodine by pha-HCOP-1 is monolayer-type and homogeneous of iodine molecule on the surface of pha-HCOPs. The maximum adsorption capacity (qm) for iodine derived from the Langmuir equation are 714.29, 833.33 and 909.09 mg g−1 for 288, 298 and 308 K, respectively. Indeed, the qm is proportional to the solution temperature, indicating an increased affinity of iodine toward pha-HCOPs surface at higher temperature.
| Langmuir isotherm | Temperature (K) | Qm | KL | R2 |
|---|---|---|---|---|
| L | 288 | 714.29 | 0.030 | 0.99 |
| 298 | 833.33 | 0.037 | 0.99 | |
| 308 | 909.09 | 0.069 | 0.99 |
| Freundlich isotherm | Temperature (K) | KL | R2 | 1/n |
|---|---|---|---|---|
| F | 288 | 96.49 | 0.91 | 0.35 |
| 298 | 115.18 | 0.93 | 0.35 | |
| 308 | 162.08 | 0.98 | 0.34 |
It was found that the calculated value of RL for iodine adsorption by pha-HCOPs were in the range of 0.032–0.144, 0.026–0.119 and 0.014–0.067 at 288, 298 and 308 K, respectively. These values indicate that the adsorption of iodine by pha-HCOPs is a favorable adsorption and endothermal. As shown in Fig. 7d, the RL values decreased with the iodine concentrations showed that adsorption was more favorable at lower concentration.
Adsorption thermodynamics analysis
The mechanism involved in the adsorption, can be explained on the basis of some thermodynamic parameters such as the variation in free energy (ΔG) (kJ mol−1), enthalpy (ΔH) (kJ mol−1), and entropy (ΔS) (kJ mol−1), which can be calculated as follows:69
 | (11) |
ΔG = −RT![[thin space (1/6-em)]](https://www.rsc.org/images/entities/char_2009.gif) ln(Kd) ln(Kd)
| (12) |
 | (13) |
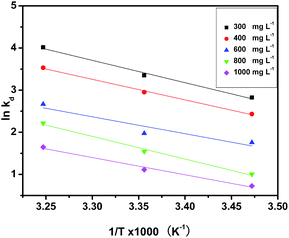
![[thin space (1/6-em)]](https://www.rsc.org/images/entities/char_2009.gif) Kd versus 1/T.
Kd versus 1/T.
The various Gibbs free energy (ΔG), adsorptions enthalpy (ΔH) and entropy (ΔS) for pha-HCOPs at the three temperatures studied were given in Table 4. The ΔG values calculated based on eqn (11) ranged from −6.76 to −10.29 kJ mol−1, −5.83 to −9.04 kJ mol−1, −4.20 to −6.83 kJ mol−1, −2.40 to −5.67 kJ mol−1 and −1.74 to −4.22 kJ mol−1, respectively, corresponding to temperatures of 288 K, 298 K and 308 K at different initial iodine concentrations. The decrease of ΔG values with the rise in temperature implies that higher temperature favors iodine sorption. The values of ΔH and ΔS were determined from the van't Hoff plots to be 43.95 kJ mol−1 and 0.18 kJ mol−1, 40.49 kJ mol−1 and 0.16 kJ mol−1, 33.39 kJ mol−1 and 0.13 kJ mol−1, 44.59 kJ mol−1 and 0.16 kJ mol−1, 33.89 kJ mol−1 and 0.12 kJ mol−1 for different concentrations, respectively (Fig. 8). Thermodynamically, the negative values of ΔG and the positive values of ΔH and ΔS at all temperatures, suggesting that the spontaneous and endothermic nature of the iodine adsorption by pha-HCOPs, and the adsorption is controlled by enthalpy.70 Moreover, the magnitude of ΔG and ΔH also indicates about the type of sorption process.71 In present study, the values of ΔG lies within the range of physisorption process whereas the values of ΔH corresponds to chemisorption range, suggesting chemisorption taking place together with the physisorption.72
| C0 (mg L−1) | ΔG (kJ mol−1) | ΔH (kJ mol−1) | ΔS (kJ mol−1 K−1) | ||
|---|---|---|---|---|---|
| 288 K | 298 K | 308 K | |||
| 300 | −6.76 | −8.30 | −10.29 | 43.95 | 0.18 |
| 400 | −5.83 | −7.31 | −9.04 | 40.49 | 0.16 |
| 600 | −4.20 | −4.89 | −6.83 | 33.39 | 0.13 |
| 800 | −2.40 | −3.82 | −5.67 | 44.59 | 0.16 |
| 1000 | −1.74 | −2.76 | −4.22 | 33.89 | 0.12 |
Conclusions
In conclusion, the porous pharmaceutical hydrogen-bonded covalent organic polymers have been constructed with the formations of two types of bonds using the pharmaceutical isoniazid as a bifunctional linker. Remarkably, such pha-HCOPs with porous property, and π-conjugated phenyl rings, as well as electronegative electron-donating –CO–NH– building units provide a great potential in harmful volatile gases (including I2, Br2 and Cl2) enrichment. As a result, the maximum iodine uptake of 131 wt% was obtained. This study not only sheds more light on extending of POP materials with new structures, but also may help lay the groundwork for the development of pha-HCOPs for remediation of radioactive iodine to address environmental issues.Conflicts of interest
There are no conflicts to declare.Acknowledgements
This work was supported by the National Natural Science Foundation of China (Project No. 21601177) and the 111 project (B16020).Notes and references
- H. X. Deng, S. Grunder, K. E. Cordova, C. Valente, H. Furukawa, M. Hmadeh, F. Gandara, A. C. Whalley, Z. Liu, S. Asahina, H. Kazumori, M. O'Keeffe, O. Terasaki, J. F. Stoddart and O. M. Yaghi, Science, 2012, 336, 1018–1023 CrossRef CAS PubMed.
- Y. Chen, H. J. Cui, J. Q. Zhang, K. Zhao, D. F. Ding, J. Guo, L. S. Li, Z. Y. Tian and Z. Y. Tang, RSC Adv., 2015, 5, 92573–92576 RSC.
- J. L. Pan, S. Jia, G. K. Li and Y. L. Hu, Anal. Chem., 2015, 87, 3373–3381 CrossRef CAS PubMed.
- C. J. Zhang, G. K. Li and Z. M. Zhang, J. Chromatogr. A, 2015, 1419, 1–9 CrossRef CAS PubMed.
- H. C. Zhou, J. R. Long and O. M. Yaghi, Chem. Rev., 2012, 112, 673–674 CrossRef CAS PubMed.
- S. Y. Ding and W. Wang, Chem. Soc. Rev., 2013, 42, 548–568 RSC.
- S. Lin, C. S. Diercks, Y. B. Zhang, N. Kornienko, E. M. Nichols, Y. Zhao, A. R. Paris, D. Kim, P. Yang, O. M. Yaghi and C. J. Chang, Science, 2015, 349, 1208–1213 CrossRef CAS PubMed.
- M. G. Schwab, B. Fassbender, H. W. Spiess, A. Thomas, X. L. Feng and K. Müllen, J. Am. Chem. Soc., 2009, 131, 7216–7217 CrossRef CAS PubMed.
- Y. L. Hu, H. X. Lian, L. J. Zhou and G. K. Li, Anal. Chem., 2015, 87, 406–412 CrossRef CAS PubMed.
- A. P. Cote, A. I. Benin, N. W. Ockwig, M. O'Keeffe, A. J. Matzger and O. M. Yaghi, Science, 2005, 310, 1166–1170 CrossRef CAS PubMed.
- P. Kuhn, M. Antonietti and A. Thomas, Angew. Chem., Int. Ed., 2008, 47, 3450–3453 CrossRef CAS PubMed.
- C. F. Martin, E. Stockel, R. Clowes, D. J. Adams, A. I. Cooper, J. J. Pis, F. Rubiera and C. Pevida, J. Mater. Chem., 2011, 21, 5475–5483 RSC.
- R. Dawson, D. J. Adams and A. I. Cooper, Chem. Sci., 2011, 2, 1173–1177 RSC.
- N. B. McKeown and P. M. Budd, Macromolecules, 2010, 43, 5163–5176 CrossRef CAS.
- T. Ben, H. Ren, S. Q. Ma, D. P. Cao, J. H. Lan, X. F. Jing, W. C. Wang, J. Xu, F. Deng, J. M. Simmons, S. L. Qiu and G. S. Zhu, Angew. Chem., Int. Ed., 2009, 48, 9457–9460 CrossRef CAS PubMed.
- X. D. Li, S. Q. Feng, F. Guo, X. Y. Liu, J. X. Yu and Z. W. Hou, RSC Adv., 2016, 6, 21517–21525 RSC.
- S. Y. Ding, M. Dong, Y. W. Wang, Y. T. Chen, H. Z. Wang, C. Y. Su and W. Wang, J. Am. Chem. Soc., 2016, 138, 3031–3037 CrossRef CAS PubMed.
- C. A. Wang, Y. F. Han, Y. W. Li, K. Nie, X. L. Cheng and J. P. Zhang, RSC Adv., 2016, 6, 34866–34871 RSC.
- X. Feng, X. Ding and D. Jiang, Chem. Soc. Rev., 2012, 41, 6010–6022 RSC.
- T. Mitra, R. S. Bhavsar, D. J. Adams, P. M. Budd and A. I. Cooper, Chem. Commun., 2016, 52, 5581–5584 RSC.
- Y. Zhu, H. Long and W. Zhang, Chem. Mater., 2013, 25, 1630–1635 CrossRef CAS.
- D. Thirion, Y. Kwon, V. Rozyyev, J. Byun and C. T. Yavuz, Chem. Mater., 2016, 28, 5592–5595 CrossRef CAS.
- R. Shen and H. Z. Liu, RSC Adv., 2016, 6, 37731–37739 RSC.
- L. M. Liu, H. Kai, K. Nagamine, Y. Ogawa and M. Nishizawa, RSC Adv., 2016, 6, 48630–48635 RSC.
- Y. F. Xu, Z. Li, F. Zhang, X. D. Zhuang, Z. Zeng and J. J. Wei, RSC Adv., 2016, 6, 30048–30055 RSC.
- W. J. Zhang, B. Aguila and S. Q. Ma, J. Mater. Chem. A, 2017, 5, 8795–8824 CAS.
- Q. Sun, Z. Dai, X. Meng, L. Wang and F. S. Xiao, ACS Catal., 2015, 5, 4556–4567 CrossRef CAS.
- X. W. Jiang, Y. F. Liu, J. Liu, Y. L. Luo and Y. N. Lyu, RSC Adv., 2015, 5, 98508–98513 RSC.
- Y. X. Li, Z. Y. Sun, T. T. Sun, L. Chen, Z. G. Xie, Y. B. Huang and X. B. Jing, RSC Adv., 2013, 3, 21302–21305 RSC.
- Z. G. Xie, C. Wang, K. E. de Krafft and W. B. Lin, J. Am. Chem. Soc., 2011, 133, 2056–2059 CrossRef CAS PubMed.
- S. Das, P. Heasman, T. Ben and S. L. Qiu, Chem. Rev., 2017, 117, 1515–1563 CrossRef CAS PubMed.
- L. Segura, M. J. Mancheňo and F. Zamor, Chem. Soc. Rev., 2016, 45, 5635–5671 RSC.
- Z. F. Pang, S. Q. Xu, T. Y. Zhou, R. R. Liang, T. G. Zhan and X. Zhao, J. Am. Chem. Soc., 2016, 138, 4710–4713 CrossRef CAS PubMed.
- X. Chen, M. Addicoat, E. Q. Jin, H. Xu, T. Hayashi, F. Xu, N. Huang, S. Irle and D. L. Jiang, Sci. Rep., 2015, 5, 14650, DOI:10.1038/srep14650.
- Y. F. Zeng, R. Y. Zou, Z. Luo, H. C. Zhang, X. Yao, X. Ma, R. Q. Zou and Y. L. Zhao, J. Am. Chem. Soc., 2015, 137, 1020–1023 CrossRef CAS PubMed.
- J. D. Vienna, Int. J. Appl. Glass Sci., 2010, 1, 309–321 CrossRef CAS.
- E. Kintisch, Science, 2005, 310, 1406 CrossRef CAS PubMed.
- D. F. Sava, M. A. Rodriguez, K. W. Chapman, P. J. Chupas, J. A. Greathouse, P. S. Crozier and T. M. Nenoff, J. Am. Chem. Soc., 2011, 133, 12398–12401 CrossRef CAS PubMed.
- R. C. Ewing and F. N. von Hippel, Science, 2009, 325, 151–152 CrossRef CAS PubMed.
- H. Ma, J. J. Chen, L. X. Tan, J. H. Bu, Y. H. Zhu, B. E. Tan and C. Zhang, ACS Macro Lett., 2016, 5, 1039–1043 CrossRef CAS.
- S. U. Nandanwar, K. Coldsnow, A. Porter, P. Sabharwall, D. E. Aston, D. N. McIlroy and V. Utgikar, Chem. Eng. J., 2017, 320, 222–231 CrossRef CAS.
- X. Y. Zhang, P. Gu, X. Y. Li and G. H. Zhang, Chem. Eng. J., 2017, 322, 129–139 CrossRef CAS.
- K. W. Chapman, P. J. Chupas and T. M. Nenoff, J. Am. Chem. Soc., 2010, 132, 8897–8899 CrossRef CAS PubMed.
- D. F. Sava, M. A. Rodriguez, K. W. Chapman, P. J. Chupas, J. A. Greathouse, P. S. Crozier and T. M. Nenoff, J. Am. Chem. Soc., 2011, 133, 12398–12401 CrossRef CAS PubMed.
- Z. J. Yin, S. Q Xu, T. G. Zhan, Q. Yan Qi, Z. Q. Wu and X. Zhao, Chem. Commun., 2017, 53, 7266–7269 RSC.
- H. Li, X. S. Ding and B. H. Han, Chem.–Eur. J., 2016, 22, 11863–11868 CrossRef CAS PubMed.
- Z. J. Yan, Y. Yuan, Y. Y. Tian, D. M. Zhang and G. S. Zhu, Angew. Chem., Int. Ed., 2015, 54, 12733–12737 CrossRef CAS PubMed.
- Y. F. Chen, H. X. Sun, R. X. Yang, T. T. Wang, C. J. Pei, Z. T. Xiang, Z. Q. Zhu, W. D. Liang, A. Li and W. Q. Deng, J. Mater. Chem. A, 2015, 3, 87–91 CAS.
- W. Z. Guo, E. Galoppini, R. Gilardi, G. I. Rydja and Y. H. Chen, Cryst. Growth Des., 2001, 1, 231–237 CAS.
- X. Qian, Z. Q. Zhu, H. X. Sun, F. Ren, P. Mu, W. D. Liang, L. H. Chen and A. Li, ACS Appl. Mater. Interfaces, 2016, 8, 21063–21069 CAS.
- L. Stegbauer, K. Schwinghammer and B. V. Lotsch, Chem. Sci., 2014, 5, 2789–2793 RSC.
- H. L. Nguyen, F. Gandara, H. Furukawa, T. L. H. Doan, K. E. Cordova and O. M. Yaghi, J. Am. Chem. Soc., 2016, 138, 4330–4333 CrossRef CAS PubMed.
- Y. X. Lin, X. F. Jiang, S. T. Kim, S. B. Alahakoon, X. S. Hou, Z. Y. Zhang, C. M. Thompson, R. A. Smaldone and C. F. Ke, J. Am. Chem. Soc., 2017, 139, 7172–7175 CrossRef CAS PubMed.
- Y. B. Wei, W. B. Chen, X. Y. Zhao, S. Y. Ding, S. Han and L. Chen, Polym. Chem., 2016, 7, 3983–3988 RSC.
- C. He, Z. H. Lin, Z. He, C. Y. Duan, C. H. Xu, Z. M. Wang and C. H. Yan, Angew. Chem., Int. Ed., 2008, 47, 877–881 CrossRef CAS PubMed.
- S. M. S. V. Wardell, M. V. N. de Souza, J. L. Wardell, J. N. Low and C. Glidewell, Acta Crystallogr., Sect. A: Found. Adv., 2007, 63, 879–895 CAS.
- Z. Toossi, J. Ellner and L. Friedman, Tuberculosis: Current Concepts and Treatment, CRC Press, Boca Raton, Florida, USA, 2001 Search PubMed.
- H. Qin, C. M. Wang, Q. Q. Dong, L. Zhang, X. Zhang, Z. Y. Ma and Q. R. Han, J. Magn. Magn. Mater., 2015, 381, 120–126 CrossRef CAS.
- C. Q. Kang, Z. Bian, Y. B. He, F. S. Han, X. P. Qiu and L. X. Gao, Chem. Commun., 2011, 47, 10746–10748 RSC.
- D. F. Sava, T. J. Garino and T. M. Nenoff, Ind. Eng. Chem. Res., 2012, 51, 614–620 CrossRef.
- T. Hasell, M. Schmidtmann and A. I. Cooper, J. Am. Chem. Soc., 2011, 133, 14920–14923 CrossRef CAS PubMed.
- Y. Z. Liao, J. Weber, B. M. Mills, Z. H. Ren and C. F. J. Faul, Macromolecules, 2016, 49, 6322–6333 CrossRef CAS.
- S. Lagergren, K. Sven. Vetenskapsakad. Handl., 1898, 24, 1–39 Search PubMed.
- Y. S. Ho, Ph. D. thesis, University of Birmingham, Birmingham, 1995.
- C. Falaise, C. Volkringer, J. Facqueur, T. Bousquet, L. Gasnot and T. Loiseau, Chem. Commun., 2013, 49, 10320–10322 RSC.
- I. Langmuir, J. Am. Chem. Soc., 1916, 38, 2221–2295 CrossRef CAS.
- T. W. Webi and R. K. Chakravort, AIChE J., 1974, 20, 228–238 CrossRef.
- H. M. F. Freundlich, Z. Phys. Chem., 1906, 57, 385–471 CAS.
- F. Tan, D. Sun, J. Gao, Q. Zhao, X. Wang, F. Teng, X. Quan and J. Chen, J. Hazard. Mater., 2013, 244, 750–757 CrossRef PubMed.
- R. H. Petrucci, General Chemistry, Macmillan, New York, 5th edn, 1989 Search PubMed.
- M. A. A. Salam, M. A. Gabal and A. Y. Obaid, Synth. Met., 2012, 161, 2651–2658 CrossRef.
- Y. Liu and Y. J. Liu, Sep. Purif. Technol., 2008, 61, 229–242 CrossRef CAS.
Footnote |
| † Electronic supplementary information (ESI) available: Characterization figure and supporting figures. See DOI: 10.1039/c7ra09414k |
| This journal is © The Royal Society of Chemistry 2017 |

