 Open Access Article
Creative Commons Attribution 3.0 Unported Licence
Strategy for the detection of mercury ions by using exonuclease III-aided target recycling
Minhao Xie *,
Kai Zhang
 ,
Feifan Zhu
 ,
Hao Wu
 and
Pei Zou
Key Laboratory of Nuclear Medicine, Ministry of Health, Jiangsu Key Laboratory of Molecular Nuclear Medicine, Jiangsu Institute of Nuclear Medicine, Wuxi, Jiangsu 214063, China. E-mail: xieminhaoi@jsinm.org
First published on 30th October 2017
Abstract
Herein, a simple, highly sensitive and selective exonuclease III (Exo III)-based sensor was developed for mercury ions Hg2+ detection without the need of complicated, high-cost and time-consuming labeling. In this strategy, two oligonucleotides were employed for the experiment design. DNA1 was prepared with one DNA strand which was designed as a quadruplex-forming oligomer, and which was constructed as 3′-protruding to ensure the probe cannot be digested by Exo III. When the target Hg2+ is introduced into the sensing system, it associates with DNA1 and DNA2 to form double strand DNAs (DNA1/DNA2 duplexes) which have a blunt 3′-terminus. Exo III then can degrade part of DNA1, releasing the DNA1 and Hg2+, and ultimately liberating the G-rich oligomer. This released G-rich oligomer folds into a G-quadruplex structure and thus allows the formation of DNAzyme in the presence of hemin. The formed DNAzyme can effectively catalyze the H2O2-mediated oxidation of ABTS, giving rise to a change in solution color. The released DNA1 and Hg2+ are free to bind to another 3′-protruding terminus of DNA1 to trigger a new digestion reaction, leading to significant amplification of the signal. The present new strategy shows a limit of detection as low as 66 pM and excellent selectivity toward Hg2+ over a wide range of metal ions.
Introduction
Heavy metals are highly toxic and dangerous pollutants. While some heavy metal pollutants come from fertilizers and sewage, industrial waste is the main source of heavy metal pollution.1 As one of the most toxic heavy metals, mercury with the feature of strong toxicity can cause serious human health problems even at very low concentrations.2 Mercury can enter the food chain, posing a threat to human health. The exposure to mercury can cause a number of toxicological effects such as brain damage, kidney failure, and motion disorders.3 Recognition of the toxic effects from minute concentrations of mercury has made it essential to monitor the level of mercury in aquatic environments. Traditional methods for Hg2+ quantification, include inductively coupled plasma mass spectrometry (ICP-MS), cold-vapor atomic fluorescence/absorption spectrometry (CV-AFS/CV-AAS) and ultraviolet–visible spectrometry, etc. are very sensitive and selective but require sophisticated and expensive instruments operated by professionals in a centralized laboratory. In order to overcome these drawbacks, it is still of great challenge to develop a new strategy for facile and sensitive detection of Hg2+.On the other hand, Hg2+ can bind directly to N3 of thymidine (T) in place of the imino proton and bridge two thymidine residues to form a T–Hg–T base pair. The Hg2+-mediated T–Hg2+–T pair is even more stable than the Watson–Crick A–T pair, without affecting the double-helical structure.4 Because of this property, many DNA sensors for Hg2+ detection based on fluorescence, colorimetry, electrochemistry, and resonance scattering have been constructed by rational design of DNA sequences.4–8
To realize ultrasensitive detection of these trace amounts of Hg2+, effective signal amplifications are commonly required. In recent years, the polymerase chain reaction (PCR)-like amplification strategies, including isothermal exponential amplification reaction (EXPAR), rolling circle amplification (RCA)9 and ligase chain reaction,10 have been incorporated into the biosensor strategy to achieve highly sensitive detection of targets. Although high sensitivity can be obtained by these PCR-like amplification strategies, these sensing strategies are limited due to the drawbacks of complex handing operation, easy contamination and longtime reaction.11–13 On the other hand, a new class of signal amplification strategies based on nuclease (exonuclease or endonuclease)-assisted target recycling has been reported. The nuclease with sequence specific activity can degrade the specific probe to release the target DNA strands to achieve target recycling amplification.14–18 This signal amplification strategy has been demonstrated to be useful in detection trace levels of proteins molecules or DNA targets. Unlike endonuclease which requires specific sequences for recognition, exonuclease has received increasing interest in target recycling-amplified DNA detection. For example, exonuclease III (Exo III), which catalyzed the stepwise removal of mononucleotides from 3′-termini, has been successfully used for amplifying detection of DNA targets13,15,19,20 small molecules and proteins.21,22 Despite the wide application of the nuclease-assisted recycling amplification in sensitive target detection, the extension of this technique for metal detection remains a major challenge because Exo III shows activity only on dsDNA strands.
Herein, a simple, highly sensitive and selective Exo III-based fluorescent sensor has been developed for Hg2+ detection without the need of complicated, high-cost and time-consuming labeling. Also, this method can be devised utilizing both the advantages of label-free architectures and signal-on architectures.
Experimental
Materials and chemicals
Oligonucleotides (guaranteed oligos, HPLC-purified) were purchased from Genscript Co., Ltd. (Nanjing, China). The sequence of the probe is as follows: DNA1: 5′-TTTGGGTAGGGCGGGTTGGGTACCCAAAATTCTTTCTT-3′; DNA2: 5′-TTGTTTGTTT-3′. Deionized (D. I.) water produced by a Milli-Q Millipore system (18.2 MΩ cm, Millipore Corp., Billerica, MA) was used for the preparation of all the solutions. ABTS (2,2-azinobis (3-ethylbenzothiazoline)-6-sulfonic acid), hemin, H2O2, and HEPES (4-(2-hy-droxyethyl) piperazine-1-ethanesulfonic acid sodium salt) were purchased from Aladdin Reagents (Shanghai, China) and used as supplied. All other chemicals and solvents were obtained from the commercial sources and used directly without any further purification. Hemin stock solution (1 mM) was prepared in dimethylsulfoxide (DMSO) and stored at −20 °C. ABTS2− and H2O2 solution were freshly prepared before used.Amplification reaction
Firstly, the mixture of DNA1 (2 μM, 10 μL), DNA2 (2 μM, 10 μL) and different concentration (0, 300, 500, 700, 800, 1000, 1500, 3000, and 5000 pM) of Hg2+ in 10 mM phosphate buffer solution (PBS, 0.1 M NaCl, pH 7.4) in a microtest tube incubated in room temperature for about 20 min to form the stem-loop structure DNA. Subsequently, the solution was incubated with 30 μL of 10 × NEBuffer solution containing 20 U Exo III at 37 °C for 20 min. Finally, the resulting mixtures were heated at 90 °C for 10 min to deactivate the Exo III. For control experiment, the Pb2+, Cu2+, Cd2+, and Zn2+ were used.Gel electrophoresis
Denaturing polyacrylamide gel electrophoresis (PAGE) (20%) was carried out in 1× TBE buffer at a 100 V constant voltage for 1 h. The mixture of DNA1, DNA2 and Hg2+ was incubated in Exo III solution (20 U) at 37 °C for 1 h. Afterword, digestions were stopped by heating at 90 °C for 20 min. Then, the resulting mixtures were heated at 90 °C for 10 min to deactivate the Exo III. The gel was taken photograph under UV light after staining with EtBr for 15 min. The concentration of each DNA is 1 μM.Colorimetric measurement
The above mentioned solutions were moved to 96-well microtiter plates. 4 μL of hemin (10 μM) and 126 μL of HEPES buffer (25 mM HEPES, 20 mM KCl, 200 mM NaCl, 0.05% Triton X-100, and 1% DMSO, pH 7.4) were then added, and the mixture was incubated for 60 min at room temperature. ABTS2− and H2O2 (20 μL in total) were added to the mixture to reach final concentrations of 6 mM and 2 mM, respectively. Absorption intensity of the solutions were taken after 5 min of color development.Instrumentation
The absorption intensities were recorded by a SpectraMax M5 Multi-Mode Microplate Readers (Molecular Devices, USA), using a Costar 96 well microtiter plate (No. 3599, Corning, New York, USA).Results and discussion
Mechanism of this strategy
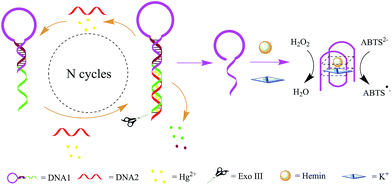
The working principle of the designed Exo III amplification and DNAzyme canalization based colorimetric biosensor is illustrated in Scheme 1. The system mainly consists of DNA1 and DNA2. DNA1 includes three domains: the classical G-rich sequence which can form a G-quadruplex in the presence of hemin and K+, the sequence that is complementary to part of G-rich sequence and the sequence that is complementary to DNA2 at the help of Hg2+. | ||
| Scheme 1 Schematic illustration of the Exo III and G-quadruplex-based strategy for the detection of Hg2+. | ||
DNA1 was prepared with one DNA strand which designed as a quadruplex-forming oligomer, and which was constructed as 3′-protruding to ensure the probe cannot be digested by Exo III since Exo III only cleaves dsDNA strands with blunt of 3′-recessing termini. However, when the target Hg2+ is introduced into the sensing system, it associates with DNA1 and DNA2 to form double strand DNAs (DNA1/DNA2 duplexes) which have a blunt 3′-terminus. Exo III then can degrade part of DNA1, releasing the DNA1 and Hg2+, and ultimately liberating the G-rich oligomer. This released G-rich oligomer folds into a G-quadruplex structure and thus allows the formation of DNAzyme in the presence of hemin. The formed DNAzyme can effectively catalyze the H2O2-mediated oxidation of ABTS (λmax = 418 nm), giving rise to a change in solution color. The released DNA1 and Hg2+ are free to bind to another 3′-protruding terminus of DNA1 to trigger a new digestion reaction, leading to significant amplification of the signal.
Feasibility study
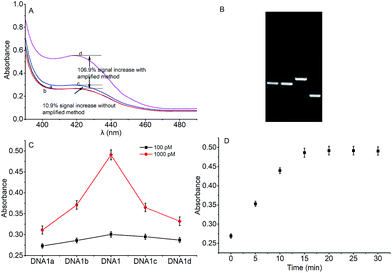
To verify the feasibility of quantitative detection, the UV-vis absorption intensity changes under different conditions were investigated. As shown in Fig. 1, the absorption of the mixture of DNA1 and DNA2 (curve a), and the mixture of DNA1 and DNA2 with Hg2+ (3000 pM) (curve b) was relatively low. Upon addition of Exo III to the DNA1/DNA2 mixture without Hg2+, the absorption intensity increase was only 10.9% (curve c). However, when both Hg2+ (3000 pM) and Exo III were present in the solution, we observed 106.9% increase in the absorption intensity (curve d). The amplification reactions were further verified by using denaturing polyacrylamide gel electrophoresis (PAGE), and the results showed that Hg2+ and Exo III can start amplification reaction and produce G-rich oligomer (line 1, product c).Optimization of conditions
According to the proposed Hg2+ assay mechanism, the number of the T–T mismatch base pairs should be carefully selected. To meet this requirement and select the best sequence, five versions of T-rich DNA were designed for test (Table 1). The DNAs were used to fabricate the amplification system with the same method and under the same condition. In order to obtain the highest sensitivity of the sensor, current changes of the five T-rich DNAs for 100 pM and 1000 pM Hg2+ were used for comparison. As shown in Fig. 1C, the results demonstrated that the DNA1 had the highest absorbance.Incubation times will affect the formation of the T–Hg2+–T base pairs. The proposed sensor was used for the detection of 1000 pM Hg2+ with different reaction time. As shown in Fig. 1D, the absorbance signals reached the maximum at 15 min, suggesting that the reaction of DNA and Hg2+ have finished. But in consideration of the influence of the Hg2+–DNA reaction, 20 min was finally selected as the reaction time.
Sensitivity and selectivity of the Hg2+ sensing system
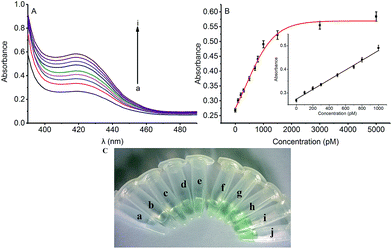
To assess the sensitivity of the strategy, the detection of Hg2+ based on Exo III amplification was tested. In the absence of Hg2+, the DNA1 existed in a duplex structure, upon addition of hemin, the colorimetric signal of such a mixture was very weak due to the weak interaction between the G-rich sequence and hemin. Upon the addition of Hg2+ which was combined with the DNA1 and DNA2, triggering Exo III assisted amplification reaction and releasing the G-rich oligomer to fold into quadruplex structure. Thus, the colorimetric signal was turned “on”. As shown in Fig. 2A, the colorimetric signal intensity increased when the concentration of Hg2+ was raised from 0 to 5000 pM, indicating that the release of the quadruplex-forming oligomer is highly dependent on the concentration of Hg2+. Fig. 2B shows the corresponding calibration plot of the concentration of Hg2+ versus the UV-vis absorption intensity, in which the detection limit was calculated to be 66 pM according to the responses of the blank tests plus 3 times the standard deviation (3σ). A good linear range from 0 to 1000 pM was shown in the insert of Fig. 2B. The fitting equation of the curve shown in the insert of Fig. 2B is Y = 0.00021X + 0.274 (R2 = 0.991), where Y is the absorption intensity and X is the concentration of Hg2+. Such low detection limit (66 pM) for Hg2+ detection is even lower to some existing signal amplification methods that using amplification strategy14 and nearly 2 orders of magnitude lower to other previously reported Hg2+ detection systems based on catalytic DNAzyme.23The color change in the presence of various concentrations of Hg2+ was also monitored by the naked eye (colorimetric analysis) to achieve visual detection. As illustrated in Fig. 2C, the green color of the reaction solution was gradually intensified with elevated concentration of Hg2+ from 0 to 5000 pM. Also, 500 pM (tube c) Hg2+ can be easily identified by the naked eye according to the distinct color difference between the sample and the blank test.
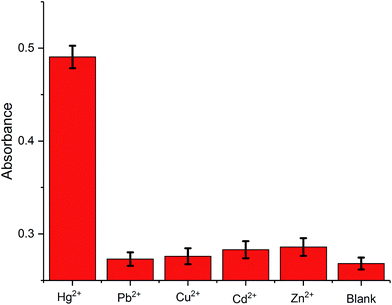
The selectivity of the proposed method is examined by monitoring the colorimetric signal of the solution with the presence of Hg2+ against other metal ions, Pb2+, Cu2+, Cd2+, and Zn2+. As shown in Fig. 3, the presence of the control molecules (1000 pM) causes insignificant colorimetric signal change of the solutions while the addition of the target Hg2+ (1000 pM) results in a high colorimetric signal of the probe solution, revealing that the amplification method is highly selective. Such high selectivity can be related to the highly specific binding capability of the T–Hg2+–T. In other words, only the presence of Hg2+ can trigger amplification cycles to achieve highly visual detection of target.
The real applicability evaluation
It is critically important to evaluate the real applicability of the amplification method by challenging this strategy in various media. Given that the strategy is resistant to other ions influence, we challenged the assay by analyzing samples of complicated matrix to evaluate the applicability of the strategy to river water. Four concentration of Hg2+ (200 pM, 500 pM, 1000 pM, 3000 pM) were spiked into river water. Table 2 is shows the experimental results obtained in Hg2+-spiked river water samples. Hg2+ concentration recoveries of 98.5–99.5% were achieved. These results showed that the interference of river water could be overcome. It means that, our proposed strategy could potentially be applied to realistic river water samples.| Samples | Hg2+ added (pM) | Found (pM) | Recovery (%) |
|---|---|---|---|
| 1 | 200 | 197.6 | 98.8 ± 2.6 |
| 2 | 500 | 492.3 | 98.5 ± 2.3 |
| 3 | 1000 | 986.7 | 98.7 ± 3.2 |
| 4 | 3000 | 2983.9 | 99.5 ± 1.8 |
Conclusions
In summary, we have developed a novel highly sensitive method to quantify Hg2+ as low as 66 pM by integrating a recycling cycles and demonstrated its feasibility in the application of realistic detection. We suggest that this assay offers two advantages. First, the assay does not involve any chemical modification of DNA, which makes it simple, low-cost and makes it a label-free strategy. Second, the method does not require troublesome separation procedures. We believe that, this method has the potential to be used as a major tool for ultrasensitive quantitative analysis of Hg2+ or other heavy metal ions in river water.Conflicts of interest
There are no conflicts to declare.Acknowledgements
We acknowledge financial support by the Social Development Foundation of Jiangsu (grant No. BE2013614)Notes and references
- J. Huang, X. Gao, J. Jia, J.-K. Kim and Z. Li, Anal. Chem., 2014, 86, 3209–3215 CrossRef CAS PubMed.
- X. Liu, Y. Tang, L. Wang, J. Zhang, S. Song, C. Fan and S. Wang, Adv. Mater., 2007, 19, 1662 CrossRef.
- S. He, D. Li, C. Zhu, S. Song, L. Wang, Y. Long and C. Fan, Chem. Commun., 2008, 4885–4887, 10.1039/b811528a.
- S.-J. Liu, H.-G. Nie, J.-H. Jiang, G.-L. Shen and R.-Q. Yu, Anal. Chem., 2009, 81, 5724–5730 CrossRef CAS PubMed.
- Z. Zhu, Y. Su, J. Li, D. Li, J. Zhang, S. Song, Y. Zhao, G. Li and C. Fan, Anal. Chem., 2009, 81, 7660–7666 CrossRef CAS PubMed.
- X. Liu, A. Gao, T. Li, P. Zhou, Y. Wang, Q. Yang, L. Wang and C. Fan, in 2010 Ieee Sensors, Ieee, 2010, pp. 1971–1974, DOI:10.1109/icsens.2010.5689894.
- Y. Helwa, N. Dave, R. Froidevaux, A. Samadi and J. Liu, ACS Appl. Mater. Interfaces, 2012, 4, 2228–2233 CAS.
- M. Stobiecka, A. A. Molinero, A. Chałupa and M. Hepel, Anal. Chem., 2012, 84, 4970–4978 CrossRef CAS PubMed.
- J. Ge, L.-L. Zhang, S.-J. Liu, R.-Q. Yu and X. Chu, Anal. Chem., 2014, 86, 1808–1815 CrossRef CAS PubMed.
- K. Brückner, K. Schwarz, S. Beck and M. W. Linscheid, Anal. Chem., 2013, 86, 585–591 CrossRef PubMed.
- K. Zhang, K. Wang, X. Zhu, J. Zhang, L. Xu, B. Huang and M. Xie, Chem. Commun., 2014, 50, 180–182 RSC.
- K. Wang, K. Zhang, Z. Lv, X. Zhu, L. Zhu and F. Zhou, Biosens. Bioelectron., 2014, 57, 91–95 CrossRef CAS PubMed.
- S. Bi, L. Li and Y. Cui, Chem. Commun., 2012, 48, 1018–1020 RSC.
- F. Xuan, X. Luo and I. M. Hsing, Anal. Chem., 2013, 85, 4586–4593 CrossRef CAS PubMed.
- F. Xuan, X. Luo and I. M. Hsing, Anal. Chem., 2012, 84, 5216–5220 CrossRef CAS PubMed.
- Y. Huang, S. Zhao, Z.-F. Chen, M. Shi, J. Chen and H. Liang, Chem. Commun., 2012, 48, 11877–11879 RSC.
- P. Hu, C. Zhu, L. Jin and S. Dong, Biosens. Bioelectron., 2012, 34, 83–87 CrossRef CAS PubMed.
- Y. Zhang, H. Zhang and N. Hu, Biosens. Bioelectron., 2008, 23, 1077–1082 CrossRef CAS PubMed.
- X. Zuo, F. Xia, Y. Xiao and K. W. Plaxco, J. Am. Chem. Soc., 2010, 132, 1816–1818 CrossRef CAS PubMed.
- S. Bi, X. Jia, J. Ye and Y. Dong, Biosens. Bioelectron., 2015, 71, 427–433 CrossRef CAS PubMed.
- X. Liu, R. Freeman and I. Willner, Chem.–Eur. J., 2012, 18, 2207–2211 CrossRef CAS PubMed.
- S. Bi, B. Luo, J. Ye and Z. Wang, Biosens. Bioelectron., 2014, 62, 208–213 CrossRef CAS PubMed.
- N. Lu, C. Shao and Z. Deng, Analyst, 2009, 134, 1822–1825 RSC.
| This journal is © The Royal Society of Chemistry 2017 |


