DOI:
10.1039/C7RA09102H
(Paper)
RSC Adv., 2017,
7, 51162-51174
Mitochondrial and nuclear DNA dual damage induced by 2-(2′-quinolyl)benzimidazole copper complexes with potential anticancer activity†
Received
17th August 2017
, Accepted 20th October 2017
First published on 3rd November 2017
Abstract
Two copper complexes, [Cu(qbm)Cl2]2 (1) and [Cu(qbm)Br(PPh3)] (2) (where qbm = 2-(2′-quinolyl)benzimidazole), have been prepared and characterized. The interactions of both complexes with calf thymus DNA (CT-DNA) were detected by absorbance and emission spectroscopy methods; the results showed that both complexes were bound to CT-DNA via an intercalative mode. In addition, the two complexes significantly exhibited the free radicals dependence of DNA cleavage activity. MTT assays revealed that complex 2 showed good cell proliferation inhibitory activity against four different human cancer cell lines (SMMC7721, BGC823, HCT116 and HT29), particularly with HCT116 cells. Furthermore, morphological changes and flow cytometry analyses indicated that complex 2 can induce HCT116 cell death by apoptosis. These findings should promote the development of metal-based complexes for use as novel chemotherapeutic agents.
1. Introduction
Cisplatin and related platinum-based complexes have been found to be highly effective anticancer drugs and have been successfully used in the clinic; however, their clinical applications are limited owing to severe side effects and acquired resistance.1 To overcome these drawbacks, numerous metal-based complexes with high efficiency and low toxicity have been considered as potential candidates for use as novel chemotherapeutic agents.2–5
Recently, studies of the functional diversity of endogenous metal ions in organisms have provided inspiration for the development of non-platinum chemotherapeutic agents.6–9 The endogenous metal ions, copper ion plays an important role in physiological metabolism, such as participating in the construction of the functional domains of biomacromolecules and regenerating blood vessels; thus, the development of copper complexes as potential chemotherapeutic agents is desirable.10–12 In addition, copper complexes have been widely studied for their redox properties as potential antineoplastic agents, and their pharmacological properties are different from those of cisplatin.13–16 Cisplatin is used as a classical chemotherapeutic drug; it mainly induces nuclear damage as its mode of cancer treatment. However, the cell death-induced interaction pattern of cisplatin not only acts on tumor cells, but also causes serious damage to normal cells; thus, the use of cisplatin in the clinic causes many side effects. Therefore, the antitumor mechanism of novel chemotherapeutic agents should be improved, and the introduction of synergistic damage of active groups should be considered. Triphenylphosphine (PPh3) has been widely studied as a functional modifying group in the synthesis of complexes; it has very good potential for antitumor applications.17,18 Guo's group recently reported a mitochondrion-targeting complex, [Cu(ttpy-PPh3)Br2]Br. The PPh3 group was successfully introduced in the synthesis of the complex for its mitochondrion-targeting ability and lipophilic character; the complex exhibited potent anticancer activity, particularly against cisplatin-resistant tumor cells, through multiple mechanisms.19 Furthermore, similar copper complexes, [CuX(eitotH2)(PPh3)2] (X = Cl, Br, I), have been prepared and studied. The newly synthesized complexes showed remarkable cytotoxicity against several cancer cell lines by typical mitochondrial and nuclear DNA dual damage pathways.20 Additionally, the organic groups of benzimidazolyl and quinoline, which have numerous biological properties, including antibacterial, antiviral, anticancer and antifungal activities, are used to synthesize novel chemotherapeutic agents.21,22 In recent years, the in vitro anticancer mechanism of the combination of an N-heterocyclic organic system and the PPh3 group has been widely studied.23–25
Actually, the molecular mechanisms of cancer cell death induced by metal-based complexes are still unclear, and the in vitro anticancer mechanisms of endogenous copper complexes with benzimidazole–quinoline ligand have been rarely reported. Hence, two copper complexes, [Cu(qbm)Cl2]2 (1) and [Cu(qbm)Br(PPh3)] (2), with a benzimidazole–quinolinyl-based ligand have been prepared. The single crystal structures and in vitro biological properties of the complexes have been investigated. These results obtained here will contribute to the development of novel chemotherapeutic agents.
2. Experimental
2.1 Materials and methods
The reagents and chemicals were purchased from commercial sources and used without further purification. Ethidium bromide (EB), CT-DNA, and 3-(4,5-dimathylthiazol-2-yl)-2,5-diphenyltetrazolium bromide (MTT) were obtained from Sigma, and pBR322 was purchased from TaKaRa Biotechnology. The ROS assay kit, cellular mitochondrion isolation kit, 5,5′,6,6′-tetrachloro-1,1′,3,3′-tetratheyl-benzamidazolo-carbocyanin iodide (JC-1) kit, and N-acetylcysteine (NAC) were obtained from the Beyotime Institute of Biotechnology. The BD Cycletest Plus DNA reagent kit and annexin V-FITC/PI apoptosis detection kit were purchased from BD Biosciences. Double-distilled water was used to prepare all buffer solutions for the biological experiments.
Elemental analyses (C, H and N) were performed on a Flash EA 1112 elemental analyzer (Thermo Fisher Scientific, Waltham, MA, USA). Infrared spectra were measured on a PerkinElmer Fourier transform-IR spectrometer (Perkin Elmer, Waltham, MA, USA) in the region of 400 to 4000 cm−1 with KBr pellets. Electronic absorption spectra were measured on a Specord 200 UV-visible spectrophotometer. The circular dichroism (CD) spectra were obtained using an MOS-500 spectrophotometer (Bio-Logic, France) with a 1 cm-path quartz cell. DNA cleavage studies were performed using a G: BOX F3 gel imaging system (Syngene, UK). The MTT assay was performed using a Tecan microplate reader (Tecan, Morrisville, NC, USA). Inductively coupled plasma mass spectrometry (ICP-MS) measurements were recorded by a Nex ION 300X instrument (Perkin Elmer). Morphological changes were observed on Carl Zeiss (Carl Zeiss, Jena, Germany) and Nikon (Nikon, Yokohama, Japan) microscopic imaging systems. Double-distilled water was obtained from a Milli-Q® water purification system (Millipore). The flow cytometry data was measured on a Guava easyCyte 6-2L flow cytometer (Millipore, Billerica, MA, USA).
2.2 Synthesis of ligand and corresponding complexes
The outline of the synthetic route of the ligand of 2-(2′-quinolyl)benzimidazole (qbm) and its corresponding copper complexes is presented in Scheme 1. The qbm ligand was synthesized according to previously reported methods with some modifications.26
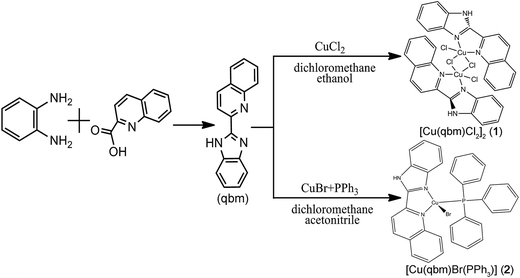 |
| | Scheme 1 Synthesis of the ligand and its corresponding complexes [Cu(qbm)Cl2]2 (1) and [Cu(qbm)Br(PPh3)] (2). | |
2.2.1 Synthesis of [Cu(qbm)Cl2]2 (1). A mixture solution (6 mL) containing CuCl2 (0.03 mmol, 0.0051 g), qbm (0.02 mmol, 0.0049 g), ethanol (4 mL) and dichloromethane (2 mL) was stirred at room temperature to obtain a brown solution. After evaporation to dryness in a glass bottle, light brown crystals were obtained. Yield: 62% (based on Cu). Anal. calc. for C32H22Cl4Cu2N6 (%): C, 50.61; H, 2.92; N, 11.07. Found: C, 50.79; H, 3.03; N, 11.09. IR (KBr/pellet, cm−1): 3432 (w), 3056 (w), 1595 (s), 1504 (m), 1476 (s), 1426 (s), 1380 (m), 1337 (m), 1140 (w), 1106 (w), 957 (w), 827 (m), 762 (s), 484 (w).
2.2.2 Synthesis of [Cu(qbm)Br(PPh3)] (2). Complex 2 was prepared according to the synthetic procedure for 1 using CuBr (0.03 mmol, 0.0043 g), qbm (0.02 mmol, 0.0049 g), PPh3 (0.02 mmol, 0.0052 g), acetonitrile (4 mL) and dichloromethane (2 mL) to afford an orange solid. Yield: 57% (based on Cu). Anal. calc. for C34H26BrCuN3P (%): C, 62.73; H, 4.03; N, 6.45. Found: C, 62.97; H, 4.05; N, 6.43. IR (KBr/pellet, cm−1): 3051 (m), 1596 (w), 1500 (w), 1480 (w), 1435 (s), 1417 (w), 1096 (w), 830 (w), 743 (s), 694 (s), 525 (s), 507 (s), 489 (s).
2.3 X-ray crystallography
A suitably sized crystal was loaded on a glass fiber. X-ray diffraction data were collected on a Super Nova system with a diffractometer at 293(2) K equipped with mirror monochromatic Cu-Kα radiation (λ = 1.54184 Å). The structures were solved by direct methods within the SHELXS program of the SHELXTL package,27,28 and both structures were refined by the full-matrix least-squares technique on F2 using SHELXL.29 Non-hydrogen atoms were subjected to anisotropic thermal parameters. Moreover, all hydrogen atoms attached to carbon or nitrogen atoms were obtained theoretically. The crystallographic data and single crystal structure parameters are listed in Table 1, and the selected bond distances and angles are exhibited in Table 2.
Table 1 Crystallographic data and structural refinement for complexes 1 and 2
| |
Complex 1 |
Complex 2 |
| Formula |
C32H22Cl4Cu2N6 |
C34H26BrCuN3P |
| Formula weight |
759.43 |
651.00 |
| Temperature/K |
293 |
293 |
| λ (Cu, Mo Kα), Å |
1.54184 |
1.54184 |
| Crystal system |
Monoclinic |
Monoclinic |
| Space group |
P2(1)/c |
P2(1)/n |
| a (Å) |
11.2017(3) |
9.81614(17) |
| b (Å) |
17.1297(4) |
15.9919(3) |
| c (Å) |
9.4880(2) |
18.4289(3) |
| α (deg) |
90.00 |
90.00 |
| β (deg) |
112.712(3) |
96.1399(17) |
| γ (deg) |
90.00 |
90.00 |
| Volume (Å3), Z |
1679.41(8), 2 |
2876.36(9), 4 |
| Calculated density (g cm−3) |
1.502 |
1.503 |
| F(000) |
764.0 |
1320.0 |
| θ range for data collection (deg) |
5 to 76.47 |
3.67 to 76.49 |
| Limiting indices |
−13 ≤ h ≤ 11 |
−10 ≤ h ≤ 12 |
| −21 ≤ k ≤ 21 |
−19 ≤ k ≤ 19 |
| −8 ≤ l ≤ 11 |
−22 ≤ l ≤ 18 |
| Reflections collected |
7107 |
13![[thin space (1/6-em)]](https://www.rsc.org/images/entities/char_2009.gif) 100 100 |
| Independent reflections |
3452 [R(int) = 0.0337] |
5915 [R(int) = 0.0160] |
| Goodness-of-fit on F2 |
1.100 |
1.056 |
| Final R indexes [I ≧ 2σ(I)] |
R1 = 0.0665, wR2 = 0.2158 |
R1 = 0.0356, wR2 = 0.0956 |
| R Indexes [all data] |
R1 = 0.0715, wR2 = 0.2250 |
R1 = 0.0425, wR2 = 0.1009 |
| Largest diff. Peak and hole (e Å−3) |
1.92/−0.57 |
0.34/−0.55 |
Table 2 Selected bond lengths (Å) and angles (°) for complexes 1 and 2a
| Symmetry transformation used to generate equivalent atoms: 12 − X, 1 − Y, −Z for 1 and X, Y, Z for 2. |
| Complex 1 |
| Cu(1)–N(1) |
2.024(3) |
Cu(1)–Cl(2) |
2.3225(10) |
| Cu(1)–N(2) |
2.048(3) |
Cu(1)–Cl(1a) |
2.2570(9) |
| Cu(1)–Cl(1) |
2.5191(10) |
|
|
| Cl(1a)–Cu(1)–Cl(1) |
85.79(3) |
N(2)–Cu(1)–Cl(2) |
122.18(10) |
| Cl(1a)–Cu(1)–Cl(2) |
94.78(4) |
N(1)–Cu(1)–Cl(1) |
87.11(9) |
| Cl(2)–Cu(1)–Cl(1) |
127.08(4) |
N(1)–Cu(1)–Cl(1a) |
171.30(9) |
| N(2)–Cu(1)–Cl(1a) |
96.63(9) |
N(1)–Cu(1)–Cl(2) |
93.51(9) |
| N(2)–Cu(1)–Cl(1) |
110.20(9) |
N(1)–Cu(1)–N(2) |
81.11(12) |
![[thin space (1/6-em)]](https://www.rsc.org/images/entities/char_2009.gif) |
| Complex 2 |
| Cu(1)–N(1) |
2.158(2) |
Cu(1)–P(1) |
2.1996(6) |
| Cu(1)–N(2) |
2.077(2) |
Cu(1)–Br(1) |
2.4759(5) |
| P(1)–Cu(1)–Br(1) |
111.91(2) |
N(2)–Cu(1)–N(1) |
78.64(8) |
| N(2)–Cu(1)–Br(1) |
108.00(6) |
N(1)–Cu(1)–Br(1) |
99.51(5) |
| N(2)–Cu(1)–P(1) |
125.40(6) |
N(1)–Cu(1)–P(1) |
127.44(6) |
2.4 DNA binding experiments
Electronic absorption spectra were recorded at 260 nm to determine the concentration of CT-DNA with a molar absorption coefficient of 6600 M−1 cm−1. Moreover, the DNA solution was sufficiently free of protein, and the ratio of UV absorbance at 260 and 280 nm (A260/A280) of the CT-DNA solution was 1.8–1.9.30,31 The electronic absorbance spectrum was recorded by increasing the amount of CT-DNA (to a final concentration of 40 μM) in the complex solution (40 μM). An equal concentration of the DNA solution was used as the reference solution to eliminate the absorbance of DNA itself. Fluorescence quenching tests were performed by adding different concentrations of the complexes (to a final concentration of 90 μM) to a mixture solution containing EB (10 μM) and CT-DNA (100 μM). The quenching spectrum was measured with λex = 490 nm and λem ranging from 510 to 850 nm. The CD spectra of CT-DNA and the complexes were measured using an MOS-500 spectrophotometer with a wavelength range from 220 to 320 nm. Moreover, each sample of CT-DNA (50 μM) in the absence and presence of complexes 1 and 2 (10 M) was incubated at 37 °C for 10 min.
2.5 DNA cleavage experiments
Herein, 10 μL of a mixture solution containing supercoiled plasmid pBR322 DNA, complex 1 or 2, and the absence/presence of activation factors (ascorbic or H2O2) with 50 mM Tris–HCl/50 mM NaCl buffer (pH 7.4) was incubated at 37 °C for 3 h. Then, each sample was loaded onto an agarose gel before adding 2 μL 6× loading buffer (30 mM EDTA, 36% (v/v) glycerol, 0.05% (w/v) xylene cyanol FF, 0.05% (w/v) bromophenol blue). All tests were performed at 85 V for 1.5 h in Tris-acetate-EDTA (TAE) buffer (40 mM Tris, 20 mM acetic acid, and 1 mM EDTA, pH 8.0). Finally, the EB-stained DNA fragments were monitored by a gel imaging system. The cleavage mechanisms of complexes 1 and 2 was investigated for each corresponding sample with hydroxyl radical scavenger (dimethyl sulfoxide, DMSO), singlet oxygen scavenger (sodium azide, NaN3), superoxide anion radical scavenger (superoxide dismutase enzyme, SOD) and metal ion chelating agent (ethylenediaminetetraacetic acid, EDTA).
2.6 Cell culture
Human liver carcinoma cell line (SMMC7721), human gastric cancer cell line (BGC823), human colon carcinoma cell line (HCT116), and human colorectal carcinoma cell line (HT29) (cancer cell lines) as well as a normal human liver cell line (LO-2) were purchased from Keygen (Keygen Biotech. Co. Ltd., Nanjing, China) and cultured at 37 °C with 5% CO2. Additionally, SMMC7721 and HT29 cells were incubated with Roswell Park Memorial Institute (RPMI), and HCT116, BGC823 and LO-2 cells were incubated with Dulbecco's modified Eagle's medium (DMEM) cell culture media. The cell culture medium solution was supplemented with a volume percentage of 10% FBS (fetal bovine serum) and penicillin–streptomycin solution (100 units per mL penicillin and 100 μg mL−1 streptomycin).
2.7 MTT assay
Cell viability was measured by a standard MTT assay method.32 The complexes and ligand were dissolved in DMSO and further diluted with cell culture medium to the required concentrations. The cells were cultured in 96-well plates (8 × 10³ cells per well) and incubated at 37 °C for 24 h. Then, 20 μL MTT (5 mg mL−1) solution was added to each well after incubation with the complexes at 37 °C for 48 h. After incubation for 4 h, 150 μL of DMSO was added to each well to dissolve the formazan crystals. The absorbance data were detected by a microplate reader at 492 nm. The IC50 values were obtained from the concentration of the complex that induced 50% inhibition of cell growth. Additionally, each test was replicated three times independently.
2.8 Cellular uptake
HCT116 cells were cultured on cell culture plates and treated with 1 and 2 (10 μM) for 12 h. 1 × 10⁶ cells were harvested; the cytoplasm, mitochondria and nucleus were then separated using a cell mitochondria isolation kit. The obtained mitochondria and nucleus samples were mineralized with concentrated HNO3 (100 μL) at 95 °C for 1 h. A total volume of 50 μL H2O2 (30%) was added to each sample, and the samples were incubated at 95 °C for another 1 h. 100 μL concentrated HCl was added to the above solution, and incubation was continued until the total volume was less than 50 μL. The sample of cytoplasm was subjected to ultrasonic crushing treatment. Each sample was diluted to 4 mL with double-distilled water, and the copper ion contents were measured by inductively coupled plasma mass spectrometry (ICP-MS).
2.9 Reactive oxygen species (ROS) level studies
ROS in HCT116 cells was detected by fluorescence microscopy and flow cytometry methods with an ROS assay kit. The cells (2 × 10⁵ cells per well) were cultured in 6-well plates and treated with 2 at different concentrations (0, 5 and 10 μM) for 24 h. The cells were harvested by trypsinization and incubated with fluorescent dye at 37 °C for 20 min in the dark. The data were collected by Zeiss fluorescence microscopy or flow cytometry after the cells were washed with DMEM medium without 10% FBS three times to completely remove the unbound DCFH-DA. Additionally, the 2-induced ROS generation in HCT116 cells was investigated using NAC (10 mM) as the intercellular ROS scavenger; the ROS generation was measured with the MTT assay as described above.
2.10 Single cell gel electrophoresis
The nuclear DNA damage was determined by single cell gel electrophoresis (comet assay).33 The cells were cultured in 6-well plates and treated with 2 at different concentrations (0, 5 and 10 μM) at 37 °C for 24 h. The cells were harvested by trypsinization and resuspended in PBS. The cell-containing layer was prepared with 0.5% low melting point agarose in PBS as the second layer to deposit on the first layer, which consisted of 1% normal melting point agarose. A third layer, which consisted of low melting point agarose, was deposited on the surface of the cell layer to protect it. After these treatments, the slides were immersed in lysis solution (2.5 M NaCl, 100 mM EDTA, 10 mM Tris, 1% Triton X-100 and 10% DMSO, pH 10) at 4 °C for 3 h. After lysis, all slides were transferred from the lysis buffer to an alkaline electrophoresis buffer (0.3 M NaOH, 1 mM EDTA, pH 13) at 4 °C for 20 min to unwind the DNA. The electrophoresis was performed at 25 V for 20 min; then, the slides were washed three times in neutralization buffer (0.4 M Tris, pH 7.5). Nuclear DNA fragments were stained with EB (5 mg mL−1), and the data were obtained using a Zeiss fluorescence microscope.
2.11 Cell cycle analysis
HCT116 cells were treated with 2 at different concentrations (0, 5 and 10 μM) for 24 h and harvested by trypsinization. The cells were treated using a BD Cycletest Plus DNA reagent kit. The cell cycle distribution was determined by a flow cytometer, and 10![[thin space (1/6-em)]](https://www.rsc.org/images/entities/char_2009.gif) 000 events per sample were acquired. The percentages of cells in the different cell cycle phases were analyzed by ModFit LT software.
000 events per sample were acquired. The percentages of cells in the different cell cycle phases were analyzed by ModFit LT software.
2.12 Apoptosis assay by AO/EB and Hoechst 33258 staining
HCT116 cells were cultured in 6-well plates and treated with 2 (0, 5 and 10 μM) for 24 h. The culture medium was removed, and each well was washed with ice-cold PBS three times. 1 mL immobilized solution (acetic acid![[thin space (1/6-em)]](https://www.rsc.org/images/entities/char_2009.gif) :
:![[thin space (1/6-em)]](https://www.rsc.org/images/entities/char_2009.gif) ethanol = 1
ethanol = 1![[thin space (1/6-em)]](https://www.rsc.org/images/entities/char_2009.gif) :
:![[thin space (1/6-em)]](https://www.rsc.org/images/entities/char_2009.gif) 3) was added to each well, followed by incubation at room temperature for 10 min. The cells were stained with 1 mL Hoechst 33258 fluorescent dye (5 μg mL−1) for 10 min in the dark and then washed twice with ice-cold PBS. The optical imaging results for the cells were obtained using the Zeiss fluorescence microscope. In addition, for the AO/EB dual staining assay, the cells were immediately stained with AO/EB dyeing solution (100 μg mL−1 AO, 100 μg mL−1 EB) at room temperature in the dark. The cells were identified using a Nikon fluorescence microscope.
3) was added to each well, followed by incubation at room temperature for 10 min. The cells were stained with 1 mL Hoechst 33258 fluorescent dye (5 μg mL−1) for 10 min in the dark and then washed twice with ice-cold PBS. The optical imaging results for the cells were obtained using the Zeiss fluorescence microscope. In addition, for the AO/EB dual staining assay, the cells were immediately stained with AO/EB dyeing solution (100 μg mL−1 AO, 100 μg mL−1 EB) at room temperature in the dark. The cells were identified using a Nikon fluorescence microscope.
2.13 Annexin V-FITC/PI dual staining analysis
HCT116 cells were treated with 2 at different concentrations (0, 5 and 10 μM) for 24 h and harvested by trypsinization. The cells were resuspended in 1× binding buffer and then incubated with the fluorescent dye Annexin V-FITC (5 μL) at 37 °C for 30 min in the dark. The dyeing solution of PI (5 μL) was added to each sample before detection by flow cytometry. The samples were placed in an ice bath in the dark, and 10![[thin space (1/6-em)]](https://www.rsc.org/images/entities/char_2009.gif) 000 events per sample were acquired.
000 events per sample were acquired.
2.14 Detected of mitochondrial membrane potential (ΔΨm)
HCT116 cells were seeded in 6-well plates and treated with 2 at different concentrations (0, 5 and 10 μM) for 24 h. The cells were harvested by trypsinization and then resuspended in JC-1 dyeing solution at 37 °C for 20 min in the dark. The cells were washed three times with DMEM medium without 10% FBS and were measured by flow cytometry. The obtained data were analyzed using FlowJo software.
3. Results and discussion
3.1 Crystal structures of the complexes
The structures of [Cu(qbm)Cl2]2 (1) and [Cu(qbm)Br(PPh3)] (2) were established by single-crystal X-ray diffraction. Sketched maps of 1 and 2 are presented in Scheme 1 and ORTEP representation structures are shown in Fig. 1.
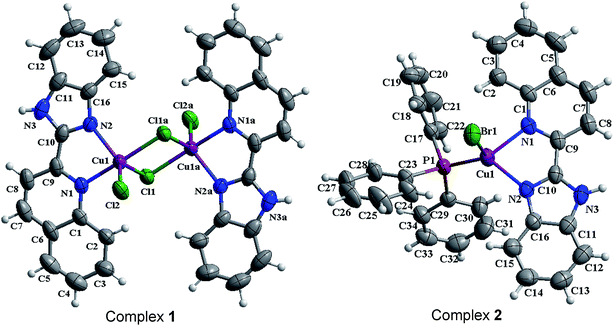 |
| | Fig. 1 ORTEP representations of 1 [Cu(qbm)Cl2]2 and 2 [Cu(qbm)Br(PPh3)] showing the atom labeling scheme and thermal ellipsoids drawn at the 50% probability level. | |
3.1.1 Crystal structure of [Cu(qbm)Cl2]2 (1). Complex 1 is a centrosymmetric binuclear structure with two Cu(II) ions (Cu1 and Cu1a), two qbm ligands and four chloride anions (Fig. 1a). The Cu(II) is coordinated by two nitrogen atoms from one qbm ligand (N1 and N2) and two chloride anions (Cl1 and Cl2), giving a distorted square pyramidal geometry. The bond distances of Cu1–Cl1a and Cu1–Cl2 are 2.2570(9) and 2.3225(10) Å, respectively, which are both shorter than the Cu1–Cl1 bond (2.5191(10) Å). This phenomenon can be attributed to Jahn–Teller distortion. Additionally, the dihedral angle between the benzimidazole ring and the quinoline ring is 4.1(2)°. The selected bond distances and bond angles are highly consistent with those of previously reported copper complexes.34,35 The 3D supermolecular architecture of complex 1 is stabilized by face-to-face π–π stacking interactions between the benzene, imidazole and pyridine rings (Fig. S1†). The distances from centroid to centroid are 3.548(3) and 3.716(3) Å between the imidazole and pyridine rings and the pyridine and benzene rings, respectively. Additionally, the structure is stabilized by hydrogen bond interactions, including C15–H15⋯Cl1 and N3–H3⋯Cl2, which have bond lengths of 3.510(5) and 3.186(4) Å, respectively. Unfortunately, the nature of the disordered solvent present in the crystal is not always known.36
3.1.2 Crystal structure of [Cu(qbm)Br(PPh3)] (2). The ORTEP structure of complex 2 is shown in Fig. 1b. In the crystal structure, the tetracoordinated Cu(I) center shows a distorted tetrahedral geometry; it is surrounded by two nitrogen atoms from the qbm ligand, one chloride anion and one phosphorus atom from the PPh3 ligand. The dihedral angle between the benzimidazole and quinoline rings is 3.4(12)°. The bond lengths and bond angles are within the normal range, and they are very similar to those of previously reported complexes.37 Additionally, the 3D packing structure of 2 is extended to π–π interactions as well as hydrogen bonds (Fig. S2†). For the complex 2, the π–π interactions between the imidazole and pyridine rings occur at a distance of 3.7524(16) Å, the pyridine and pyridine rings at 3.8866(16) Å, the pyridine and benzene (quinoline) rings at 3.7455(18) Å, and the pyridine and benzene (benzimidazolyl) rings at 3.6809(17) Å. Upon the basis of π–π interactions and hydrogen bonds with a distance of 3.298(2) Å for N3–H3⋯Br1, the complex finally extends into a 3D supermolecular architecture.
3.2 DNA binding properties
3.2.1 Electronic absorption titration. The electronic absorption spectra of 1 and 2 interacting with CT-DNA are shown in Fig. 2. Upon adding CT-DNA to the complex solutions, the absorbance bands exhibited hypochromism (1, 3.12%; 2, 7.63%) and red-shifts (1, 5 nm; 2, 4 nm). The changes in these absorption bands are due to the π–π* transitions of the interactions between the main and guest molecules, which are attributed to the strong stacking interactions between aromatic systems and DNA base pairs.38,39 These results indicate that 1 and 2 probably bind to CT-DNA via an intercalative mode. In order to quantitate the binding affinity between the complexes and CT-DNA, the binding constant Kb was calculated using the following equation:40
| [DNA]/(εa − εf) = [DNA]/(εb − εf) + 1/Kb(εb − εf) |
where [DNA] is the concentration of DNA in the base pairs, and the apparent absorption coefficients εa, εf and εb correspond to the observed extinction coefficient, the extinction coefficient of the free complex and the extinction coefficient of the complex when fully bound to DNA, respectively. The plot of [DNA]/(εa − εf) versus [DNA] gives a slope and an intercept which are equal to 1/(εb − εf) and 1/Kb(εb − εf), respectively. Kb is the ratio of the slope to the intercept. Thus, the values of Kb of 1 and 2 were 1.84 × 10⁴ M−1 and 7.80 × 10³ M−1, respectively. Therefore, the binding ability of 1 with DNA is greater than that of 2. These Kb values are very similar to those of previously reported complexes, which indicates that the complexes probably interact with CT-DNA via an intercalative binding mode.41–43 The binding mode between complex and CT-DNA was further confirmed by competitive binding experiments in which the complexes were added to an EB-DNA binding system.
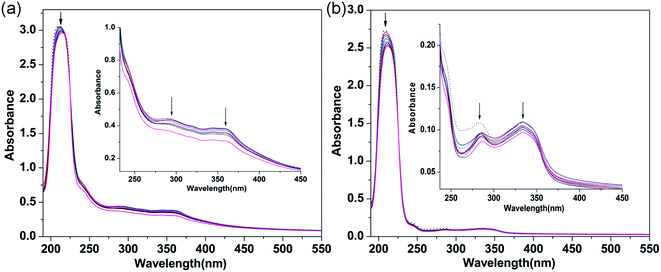 |
| | Fig. 2 Absorption spectra of 1 (a) and 2 (b) ([complex] = 40 μM) in the absence (dashed line) and presence (solid lines) of increasing amounts of CT-DNA ([DNA] = 0 to 40 μM). The arrow shows the absorbance changes with increasing CT-DNA concentration. Inset: partial wavelengths showing changes in the absorption bands. | |
3.2.2 Fluorescence quenching titration. EB is a sensitive DNA-binding fluorescent probe that binds strongly to DNA base pairs to emit intense fluorescence.44,45 As shown in Fig. 3, significant decreases in the emission bands were observed upon adding the complexes to the EB-DNA binding system. This behavior indicated that the interaction of the complexes and DNA base pairs caused some EB molecules to be released into solution. Therefore, the complexes probably bind to CT-DNA via an intercalative binding mode.46 The fluorescence quenching behaviors of complexes replacing EB in a DNA-EB system can be analyzed through the Stern–Volmer equation:47
where I0 and I are the fluorescence intensities of EB-DNA in the absence and presence of the complex, respectively, [Q] is the concentration of quencher, and Kq is the linear Stern–Volmer quenching constant. The Kq values of 1 and 2 were 1.14 × 10⁴ M−1 (R = 0.995) and 3.58 × 10³ M−1, respectively. In addition, the apparent binding constant (Kapp) was obtained using the equation KEB [EB] = Kapp [complex], where [EB] = 10 μM, KEB = 1 × 10⁷ M−1,48 and the complex concentration was presented as the value at 50% quenching of the fluorescence intensity of the EB-DNA system. The Kapp values of 1 and 2 were found to be 1.67 × 10⁶ M−1 and 6.72 × 10⁵ M−1, respectively. The Kapp values suggest that 1 and 2 bind to DNA base pairs by an intercalative binding mode; these values were higher than those of previously reported copper complexes for the same binding mode, with lower Kapp values of 4 × 10⁵ M−1, 5.03 × 10⁵ M−1 and 4.67 × 10⁵ M−1 for [Cu(tscpy)(MeOH)]Cl, [CuCl(mtscpy)] and [CuCl(ptscpy)], respectively.49 Moreover, the apparent binding constants of the complexes were similar to that of CTB ([Cu(ttpy-tpp)Br2]Br, ttpy-tpp = 4′-p-tolyl-(2,2′:6′,2′′-terpyridyl)triphenylphosphonium bromide), which strongly interacts with DNA via an intercalative mode with a Kapp value of 4.05 × 10⁶ M−1.19 The results revealed that complex 1 had stronger binding affinity with CT-DNA than 2, which is consistent with the above absorption titration studies.
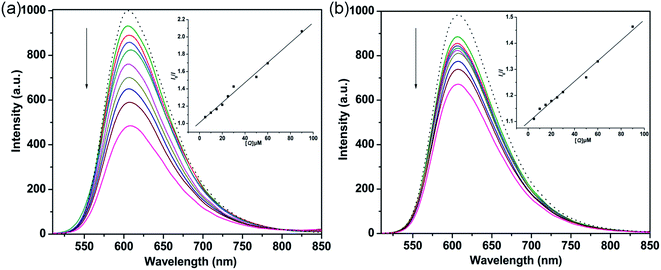 |
| | Fig. 3 Fluorescence quenching curves of EB (10 μM) bound to DNA (100 μM) by 1 (a) and 2 (b) ([Q] = 0 to 90 μM). The arrow shows the intensity changes upon increasing complex concentration. Insets: Stern–Volmer quenching curves of the fluorescence titration of the complexes. | |
3.2.3 Circular dichroism spectra studies. CD spectroscopy is used to study the potential of a complex to change the conformation of DNA; it is a very powerful technique to detect conformational changes of the DNA double helix in solution. In the CD spectra, CT-DNA shows a positive peak at 275 nm and a negative peak at 247 nm, which are due to the base stacking and helical suprastructure of B-DNA, respectively.50 As shown in Fig. 4, with the concentration ratio [DNA]/[complex] of 5![[thin space (1/6-em)]](https://www.rsc.org/images/entities/char_2009.gif) :
:![[thin space (1/6-em)]](https://www.rsc.org/images/entities/char_2009.gif) 1, the presence of complexes 1 and 2 induced decreases in the intensities of both the positive and negative bands and the CD spectrum peaks underwent a slight red-shift; this indicates that the intercalation mode may be present between the complex and the DNA.51 Moreover, at the same treatment concentration, complex 1 exhibited larger spectral band changes than complex 2 in both the positive and negative absorption bands, which further suggests that the intercalation ability of complex 1 with CT-DNA is stronger than that of complex 2.52
1, the presence of complexes 1 and 2 induced decreases in the intensities of both the positive and negative bands and the CD spectrum peaks underwent a slight red-shift; this indicates that the intercalation mode may be present between the complex and the DNA.51 Moreover, at the same treatment concentration, complex 1 exhibited larger spectral band changes than complex 2 in both the positive and negative absorption bands, which further suggests that the intercalation ability of complex 1 with CT-DNA is stronger than that of complex 2.52
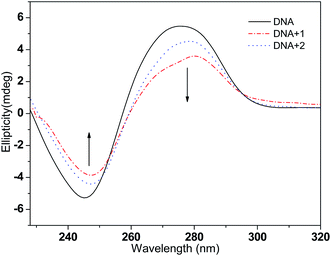 |
| | Fig. 4 CD spectra of CT-DNA (50 μM) in the absence and presence of complexes 1 and 2 (10 μM), respectively. | |
3.3 DNA cleavage properties
The chemical nuclease activity of the complexes was detected by the conversion of supercoiled form (Form I) to nicked form (Form II) and linear form (Form III). As shown in Fig. 5, the supercoiled DNA treated with 1 and 2 was gradually converted into nicked and linear forms. Additionally, copper is a crucial trace element in redox chemistry; it plays a major role in many physiological processes, such as functional modification of several biomacromolecules, respiration and DNA synthesis, and it induces production of reactive oxygen species (ROS).53,54 The ROS generated by the transfer of electrons between metal-based complexes and O2, including hydroxyl radical (˙OH), singlet oxygen (1O2), superoxide anion (O2−), and hydrogen peroxide (H2O2), is a major cause of oxidative DNA damage. The preliminary mechanisms of pBR322 DNA cleavage by 1 and 2 were studied by addition of a variety of radical scavengers, including DMSO, NaN3, SOD, and EDTA. As shown in Fig. 6, no obvious inhibitions were observed in the presence of SOD (lanes 4a and 4b). These results rule out the possibility of DNA cleavage by superoxide. The cleavage activities of 1 and 2 decreased in the presence of DMSO (lanes 2a and 2b) and NaN3 (lanes 3a and 3b). Thus, hydroxyl and singlet oxygen radicals may be involved in the DNA cleavage process. The metal chelating agent, EDTA, could efficiently inhibit DNA cleavage (lanes 5a and 5b), indicating that the copper complex is a key intermediate in the DNA damage. The active species of hydroxyl and singlet oxygen radicals may be involved in the DNA cleavage reaction; these can be generated from redox reactions between Cu(I) complex and Cu(II) complex. These pathways for the above experiments performed for 1 and 2 are similar to those of previously reported copper complexes.55,56 Cancer cells often have higher levels of cellular concentrations of ROS; these can be utilized in the intracellular production of copper-redox species to induce oxidative DNA damage and cell death.57,58
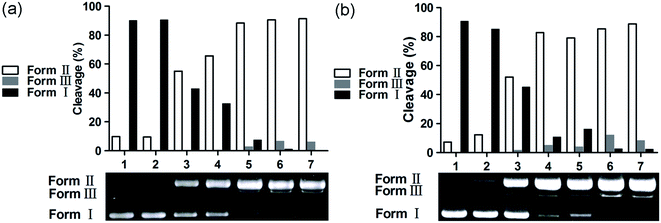 |
| | Fig. 5 Agarose gel electrophoresis patterns for the cleavage of pBR322 DNA by 1 (a) and 2 (b) at 37 °C after 3 h of incubation. (a) Lane 1, DNA control; lane 2, DNA + 1 (50 μM); lanes 3 to 7, DNA + Vc (1 mM) + 1 (10, 20, 30, 40 and 50 μM, respectively); (b) lane 1, DNA control; lane 2, DNA + 2 (50 μM), lanes 3 to 7, DNA + H2O2 (1 mM) + 2 (10, 20, 30, 40 and 50 μM, respectively). | |
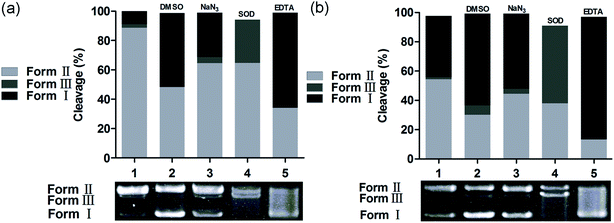 |
| | Fig. 6 Agarose gel electrophoresis patterns for the cleavage of pBR322 DNA by 1 (a) and 2 (b) in the presence of different typical reactive oxygen species scavengers at 37 °C after 3 h of incubation. (a) Lane 1, DNA + Vc (1 mM) + 1 (50 μM); lane 2, DNA + Vc (1 mM) + DMSO (1 mM) + 1 (50 μM); lane 3, DNA + Vc (1 mM) + NaN3 (1 mM) + 1 (50 μM); lane 4, DNA + Vc (1 mM) + SOD (30 units) + 1 (50 μM); lane 5, DNA + Vc (1 mM) + EDTA (1 mM) + 1 (50 μM); (b) lane 1, DNA + H2O2 (1 mM) + 2 (50 μM); lane 2, DNA + H2O2 (1 mM) + DMSO (1 mM) + 2 (50 μM); lane 3, DNA + H2O2 (1 mM) + NaN3 (1 mM) + 2 (50 μM); lane 4, DNA + H2O2 (1 mM) + SOD (30 units) + 2 (50 μM); lane 5, DNA + H2O2 (1 mM) + EDTA (1 mM) + 2 (50 μM). | |
3.4 MTT assay
The IC50 values of the complexes are listed in Table 3. 1 and 2 show high cytotoxicity, with IC50 values ranging from 4.25 ± 0.39 to 9.24 ± 0.16 μM against the above four tumor cell lines and two normal cell lines; they were found to show higher cytotoxicity than the ligand. Particularly, complex 2 shows the highest cytotoxicity, with an IC50 value of 4.25 ± 0.39 μM toward HCT116 cells and lower cytotoxicity to LO-2 cells, with an IC50 value of 12.76 ± 0.52 μM under the same conditions. Therefore, we selected 2 against the HCT116 cell line for further investigation of the copper-based anticancer mechanism.
Table 3 Cytotoxicities of the ligand and its copper complexes against four human tumor cell lines over 48 h
| Compound |
IC50 valuesa (μM) |
| SMMC7721 |
BGC823 |
HCT116 |
HT29 |
LO-2 |
| IC50 values are presented as the mean ± SD (standard error of the mean) from three independent experiments. |
| Complex 1 |
7.73 ± 0.20 |
5.47 ± 0.40 |
9.24 ± 0.16 |
6.41 ± 0.08 |
18.45 ± 0.29 |
| Complex 2 |
7.53 ± 0.23 |
7.59 ± 0.53 |
4.25 ± 0.39 |
9.01 ± 1.48 |
12.76 ± 0.52 |
| qbm |
>100 |
>100 |
76.33 ± 1.62 |
>100 |
78.19 ± 4.84 |
| Cisplatin |
6.67 ± 0.43 |
6.13 ± 0.48 |
33.10 ± 1.27 |
47.69 ± 6.08 |
25.56 ± 1.45 |
3.5 Cellular uptake studies
To investigate the effects of cellular uptake of metal-based antineoplastic agents on malignant proliferation, the cellular uptake and distribution of 1 and 2 within HCT116 cells were detected by ICP-MS (Fig. 7, Tables S1 and S2†). The results suggested that the two complexes can penetrate the cell membrane wall and undergo cellular internalization; the uptake of 1 (89.73 ± 0.23 ng per 106 cells) was greater than that of 2 (57.33 ± 0.92 ng per 106 cells) under the same conditions (Fig. 7a). Additionally, the intracellular distributions of copper content in the nucleus, mitochondria and cytoplasm were detected and were found to increase in each location. As shown in Fig. 7b, when HCT116 cells were treated with the two complexes, the detected results revealed that the total intake of 2 (65.21 ± 0.26 ng per 106 cells) was lower than that of 1 (99.35 ± 0.74 ng per 106 cells); however, the copper content of the intake of mitochondria with 2 (16.43 ± 0.10 ng per 106 cells) was greater than that of 1 (12.67 ± 0.20 ng per 106 cells). Therefore, 2 exhibited better cytotoxicity than 1 against HCT116 cells, which may be related to the mitochondrial targeting properties of the complex.
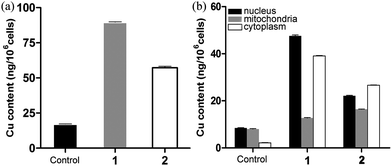 |
| | Fig. 7 HCT116 cells treated with 1 and 2 at 37 °C for 12 h. Copper content in 106 cells (A) and in the nucleus, mitochondria and cytoplasm (B) detected by ICP-MS. The mean ± SD (standard error of the mean) was obtained from three independent measurements for each experiment. | |
3.6 Detection of intracellular ROS levels
The level of intracellular reactive oxygen species (ROS) in apoptotic cells can be overexpressed; this is closely related to the cellular uptake of metal ions and the induction of mitochondrial dysfunction.59 2′,7′-dichlorodihydrofluorescein diacetate (DCFH-DA) is changed into its non-fluorescent form (DCFH) by intracellular esterases. In addition, DCFH is oxidized into DCF depending on the levels of intracellular ROS. The fluorescent product of DCF can be used to evaluate the level of intercellular ROS. As shown in Fig. 8, according to the results obtained from cell fluorescence imaging and flow cytometry, the control cells had lower green fluorescence intensity than the treated cells. Additionally, the fluorescence intensity increased upon the addition of increasing concentrations of 2, which indicated that enhanced intracellular oxidative stress in HCT116 cells was triggered. Moreover, to investigate the inhibitory effects between NAC and complex 2 on cell viability, NAC was used as an intercellular ROS scavenger.60 As shown in Fig. 9 (Table S3†), the survival of HCT116 cells treated with NAC increased significantly compared to cells only treated with 2. Thus, ROS induced by complex 2 play an important role in the apoptosis of HCT116 cells.
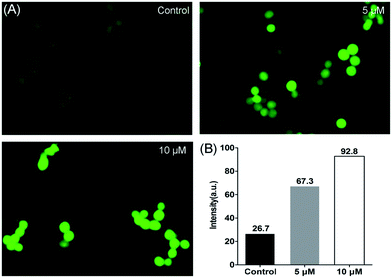 |
| | Fig. 8 Levels of intracellular ROS detected in HCT116 cells after treatment with 2 for 24 h. (A) Cell images were obtained from a Zeiss fluorescence microscope (×200 magnification). (B) The geometric mean intensity values of green fluorescence were measured by flow cytometry, and the data were analyzed using FlowJo software. | |
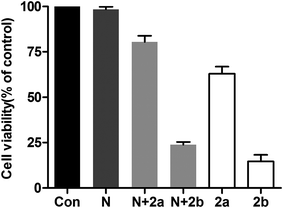 |
| | Fig. 9 Inhibitory effects of NAC plus 2 on cell viability in HCT116 cells. Cells were treated with NAC (10 mM) for 1 h and then incubated with 2 (5 and 10 μM) for 24 h. Con: control; N: NAC (10 mM); N + 2a: NAC (10 mM) + 2 (5 μM); N + 2b: NAC (10 mM) + 2 (10 μM); 2a: 2 (5 μM) and 2b: 2 (10 μM), respectively. The cell viability was determined by MTT assay. | |
3.7 Single cell gel electrophoresis assay
Changes in cell nuclear physiochemical factors, particularly those induced by internalization of metal-based agents in the cell nucleus, occur with oxidative damage, including fragmentation or degradation into smaller nucleic acid fragments.61 Single cell gel electrophoresis, a useful method to detect DNA damage, was used to characterize nucleic acid damage in this paper. As shown in Fig. 10a, when the cells were untreated with complex 2, the nuclei showed uniform round shapes. However, when the cells were treated with 2 at different concentrations, comet-like tails appeared in the nuclei; this effect increased with increasing concentration (Fig. 10b and c). These results indicate that complex 2 can induce nuclear damage in a concentration-dependent manner.
 |
| | Fig. 10 HCT116 cells treated with 2 for 24 h. The results of the comet assay were obtained by fluorescence microscopy with EB-staining (×200 magnification). | |
3.8 Cell cycle arrest
Cell cycle analysis was performed by flow cytometry to explore the anticancer mechanism of the metal-based complex. As shown in Fig. 11, the population of cells in S phase changed from 13.22% in the control sample to 24.17% and 30.20% at 5 and 10 μM, while the G0/G1 and G2/M phases all decreased. The results revealed that complex 2 can induce cell cycle arrest in S phase, and the effects on cell cycle progression are concentration-dependent. Actually, most DNA replication occurs within this phase; therefore, complex 2 can interfere with DNA replication.
 |
| | Fig. 11 Cell cycle analysis by flow cytometry for HCT116 cells treated with 2 (a, b and c for 0, 5 and 10 μM, respectively) for 24 h. The cell cycle distribution was analyzed by ModFit LT software and depicted with histograms. | |
3.9 Apoptosis assay by AO/EB and Hoechst 33258 staining
The morphological changes during the cell apoptosis process, including cell shrinkage, chromatin condensation, karyopycnosis, nuclear fragmentation, and formation of apoptotic bodies, were detected by AO/EB and Hoechst 33258 staining methods.62 The morphological changes of apoptosis induced by 2 are shown in Fig. 12. Under ordinary light microscopy, most of the HCT116 cells were contracted and rounded after treatment (Fig. 12b and c). As shown by the AO/EB dual staining results (Fig. 12d–f), the early and late phases of apoptotic cells appeared, as shown by orange and red fluorescence, respectively. When the treated cells were stained by Hoechst 33258 (Fig. 12g–i), the apoptotic cells presented bright blue fluorescence with morphological changes, such as half-moon shaped nuclei, condensed chromatin, and formed apoptotic bodies. These results confirm that complex 2 effectively induces apoptosis of HCT116 cells in a dose-dependent manner, which is consistent with the MTT assay described above.
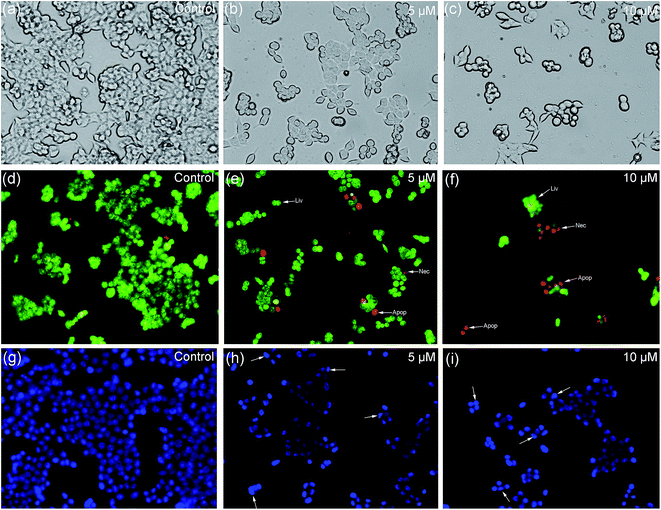 |
| | Fig. 12 Morphological changes of HCT116 cells upon treatment with 2 for 24 h under a fluorescence microscope (×200 magnification). (a–c) Ordinary optical imaging observation; (d–f) AO/EB double staining; (g–i) Hoechst 33258 staining. | |
3.10 Annexin V-FITC/PI dual staining assay
As shown in Fig. 13, the cells were treated by an Annexin V-FITC/PI dual staining method. In this detection, the living cells (lower-left panel) were double negative because they did not bind the two fluoresceins, while the early apoptotic cells (lower-right panel) were stained by single-positive Annexin V-FITC and the late apoptotic cells (upper-right panel) were stained by the two fluoresceins. In the upper-left panel, the cells were stained by single-positive PI fluorescein, mostly representing necrotic cells. The populations of apoptotic cells, including early apoptotic and late apoptotic cells, increased from 0.51% to 29.64% and 44.43%, respectively. The changes in the apoptotic cancer cells suggested that 2 can induce apoptosis of HCT116 cells.
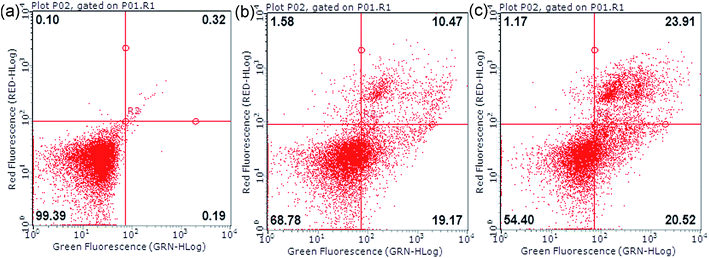 |
| | Fig. 13 Cell apoptosis of HCT116 cells treated with 2 (a, b and c for 0, 5 and 10 μM) for 24 h detected by flow cytometry using the Annexin-VFITC/PI double staining method. | |
3.11 Measurement of mitochondrial transmembrane potential (Δψm)
Mitochondria play a crucial role in the physiological metabolism of cells; they provide energy for cell survival and integrate with endogenous and exogenous apoptotic signal pathways, which is of great interest to researchers.63,64 The fluorescence probe JC-1 disperses red fluorescence when it accumulates as aggregates in mitochondria with high mitochondrial membrane potentials. The monomeric form of the JC-1 probe shows green fluorescence when the mitochondrial membrane potential decreases. When cells undergo apoptosis, the mitochondrial transmembrane potential (Δψm) collapses. As shown in Fig. 14, in the control, the ratio of red/green fluorescence intensity is 2.05, and the ratios of red/green fluorescence intensity are 0.28 and 0.15 for 5 and 10 μM concentrations of 2, respectively. The gradual decrease of the ratio indicates that the red fluorescence intensity decreases and the green fluorescence intensity increases. The results show that mitochondria are involved in the process of apoptosis induced by 2. Additionally, the binding studies indicated that complex 1 binds more strongly to DNA; however, the cell biological studies indicated that complex 2 shows higher cytotoxicity in cancer cells than complex 1. The newly synthesized complex 2 contains a PPh3 group and possesses mitochondrion-targeting activity, which may be the reason for this behavior.
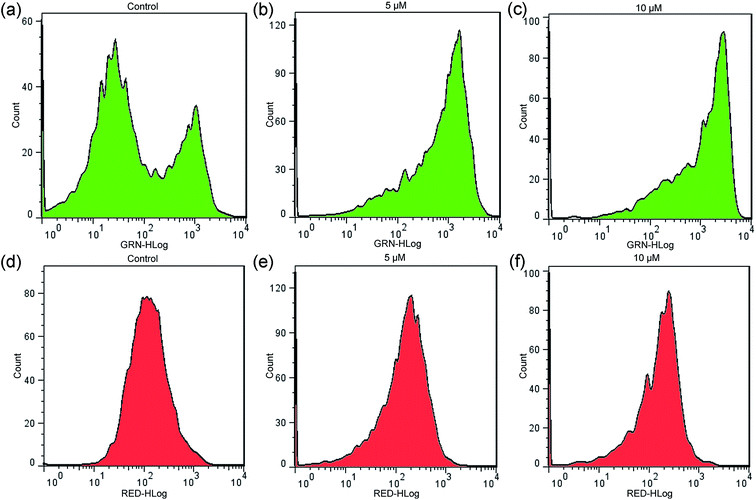 |
| | Fig. 14 Mitochondrial transmembrane potential determined by flow cytometric analysis stained with JC-1 as a fluorescent probe. HCT116 cells were treated with 2 for 24 h. The red and green fluorescence represent hyperpolarized and depolarized mitochondria, respectively. The data were analyzed using FlowJo software and depicted with histograms. | |
4. Conclusions
In this paper, two new copper-based complexes containing 2-(2′-quinolyl)benzimidazole were synthesized and characterized. The complexes exhibit strong CT-DNA binding and chemical nuclease activities and show high cytotoxicity toward four different human cancer cell lines, with the lowest IC50 value of 4.25 ± 0.39 μM. Moreover, complex 2 can induce apoptosis by intracellular ROS generation, cell cycle arrest, and mitochondrial and nuclear dual-damage. These experimental results may be beneficial for the development of benzimidazole–quinolinyl-based copper complexes for use as potential antineoplastic agents. Further studies are needed to explore the pharmacological mechanisms of the effects of the complexes in vivo and to facilitate the development of novel endogenous copper-based anticancer agents.
Conflicts of interest
There are no conflicts to declare.
Acknowledgements
We gratefully acknowledge the financial support by the National Natural Science Foundation of China (No. 21371046 and 21401041).
References
- N. Muhammad and Z. Guo, Curr. Opin. Chem. Biol., 2014, 19, 144–153 CrossRef CAS PubMed.
- I. Romero-Canelón and P. J. Sadler, Inorg. Chem., 2013, 52, 12276–12291 CrossRef PubMed.
- W. Liu and R. Gust, Chem. Soc. Rev., 2013, 42, 755–773 RSC.
- C. Santini, M. Pellei, V. Gandin, M. Porchia, F. Tisato and C. Marzano, Chem. Rev., 2013, 114, 815–862 CrossRef PubMed.
- G. Gasser, I. Ott and N. Metzler-Nolte, J. Med. Chem., 2010, 54, 3–25 CrossRef PubMed.
- S. H. van Rijt and P. J. Sadler, Drug Discovery Today, 2009, 14, 1089–1097 CrossRef CAS PubMed.
- M. Frezza, S. Hindo, D. Chen, A. Davenport, S. Schmitt, D. Tomco and Q. Ping Dou, Curr. Pharm. Des., 2010, 16, 1813–1825 CrossRef CAS PubMed.
- R. Křikavová, J. Vančo, Z. Trávníček, R. Buchtík and Z. Dvořák, RSC Adv., 2016, 6, 3899–3909 RSC.
- M. González-Álvarez, A. Pascual-Álvarez, L. del Castillo Agudo, A. Castiñeiras, M. Liu-González, J. Borrás and G. Alzuet-Piña, Dalton Trans., 2013, 42, 10244–10259 RSC.
- C. Duncan and A. R. White, Metallomics, 2012, 4, 127–138 RSC.
- C. A. Puckett, R. J. Ernst and J. K. Barton, Dalton Trans., 2010, 39, 1159–1170 RSC.
- Q. Gan, C.-L. Zhang, B.-F. Wang, Y.-H. Xiong, Y.-L. Fu, Z.-W. Mao and X.-Y. Le, RSC Adv., 2016, 6, 35952–35965 RSC.
- Y.-H. Liu, A. Li, J. Shao, C.-Z. Xie, X.-Q. Song, W.-G. Bao and J.-Y. Xu, Dalton Trans., 2016, 45, 8036–8049 RSC.
- W. A. Wani, U. Baig, S. Shreaz, R. A. Shiekh, P. F. Iqbal, E. Jameel, A. Ahmad, S. H. Mohd-Setapar, M. Mushtaque and L. T. Hun, New J. Chem., 2016, 40, 1063–1090 RSC.
- A. Gautier and F. Cisnetti, Metallomics, 2012, 4, 23–32 RSC.
- D. Denoyer, S. Masaldan, S. La Fontaine and M. A. Cater, Metallomics, 2015, 7, 1459–1476 RSC.
- R. Sáez, J. Lorenzo, M. J. Prieto, M. Font-Bardia, T. Calvet, N. Omeñaca, M. Vilaseca and V. Moreno, J. Inorg. Biochem., 2014, 136, 1–12 CrossRef PubMed.
- A. Castonguay, C. d. Doucet, M. Juhas and D. Maysinger, J. Med. Chem., 2012, 55, 8799–8806 CrossRef CAS PubMed.
- W. Zhou, X. Wang, M. Hu, C. Zhu and Z. Guo, Chem. Sci., 2014, 5, 2761–2770 RSC.
- I. Papazoglou, P. Cox, A. Hatzidimitriou, C. Kokotidou, T. Choli-Papadopoulou and P. Aslanidis, Eur. J. Med. Chem., 2014, 78, 383–391 CrossRef CAS PubMed.
- K. P. Barot, S. Nikolova, I. Ivanov and M. D. Ghate, Mini-Rev. Med. Chem., 2013, 13, 1421–1447 CrossRef CAS PubMed.
- X.-B. Fu, J.-J. Zhang, D.-D. Liu, Q. Gan, H.-W. Gao, Z.-W. Mao and X.-Y. Le, J. Inorg. Biochem., 2015, 143, 77–87 CrossRef CAS PubMed.
- R. Lin, G. Chiu, Y. Yu, P. J. Connolly, S. Li, Y. Lu, M. Adams, A. R. Fuentes-Pesquera, S. L. Emanuel and L. M. Greenberger, Bioorg. Med. Chem. Lett., 2007, 17, 4557–4561 CrossRef CAS PubMed.
- F. Hackenberg and M. Tacke, Dalton Trans., 2014, 43, 8144–8153 RSC.
- C. G. Mortimer, G. Wells, J.-P. Crochard, E. L. Stone, T. D. Bradshaw, M. F. Stevens and A. D. Westwell, J. Med. Chem., 2006, 49, 179–185 CrossRef CAS PubMed.
- H. Takuzo, I. Masataka, T. Konosuke and T. Masanobu, Chem. Pharm. Bull., 1982, 30, 2996–3004 CrossRef.
- O. V. Dolomanov, L. J. Bourhis, R. J. Gildea, J. A. Howard and H. Puschmann, J. Appl. Crystallogr., 2009, 42, 339–341 CrossRef CAS.
- L. Palatinus and G. Chapuis, J. Appl. Crystallogr., 2007, 40, 786–790 CrossRef CAS.
- G. M. Sheldrick, Acta Crystallogr., Sect. C: Struct. Chem., 2015, 71, 3–8 CrossRef PubMed.
- J. Marmur, J. Mol. Biol., 1961, 3, 208–218 CrossRef CAS.
- M. Reichmann, S. Rice, C. Thomas and P. Doty, J. Am. Chem. Soc., 1954, 76, 3047–3053 CrossRef CAS.
- T. Mosmann, J. Immunol. Methods, 1983, 65, 55–63 CrossRef CAS PubMed.
- D. Anderson, T.-W. Yu, B. Phillips and P. Schmezer, Mutat. Res., Fundam. Mol. Mech. Mutagen., 1994, 307, 261–271 CrossRef CAS PubMed.
- X. Qiao, Z.-Y. Ma, J. Shao, W.-G. Bao, J.-Y. Xu, Z.-Y. Qiang and J.-S. Lou, BioMetals, 2014, 27, 155–172 CrossRef CAS PubMed.
- N. Donappa and S. Naikar, Asian J. Chem., 1993, 5, 995 CAS.
- P. Van der Sluis and A. Spek, Acta Crystallogr., Sect. A: Found. Crystallogr., 1990, 46, 194–201 CrossRef.
- J. Min, Q. Zhang, W. Sun, Y. Cheng and L. Wang, Dalton Trans., 2011, 40, 686–693 RSC.
- M. Alagesan, N. S. Bhuvanesh and N. Dharmaraj, Dalton Trans., 2013, 42, 7210–7223 RSC.
- S. T. Chew, K. M. Lo, S. K. Sinniah, K. S. Sim and K. W. Tan, RSC Adv., 2014, 4, 61232–61247 RSC.
- M. Chauhan and F. Arjmand, Chem. Biodiversity, 2006, 3, 660–676 CAS.
- A. Lauria, R. Bonsignore, A. Terenzi, A. Spinello, F. Giannici, A. Longo, A. M. Almerico and G. Barone, Dalton Trans., 2014, 43, 6108–6119 RSC.
- G. Barone, A. Terenzi, A. Lauria, A. M. Almerico, J. M. Leal, N. Busto and B. García, Coord. Chem. Rev., 2013, 257, 2848–2862 CrossRef CAS.
- C. Hiort, P. Lincoln and B. Nordén, J. Am. Chem. Soc., 1993, 115, 3448–3454 CrossRef CAS.
- F. J. Meyer-Almes and D. Porschke, Biochemistry, 1993, 32, 4246–4253 CrossRef CAS PubMed.
- R. F. Pasternack, M. Caccam, B. Keogh, T. A. Stephenson, A. P. Williams and E. J. Gibbs, J. Am. Chem. Soc., 1991, 113, 6835–6840 CrossRef CAS.
- X.-B. Fu, D.-D. Liu, Y. Lin, W. Hu, Z.-W. Mao and X.-Y. Le, Dalton Trans., 2014, 43, 8721–8737 RSC.
- J. R. Lakowicz and G. Weber, Biochemistry, 1973, 12, 4161–4170 CrossRef CAS PubMed.
- K. Dhara, P. Roy, J. Ratha, M. Manassero and P. Banerjee, Polyhedron, 2007, 26, 4509–4517 CrossRef CAS.
- M. M. Subarkhan, R. Prabhu, R. R. Kumar and R. Ramesh, RSC Adv., 2016, 6, 25082–25093 RSC.
- N. Shahabadi, M. Pourfoulad and A. Taherpour, J. Coord. Chem., 2017, 70, 201–222 CrossRef CAS.
- Q. Guo, L. Li, J. Dong, H. Liu, T. Xu and J. Li, Spectrochim. Acta, Part A, 2013, 106, 155–162 CrossRef CAS PubMed.
- H.-R. Zhang, Y.-C. Liu, T. Meng, Q.-P. Qin, S.-F. Tang, Z.-F. Chen, B.-Q. Zou, Y.-N. Liu and H. Liang, MedChemComm, 2015, 6, 2224–2231 RSC.
- B. Halliwell and J. M. Gutteridge, Methods Enzymol., 1990, 186, 1–85 CAS.
- S. D. Aust, L. A. Morehouse and C. E. Thomas, J. Free Radicals Biol. Med., 1985, 1, 3–25 CrossRef CAS.
- X. Qiao, Z. Y. Ma, C. Z. Xie, F. Xue, Y. W. Zhang, J. Y. Xu, Z. Y. Qiang, J. S. Lou, G. J. Chen and S. P. Yan, J. Inorg. Biochem., 2011, 105, 728–737 CrossRef CAS PubMed.
- X. Qiao, Z. Y. Ma, J. Shao, W. G. Bao, J. Y. Xu, Z. Y. Qiang and J. S. Lou, BioMetals, 2014, 27, 155 CrossRef CAS PubMed.
- V. Rajendiran, R. Karthik, M. Palaniandavar, H. Stoecklievans, V. S. Periasamy, M. A. Akbarsha, B. S. Srinag and H. Krishnamurthy, Inorg. Chem., 2007, 46, 8208–8221 CrossRef CAS PubMed.
- W. Zhou, Chem. Sci., 2014, 5, 2761 RSC.
- G. Gasser, I. Ott and N. Metzlernolte, J. Med. Chem., 2011, 54, 3–25 CrossRef CAS PubMed.
- J. Zheng, J. R. Lou, X. X. Zhang, D. M. Benbrook, M. H. Hanigan, S. E. Lind and W. Q. Ding, Cancer Lett., 2010, 298, 186–194 CrossRef CAS PubMed.
- M. Genestra, Cell. Signalling, 2007, 19, 1807 CrossRef CAS PubMed.
- S. H. Lai, G. B. Jiang, J. H. Yao, W. Li, B. J. Han, C. Zhang, C. C. Zeng and Y. J. Liu, J. Inorg. Biochem., 2015, 152, 1–9 CrossRef CAS PubMed.
- X. Qiao, Z. Y. Ma, J. Shao, W. G. Bao, J. Y. Xu, Z. Y. Qiang and J. S. Lou, BioMetals, 2014, 27, 155–172 CrossRef CAS PubMed.
- T. Chen and Y. S. Wong, Int. J. Biochem. Cell Biol., 2009, 41, 666–676 CrossRef CAS PubMed.
Footnote |
| † Electronic supplementary information (ESI) available. CCDC 1527274 and 1527275 contains the supplementary crystallographic data for 1 and 2. For ESI and crystallographic data in CIF or other electronic format see DOI: 10.1039/c7ra09102h |
|
| This journal is © The Royal Society of Chemistry 2017 |
Click here to see how this site uses Cookies. View our privacy policy here.  Open Access Article
 *a,
Shuangcheng Zhib,
Huaibin Yuc,
Ruina Maoc,
Jiyong Hu*a,
Wei Songb and
Junshuai Zhanga

![[thin space (1/6-em)]](https://www.rsc.org/images/entities/char_2009.gif) 100
100![[thin space (1/6-em)]](https://www.rsc.org/images/entities/char_2009.gif)
![[thin space (1/6-em)]](https://www.rsc.org/images/entities/char_2009.gif) 000 events per sample were acquired. The percentages of cells in the different cell cycle phases were analyzed by ModFit LT software.
000 events per sample were acquired. The percentages of cells in the different cell cycle phases were analyzed by ModFit LT software.
![[thin space (1/6-em)]](https://www.rsc.org/images/entities/char_2009.gif) :
:![[thin space (1/6-em)]](https://www.rsc.org/images/entities/char_2009.gif) ethanol = 1
ethanol = 1![[thin space (1/6-em)]](https://www.rsc.org/images/entities/char_2009.gif) :
:![[thin space (1/6-em)]](https://www.rsc.org/images/entities/char_2009.gif) 3) was added to each well, followed by incubation at room temperature for 10 min. The cells were stained with 1 mL Hoechst 33258 fluorescent dye (5 μg mL−1) for 10 min in the dark and then washed twice with ice-cold PBS. The optical imaging results for the cells were obtained using the Zeiss fluorescence microscope. In addition, for the AO/EB dual staining assay, the cells were immediately stained with AO/EB dyeing solution (100 μg mL−1 AO, 100 μg mL−1 EB) at room temperature in the dark. The cells were identified using a Nikon fluorescence microscope.
3) was added to each well, followed by incubation at room temperature for 10 min. The cells were stained with 1 mL Hoechst 33258 fluorescent dye (5 μg mL−1) for 10 min in the dark and then washed twice with ice-cold PBS. The optical imaging results for the cells were obtained using the Zeiss fluorescence microscope. In addition, for the AO/EB dual staining assay, the cells were immediately stained with AO/EB dyeing solution (100 μg mL−1 AO, 100 μg mL−1 EB) at room temperature in the dark. The cells were identified using a Nikon fluorescence microscope.
![[thin space (1/6-em)]](https://www.rsc.org/images/entities/char_2009.gif) 000 events per sample were acquired.
000 events per sample were acquired.

![[thin space (1/6-em)]](https://www.rsc.org/images/entities/char_2009.gif) :
:![[thin space (1/6-em)]](https://www.rsc.org/images/entities/char_2009.gif) 1, the presence of complexes 1 and 2 induced decreases in the intensities of both the positive and negative bands and the CD spectrum peaks underwent a slight red-shift; this indicates that the intercalation mode may be present between the complex and the DNA.51 Moreover, at the same treatment concentration, complex 1 exhibited larger spectral band changes than complex 2 in both the positive and negative absorption bands, which further suggests that the intercalation ability of complex 1 with CT-DNA is stronger than that of complex 2.52
1, the presence of complexes 1 and 2 induced decreases in the intensities of both the positive and negative bands and the CD spectrum peaks underwent a slight red-shift; this indicates that the intercalation mode may be present between the complex and the DNA.51 Moreover, at the same treatment concentration, complex 1 exhibited larger spectral band changes than complex 2 in both the positive and negative absorption bands, which further suggests that the intercalation ability of complex 1 with CT-DNA is stronger than that of complex 2.52


