 Open Access Article
Enhancement of thermal conductivity in polyamide-6/graphene composites via a “bridge effect” of silicon carbide whiskers†
Na Song‡
 *,
Haidong Pan‡,
Xingshuang Hou,
Siqi Cui,
Liyi Shi and
Peng Ding*
Research Center of Nanoscience and Nanotechnology, Shanghai University, 99 Shangda Road, Shanghai 200444, P. R. China. E-mail: snlxf@shu.edu.cn; dingpeng@shu.edu.cn
First published on 29th September 2017
Abstract
It is urgent to manufacture a polymer composite that has high thermal conductivity and mechanical properties simultaneously to meet the heat dissipation requirement of electronic devices. In this paper, we report a bridge effect of Silicon Carbide whiskers (SiCw) on the enhancement of thermal conductivity (TC) in polyamide-6/graphene (PG) composites. The composite was made by melting, stirring through an Internal mixer. Experimental results show that the TC of the PG composites increases with additional introduction of SiCw, particularly in the through-plane direction. For example, based on the PG-2 sample (2 wt% graphene in polyamide-6 (PA) matrix), the thermal conductivity enhancement (TCE) of PASC-24 (similar to 2 wt% graphene and 43.2 wt% SiCw in the PA matrix) in the through-plane direction is 199%, while in contrast, the TCE in the in-plane direction is just 5.4%. Meanwhile, the mechanical properties of the composites are synchronously enhanced, indicating that it is a convenient method and can be widely applied in various thermal interface materials (TIMs) and thermal management systems.
Introduction
With the application and development of electronic products, effective thermal management technology has become the key to the normal operation of electronic products in many fields.1–3 Polymer composites with light weight, corrosion resistance, low cost, easy processing, etc. are widely used in various electronic devices, such as light-emitting diode devices, batteries and communication equipment.4,5 However, most polymers have low thermal conductivity (0.1–0.5 W m−1 K−1), far below the demand of thermal conductivity of most electronic products.4,6,7 Many researchers have tried to combine nanoscale thermally conductive fillers and polymers to improve the TC.8,9Graphene has extraordinarily high in-plane thermal conductivity (2000–5000 W m−1 K−1 near room temperature), mechanical strength, and ultralarge specific surface area. Within several years since discovered, graphene has been widely applied to various fields on account of these unique properties.10–13 It has been proved that the TC of the composites can be greatly enhanced by introducing graphene into polymer.14–17 Park et al.18 reported a TCE of 90% in polystyrene composites just with 10 vol% of graphene. However, the heat conduction of graphene exhibits pronounced anisotropy, the TC in the in-plane direction (λx) exceeds its TC in the through-plane direction (λz) counterpart by three orders of magnitude, whereas the value is about 5 W m−1 K−1 19, quite evidently, the low λz of graphene composites limits its wider application. Many researchers have adopted various methods to improve the λz of polymer/graphene composites, our group14 reported a method that the covalent modification of graphene can improve the λz of PA composites from 0.29 to 0.41 W m−1 K−1, increased by 41.4%. Yuan et al.20 reported that the combined use of tetrapod-shaped zinc oxide (T-ZnO) whiskers and boron nitride (BN) flakes can improve the λz of phenolic formaldehyde resin (PF), the maximum λz of 1.48 W m−1 K−1 is observed with a T-ZnO![[thin space (1/6-em)]](https://www.rsc.org/images/entities/char_2009.gif) :
:![[thin space (1/6-em)]](https://www.rsc.org/images/entities/char_2009.gif) BN mass ratio of 1
BN mass ratio of 1![[thin space (1/6-em)]](https://www.rsc.org/images/entities/char_2009.gif) :
:![[thin space (1/6-em)]](https://www.rsc.org/images/entities/char_2009.gif) 9 (the total mass is 60 wt%) which is 35.8% higher than that of PF/BN binary composite. Both of them builded a thermal path in the through-plane direction, however, neither the TC or TCE is pretty well. Hence, how to fabricate a polymer/graphene composite that has a high TC in the through-plane direction is necessary and urgent.
9 (the total mass is 60 wt%) which is 35.8% higher than that of PF/BN binary composite. Both of them builded a thermal path in the through-plane direction, however, neither the TC or TCE is pretty well. Hence, how to fabricate a polymer/graphene composite that has a high TC in the through-plane direction is necessary and urgent.
In this paper, we report a bridge effect of SiCw on the enhancement of TC in the PG composites. That the TC of the PG composites increases with additional introduction of SiCw, particularly in the longitudinal direction. It is due to that 1-D SiCw could filled the gap between the 2-D graphene nanosheets to prevent the accumulation of graphene, and a thermally conductive path is additionally constructed in the longitudinal direction.21,22 With the help of hot pressing, the combination of the filler and the matrix is more tight,23 these effectively reduce the interface thermal resistance. With 2 wt% graphene in the PA composites, the λz is 0.52 W m−1 K−1, and the λz of PASC-24 is 1.55 W m−1 K−1 with similar graphene content, the TCE is 199%. While, the λx of the above composites increases from 7.11 W m−1 K−1 to 7.49 W m−1 K−1, the TCE is just 5.4%. The PASC composites have high values of λz and λx simultaneously, the maximum TC presented in the PASC-4 (9 wt% graphene and 36 wt% SiCw in the PA matrix) can reach 2.31 and 8.55 W m−1 K−1 in the two direction, compared with the pure PA, the TCE is 508% and 187%, respectively. Meanwhile, the mechanical properties of the composites are synchronously enhanced, the Young's modulus and microhardness of the PA composites increase from 2.11 to 4.98 GPa and 0.11 to 0.214 GPa, increased by 136 and 94.5%, respectively. The high λx and λz of the PASC composites, especially the enhancement of λz and mechanical properties is rarely reported in other literature before, and it can be applied in TIMs, connectors and other high-performance thermal management systems.
Experimental
Materials
PA slices were purchased from SINOPEC BALING COMPANY, whose density is 1.128 g cm−3; graphene nanosheets were provided by LEVSON(Shanghai, China); SiC whiskers were purchased from SHENGNA COMPANY(Shanghai, China), whose purity is 99% and the aspect ratio is 20.Preparation of PA composites
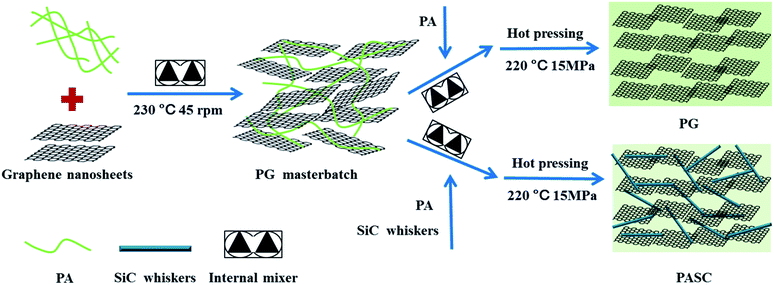
PA composites were prepared via melt-blending process described as below (schematically represented in the Fig. 1).Firstly, the PA slices were dried in an oven at 90 °C for 2 hours. Secondly, PA slices were blended with graphene in a Internal mixer with graphene content of 10 wt% to obtain PG masterbatch (blended at 230 °C for 5 min at a rotation speed of 45 rpm). Eventually, the PG masterbatch was blended with PA slices with 0.1 wt%, 0.5 wt%, 1 wt%, 2 wt% and 3 wt% of graphene in the Internal mixer, respectively, and then the PG composites were obtained. The samples were named PG-0.1, PG-0.5, PG-1, PG-2, PG-3.
Under the condition that the total filling (graphene and SiCw) amount is 45 wt%, the filler and PA were prepared by melt blending under the same processing conditions as above. The resulting product had a gravimetric ratio of SiCw to graphene is 1![[thin space (1/6-em)]](https://www.rsc.org/images/entities/char_2009.gif) :
:![[thin space (1/6-em)]](https://www.rsc.org/images/entities/char_2009.gif) 0, 24
0, 24![[thin space (1/6-em)]](https://www.rsc.org/images/entities/char_2009.gif) :
:![[thin space (1/6-em)]](https://www.rsc.org/images/entities/char_2009.gif) 1, 8
1, 8![[thin space (1/6-em)]](https://www.rsc.org/images/entities/char_2009.gif) :
:![[thin space (1/6-em)]](https://www.rsc.org/images/entities/char_2009.gif) 1, 4
1, 4![[thin space (1/6-em)]](https://www.rsc.org/images/entities/char_2009.gif) :
:![[thin space (1/6-em)]](https://www.rsc.org/images/entities/char_2009.gif) 1, respectively, which was name PASC-0, PASC-24, PASC-8, PASC-4, the content of graphene in each component is 0 wt%, 1.8 wt%, 5 wt%, 9 wt%, respectively.
1, respectively, which was name PASC-0, PASC-24, PASC-8, PASC-4, the content of graphene in each component is 0 wt%, 1.8 wt%, 5 wt%, 9 wt%, respectively.
The fabrication of the PA composites testing materials is depicted as follows: (1) putting the composites in the mold in a flat vulcanizing machine (2) melting at 220 °C for 10 min to soften the material (3) degassing three times (4) pressing under 15 MPa for 10 min (5) cooling under 15 MP and then stripping. A cylindrical thermal conductive test sample (12.7 mm diameter and approximately 1.7 mm thickness) was obtained to test the λz, and then the samples with 25 mm diameter and 40 μm thickness were acquired by mold compression between two parallel plates to test the λx (Fig. 2).
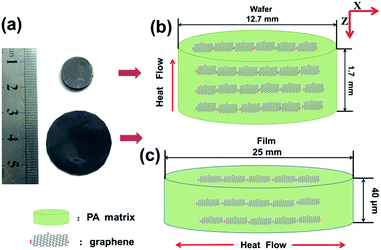 | ||
| Fig. 2 (a) The photographic images of samples, illustration of (b) samples for λz and (c) samples for λx. | ||
Characterization
Fourier transform infrared (FTIR) spectra were recorded on an AVATAR370 Fourier infrared spectrometer using potassium bromide pellets. Raman spectra were obtained using an INVIA confocal micro Raman spectrometer with a 633 nm laser. X-ray diffraction (XRD) patterns were collected by a D/MAX2500/PC X-ray diffractometer with Cu-Kα radiation (λ = 0.154 nm). Transmission electron microscopy (TEM) graphs were acquired under a 200CX transmission electron microscope. High-resolution transmission electron microscopy (HRTEM) was acquired by JEM-2010F, scanning electron microscopy (SEM) images were acquired with a JSM-7500F emission scanning electron microscope. The size of graphene nanosheets were determined by nanoparticle size analyzer (Mastersizer 2000 Malvern Instruments, U.K). Micro-mechanical properties measurements were carried out using a microhardness tester Triboindenter (Hysiror Co., Ltd, USA). The thermal conductivities of the nanocomposites were measured by a Netzsch LFA 447 Nanoflash at 25 °C. λz and λx were determined by measuring the heat flux and the differential temperature across the samples. The test was repeated at least six times for each nanocomposite to ensure data accuracy and reproducibility.Results and discussion
Characterization of graphene nanosheets and SiCw
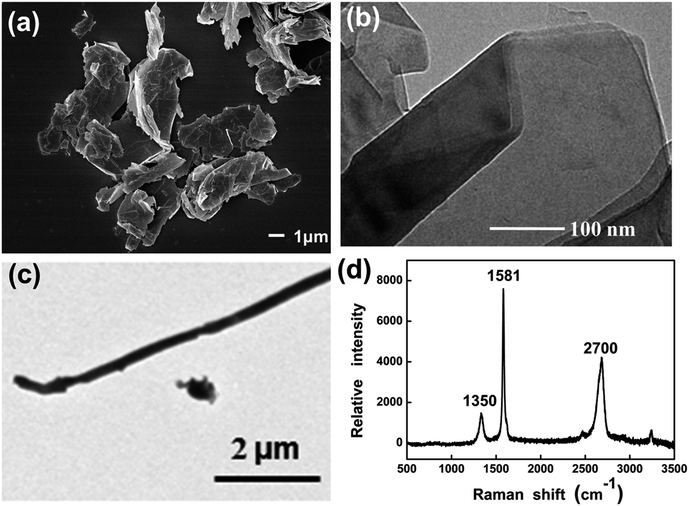
The graphene have a distinct 2-D sheet structure, the size distribution of graphene nanosheets is nearly homogeneous, most of them distribute in about 10 μm and six layers (Fig. 3a and b, S1†). The structures and the defect density of graphene nanosheets were characterized by Raman spectra (Fig. 3d), D peaks appearing at 1350 cm−1, are ascribed to the amorphous carbon and lattice defects in the graphene. G peaks appearing at 1581 cm−1, caused by the vibrational mode of the phonon E2g in the hexagonal graphene structure, which is the sp2 vibrational characteristic peak of carbon.24,25 The D-to-G peak intensity ratio is as low as 0.19, indicating that the graphene nanosheets have low defect densities,26 which is good for heat conduction compared with high defect densities in the polymer composites.27 Besides, the SiCw have a distinct 1-D whisker-like structure (Fig. 3c), the aspect ratio is 20. The size of graphene nanosheets and SiCw is consistent with the data provided by the manufacturer.TC of PG composites
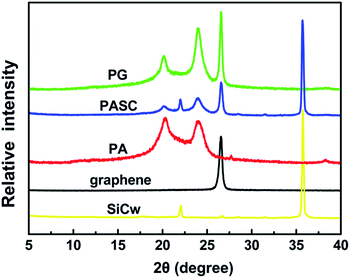
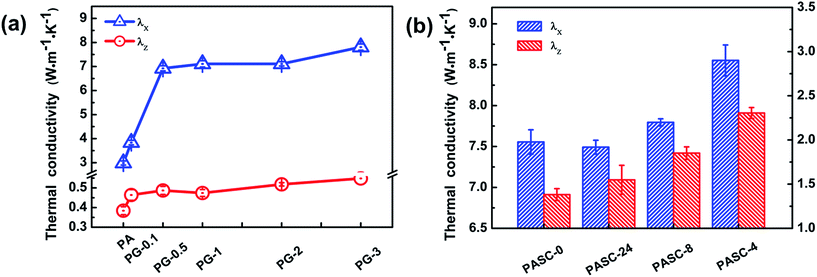
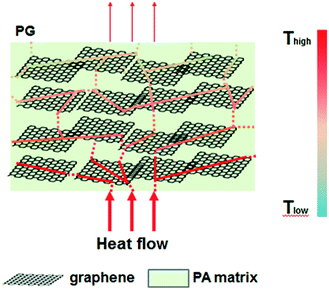
The TC of the PA composites were measured by a “laser flash” technique. The thermal conductivity is obtained by the formula: K = α × ρ × Cp, where α is the thermal diffusivity, ρ is the mass density and Cp is the specific heat of the sample. The detailed mechanism and methodology of the laser flash system have ever been reported in our previous study27,28 (Fig. S2†). XRD spectrum was used to characterize the physical form of matter in the polymer composites. From the XRD spectrum (Fig. 4), pure PA are observed with peaks at 2θ = 20.5° and 24.7, corresponding to (200) and (002) reflections of α-form crystal, respectively.29 Both of the graphene and PG composite are observed with peaks at 2θ = 25.6°, which d-spacing is 3.46 Å, corresponding with the thickness of a layer of graphene30. The detailed TC values of the PG composite can be found in Fig. 5a and Table S1.† The λx of pure PA was 2.98 W m−1 K−1, which is similar to the value that we have ever reported.14With the increase of filler content, the λx and λz of the PG composites increase consistently. When 3 wt% of graphene nanosheets were added in PA matrix, the λx can reach as high as 7.81 W m−1 K−1, the λz is 0.58 W m−1 K−1. The enhancement of the TC are generated by the high TC filler of graphene in the polymer composite.31,32 Obviously compared with the λz, the λx of all the composites are higher (Fig. 5a). It is caused by the anisotropic thermal conduction of the graphene in the polymer composites.19 The TC of the polymer is determined by vibration of the of the phonon.33 The in-plane direction of graphene nanosheets is a perfect carbon–carbon conjugate structure, the vibration of the phonon is high, leading a good λx. Contrastly, there is a van der Waals' force on the through-plane direction, which can not form an effective heat conduction channel, leading to a low λz34,35 (Fig. 6). During the hot-pressing, the orientation of graphene in PA matrix were formed, which can be seen in the Fig. 7b, graphene has a linear lamellar structure distribution in it, giving rise to a more obvious anisotropic TC.36 It is worth noting that the TC increase rapidly with introduction of a little graphene nanosheets, while the addition of graphene content exceeding 0.5 wt%, the TC increase slowly both in the in-plane and through-plane direction. It may be caused by the aggregation of graphene nanosheets due to the van der Waals force between layers during the melting processing,34 which is not beneficial to build a thermal path.
TC of PASC composites
The low λz value of PG composites is due to the anisotropic thermal conduction of graphene and its orientation in the PA matrix,37 which is inevitable during melting processing and hot-pressing process. Obviously, the low TC, especially in the through-plane direction, limits the application of PA composites in the thermal management systems. Therefore, in this section, the bridge effect of SiCw on the enhancement of thermal conductivity of PG composites were studied. The XRD spectrum of PASC (Fig. 4) is almost identical to the PG, in addition to that, there are two new peaks in the spectrum, which are similar to the characteristic peaks of SiCw,38 indicating that SiCw is filled inside the PA composites. The TC values of the PASC composites are shown in the Fig. 5b and Table S2.† The λz of PASC-24 is 1.55 W m−1 K−1, compared with the PG-2, the TCE is 199%. Contrastly, the λx of the above composites increase from 7.11 W m−1 K−1 to 7.49 W m−1 K−1, the TCE is just 5.4%. With the increasement of the ratio of graphene to SiCw, the maximum λx and λz of PSAC-4 can reaches 8.55 and 2.31 W m−1 K−1, respectively, which can meet the need of electronic applications.7 Some articles have been reported this bridge effect,20,21 however, they are either bad bridge effect or expensive raw materials. Evidently, the TC and TCE of the PASC composite is one of the highest values ever reported for the composite of two kind fillers (Table 1).| TCE(%) | λz (W m−1 K−1) | Total content and the ratio | Two filler synergistic in the matrix | One filler in the matrix | Matrix | Ref. |
|---|---|---|---|---|---|---|
| 35.8 | 1.48 | 60 wt% (1![[thin space (1/6-em)]](https://www.rsc.org/images/entities/char_2009.gif) : :![[thin space (1/6-em)]](https://www.rsc.org/images/entities/char_2009.gif) 9) 9) |
BN and T-ZnO | BN | PF | 20 |
| 17.4 | 1.75 | 10 wt% (1![[thin space (1/6-em)]](https://www.rsc.org/images/entities/char_2009.gif) : :![[thin space (1/6-em)]](https://www.rsc.org/images/entities/char_2009.gif) 3) 3) |
Graphene and SWCNT | Graphene | Epoxy | 21 |
| ∼18.8 | 0.808 | 50 wt% (4![[thin space (1/6-em)]](https://www.rsc.org/images/entities/char_2009.gif) : :![[thin space (1/6-em)]](https://www.rsc.org/images/entities/char_2009.gif) 1) 1) |
BN and Al2O3 | BN | Epoxy | 39 |
| 23 | ∼0.55 | 35 wt% (6![[thin space (1/6-em)]](https://www.rsc.org/images/entities/char_2009.gif) : :![[thin space (1/6-em)]](https://www.rsc.org/images/entities/char_2009.gif) 1) 1) |
BN and MWCNT | BN | iPP | 40 |
| 38 | 0.662 | 21.5 wt% (20![[thin space (1/6-em)]](https://www.rsc.org/images/entities/char_2009.gif) : :![[thin space (1/6-em)]](https://www.rsc.org/images/entities/char_2009.gif) 1.5) 1.5) |
Graphene and BN | Graphene | PS | 41 |
| 87.6 | 0.89 | 8.4 wt% (4![[thin space (1/6-em)]](https://www.rsc.org/images/entities/char_2009.gif) : :![[thin space (1/6-em)]](https://www.rsc.org/images/entities/char_2009.gif) 1) 1) |
Graphene and BN | Graphene | PA | 42 |
| 92 | 0.98 | 10 vol% (1![[thin space (1/6-em)]](https://www.rsc.org/images/entities/char_2009.gif) : :![[thin space (1/6-em)]](https://www.rsc.org/images/entities/char_2009.gif) 1) 1) |
CF and BN | CF | PA | 43 |
| ∼71.4 | ∼0.6 | 35 wt% (6![[thin space (1/6-em)]](https://www.rsc.org/images/entities/char_2009.gif) : :![[thin space (1/6-em)]](https://www.rsc.org/images/entities/char_2009.gif) 1) 1) |
Graphite and CF | Graphite | PA | 44 |
| 199 | 1.55 | 45 wt% (1![[thin space (1/6-em)]](https://www.rsc.org/images/entities/char_2009.gif) : :![[thin space (1/6-em)]](https://www.rsc.org/images/entities/char_2009.gif) 24) 24) |
Graphene and SiCw | Graphene | PA | This work |
| 508 contrast with matrix | 2.31 | 45 wt% (1![[thin space (1/6-em)]](https://www.rsc.org/images/entities/char_2009.gif) : :![[thin space (1/6-em)]](https://www.rsc.org/images/entities/char_2009.gif) 4) 4) |
Graphene and SiCw | Graphene | PA |
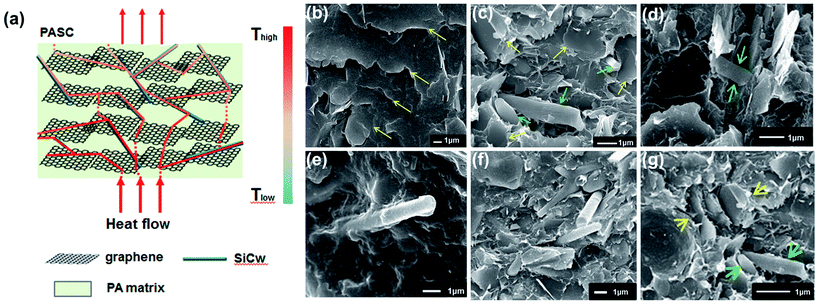
In contrast with the PG composites, an interesting phenomenon appeared: the TC of the PG composites in the through-plane direction was enhanced effectively with the addition of SiCw, it mainly caused by the following reasons: Fig. 7c–g show that under the shearing force of the Internal mixer, the 1-D SiC whiskers could filled the gap of the 2-D graphene nanosheets, especially in the through-plane direction, it can be observed that the columnar structures with vertical erects are sandwiched between the graphene nanosheets (Fig. 7d–f). Its two end junctions may be formed the hydrogen bonds with graphene nanosheets, and then combined more closely (Fig. S3†) and a SiCw thermally conductive paths is constructed in the through-plane direction. Just like Liu45 reported that the cross-linkers are effective paths for transmitting the through-plane direction phonon modes of graphene, but ineffective for the in-plane modes. Moreover, Varshney46 explained this phenomenon from the molecular dynamic simulations and constructed “pillared-graphene” architecture through combined carbon nanotube (CNT) with graphene in the through-plane direction, which is same with the model constructed (Fig. 7a). The scattering of the through-plane direction phonons occurs at long distances (at the junctions), and thus improving the overall phonon mean-free-path and increasing λz. With the help of hot pressing, the PASC composites formed a ordered layered structure, which can be seen in the Fig. 7g, and the TCE of the through-plane direction exceed its in-plane direction.47,48 It may be caused that the 1- D SiCw filled the gap between the 2-D graphene nanosheets and then formed a good TC channel in the through-plane direction. It is worth pondering that the filler used in this paper has reached 45 wt%. How to use a lower filler to achieve this effect is worthy of future research.
The mechanical properties of the composites
To achieve a better bridge effect to enhance the TC of the PG composites, more fillers (up to 45 wt%) were added into the PA composites.40 High filler loading may result in the loss of mechanical properties of the polymer composites, nonetheless, in this work we achieve a synergistic effect that mechanical properties are enhanced with the TC increase simultaneously, including well bending toughness. Fig. 8 displays Young's modulus (E) and microhardness (H) of the composites by nanoindentation technique, which is widely used to characterize the mechanical behavior of materials at small scales.49 The Young's modulus (E) and microhardness (H) of the PA is 2.43 GPa and 0.134 GPa, respectively, which is similar with the value that we ever reported.41 It can be found that the mechanical properties of the PG composites is a little bit down, which may relate to the decreasing of crystallinity caused by the incorporation of graphene.29 Compared with the PG-2 the Young's modulus and microhardness of the PASC-24 increase from 2.11 to 4.98 GPa and from 0.11 to 0.214 GPa, improvements of 136 and 94.5%, respectively, the bridge effect is significantly. This result can be ascribed that the 1-D SiCw filled the gap between the 2-D graphene nanosheets to prevent the accumulation of graphene and constructed a 3-D structure to resist the pressure.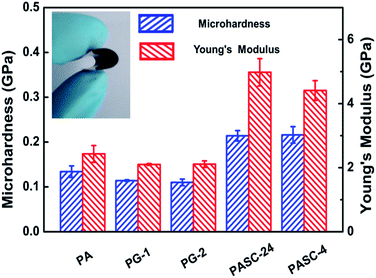 | ||
| Fig. 8 Mechanical properties of Young's modulus and microhardness for the PA composites by nano-indentation technique (insets is the image of bending PASC film). | ||
Conclusion
In this work, we achieve a bridge effect of SiCw on the enhancement of TC in the PG composites. It is a time- and cost-efficient approach to manufacture the PASC composite through the Internal mixer. From the characterization and analysis, a conclusion was acquired that the SiCw could filled the gap between the graphene nanosheets, especially in the through-plane direction to prevent the accumulation of graphene, and a thermally conductive path is constructed in the through-plane direction. The TCE of the through-plane direction can reaches as high as 199%, the maximum can reach 508% related to PA matrix. The value of the TC can reach the need of the electronic application. Meanwhile, the mechanical properties of the composites are synchronously enhanced. Beyond that it has practical value in large quantities of industrial production without use of any organic reagents and catalysts.Conflicts of interest
There are no conflicts to declare.Acknowledgements
This work was financially supported by the Natural Science Foundation of Shanghai (No. 17ZR1440700), the Program of Shanghai Academic/Technology Research Leader (No. 17XD1424400), the PetroChina Innovation Foundation (No. 2016D-5007-0508), the Program of university-industry cooperation of Shanghai Baoshan District (No. bkw2015136). National Natural Science Foundation of China (No. 51703122). The authors thank Prof. Yanyan Lou and Prof. Jie Li for help with the SEM and Micro-mechanical properties measurements.References
- Z. Yan, G. Liu, J. M. Khan and A. A. Balandin, Nat. Commun., 2012, 3, 827 CrossRef PubMed.
- A. Moisala, Q. Li, I. A. Kinloch and A. H. Windle, Compos. Sci. Technol., 2006, 66, 1285–1288 CrossRef CAS.
- F. Monteverde and L. Scatteia, J. Am. Ceram. Soc., 2007, 90, 1130–1138 CrossRef CAS.
- Z. Han and A. Fina, Prog. Polym. Sci., 2011, 36, 914–944 CrossRef CAS.
- H. Chen, V. V. Ginzburg, J. Yang, Y. Yang, W. Liu, Y. Huang, L. Du and B. Chen, Prog. Polym. Sci., 2016, 59, 41–85 CrossRef CAS.
- X. Y. Huang, P. K. Jiang and T. Tanaka, IEEE Electr. Insul. Mag., 2011, 27, 8–16 CrossRef.
- F. Danes, B. Garnier and T. Dupuis, Int. J. Thermophys., 2003, 24, 771–784 CrossRef CAS.
- W.-L. Song, L. M. Veca, C. Y. Kong, S. Ghose, J. W. Connell, P. Wang, L. Cao, Y. Lin, M. J. Meziani, H. Qian, G. E. LeCroy and Y.-P. Sun, Polymer, 2012, 53, 3910–3916 CrossRef CAS.
- G. Droval, J. F. Feller, P. Salagnac and P. Glouannec, e-Polym., 2009, 17 Search PubMed.
- A. K. Geim and K. S. Novoselov, Nat. Mater., 2007, 6, 183–191 CrossRef CAS PubMed.
- K. S. Novoselov, V. I. Fal'ko, L. Colombo, P. R. Gellert, M. G. Schwab and K. Kim, Nature, 2012, 490, 192–200 CrossRef CAS PubMed.
- R. Prasher, Science, 2010, 328, 185–186 CrossRef CAS PubMed.
- A. A. Balandin, S. Ghosh, W. Z. Bao, I. Calizo, D. Teweldebrhan, F. Miao and C. N. Lau, Nano Lett., 2008, 8, 902–907 CrossRef CAS PubMed.
- N. Song, J. Yang, P. Ding, S. Tang and L. Shi, Composites, Part A, 2015, 73, 232–241 CrossRef CAS.
- Y. Fu, L. Liu, J. Zhang and W. C. Hiscox, Polymer, 2014, 55, 6381–6389 CrossRef CAS.
- J. Gu, N. Li, L. Tian, Z. Lv and Q. Zhang, RSC Adv., 2015, 5, 36334–36339 RSC.
- J. Gu, X. Yang, Z. Lv, N. Li, C. Liang and Q. Zhang, Int. J. Heat Mass Transfer, 2016, 92, 15–22 CrossRef CAS.
- W. Park, J. N. Hu, L. A. Jauregui, X. L. Ruan and Y. P. Chen, Appl. Phys. Lett., 2014, 104, 4 Search PubMed.
- X. Tian, M. E. Itkis, E. B. Bekyarova and R. C. Haddon, Sci. Rep., 2013, 3, 1710 CrossRef.
- F.-Y. Yuan, H.-B. Zhang, X. Li, X.-Z. Li and Z.-Z. Yu, Composites, Part A, 2013, 53, 137–144 CrossRef CAS.
- A. Yu, P. Ramesh, X. Sun, E. Bekyarova, M. E. Itkis and R. C. Haddon, Adv. Mater., 2008, 20, 4740–4744 CrossRef CAS.
- S.-Y. Yang, W.-N. Lin, Y.-L. Huang, H.-W. Tien, J.-Y. Wang, C.-C. M. Ma, S.-M. Li and Y.-S. Wang, Carbon, 2011, 49, 793–803 CrossRef CAS.
- M. Shtein, R. Nadiv, M. Buzaglo, K. Kahil and O. Regev, Chem. Mater., 2015, 27, 2100–2106 CrossRef CAS.
- A. C. Ferrari and D. M. Basko, Nat. Nanotechnol., 2013, 8, 235–246 CrossRef CAS PubMed.
- L. M. Malard, M. A. Pimenta, G. Dresselhaus and M. S. Dresselhaus, Phys. Rep., 2009, 473, 51–87 CrossRef CAS.
- L. G. Cancado, A. Jorio, E. H. Martins Ferreira, F. Stavale, C. A. Achete, R. B. Capaz, M. V. O. Moutinho, A. Lombardo, T. S. Kulmala and A. C. Ferrari, Nano Lett., 2011, 11, 3190–3196 CrossRef CAS PubMed.
- N. Song, S. Cui, D. Jiao, X. Hou, P. Ding and L. Shi, Carbon, 2017, 115, 338–346 CrossRef CAS.
- N. Song, D. Jiao, S. Cui, X. Hou, P. Ding and L. Shi, ACS Appl. Mater. Interfaces, 2017, 9, 2924–2932 CAS.
- P. Ding, N. Zhuang, X. Cui, L. Shi, N. Song and S. Tang, J. Mater. Chem. C, 2015, 3, 10990–10997 RSC.
- M. Liu, Y. Song, S. He, W. W. Tjiu, J. Pan, Y. Y. Xia and T. Liu, ACS Appl. Mater. Interfaces, 2014, 6, 4214–4222 CAS.
- C.-C. Teng, C.-C. M. Ma, C.-H. Lu, S.-Y. Yang, S.-H. Lee, M.-C. Hsiao, M.-Y. Yen, K.-C. Chiou and T.-M. Lee, Carbon, 2011, 49, 5107–5116 CrossRef CAS.
- S. H. Song, K. H. Park, B. H. Kim, Y. W. Choi, G. H. Jun, D. J. Lee, B. S. Kong, K. W. Paik and S. Jeon, Adv. Mater., 2013, 25, 732–737 CrossRef CAS PubMed.
- A. A. Balandin, Nat. Mater., 2011, 10, 569–581 CrossRef CAS PubMed.
- V. V. Gobre and A. Tkatchenko, Nat. Commun., 2013, 4, 2341 Search PubMed.
- M. J. Biercuk, M. C. Llaguno, M. Radosavljevic, J. K. Hyun, A. T. Johnson and J. E. Fischer, Appl. Phys. Lett., 2002, 80, 2767–2769 CrossRef CAS.
- P. Ding, S. Su, N. Song, S. Tang, Y. Liu and L. Shi, Carbon, 2014, 66, 576–584 CrossRef CAS.
- P. Ding, J. Zhang, N. Song, S. Tang, Y. Liu and L. Shi, Compos. Sci. Technol., 2015, 109, 25–31 CrossRef CAS.
- W. W. Wu, J. Y. Gui, T. B. Zhu and Z. P. Xie, Ceram. Int., 2016, 42, 16332–16335 CrossRef CAS.
- L. Fang, C. Wu, R. Qian, L. Xie, K. Yang and P. Jiang, RSC Adv., 2014, 4, 21010–21017 RSC.
- S.-L. Zhong, Z.-Y. Zhou, K. Zhang, Y.-D. Shi, Y.-F. Chen, X.-D. Chen, J.-B. Zeng and M. Wang, RSC Adv., 2016, 6, 98571–98580 RSC.
- X. Cui, P. Ding, N. Zhuang, L. Shi, N. Song and S. Tang, ACS Appl. Mater. Interfaces, 2015, 7, 19068–19075 CAS.
- L. Shao, L. Shi, X. Li, N. Song and P. Ding, Compos. Sci. Technol., 2016, 135, 83–91 CrossRef CAS.
- D. Shimamoto, Y. Imai and Y. Hotta, J. Ceram. Soc. Jpn., 2014, 122, 732–735 CrossRef.
- Y. Yoo, H. L. Lee, S. M. Ha, B. K. Jeon, J. C. Won and S.-G. Lee, Polym. Int., 2014, 63, 151–157 CrossRef CAS.
- X. Liu, G. Zhang and Y.-W. Zhang, J. Phys. Chem. C, 2014, 118, 12541–12547 CAS.
- V. Varshney, S. S. Patnaik, A. K. Roy, G. Froudakis and B. L. Farmer, ACS Nano, 2010, 4, 1153–1161 CrossRef CAS PubMed.
- B. Ashrafi, A. M. Díez-Pascual, L. Johnson, M. Genest, S. Hind, Y. Martinez-Rubi, J. M. González-Domínguez, M. Teresa Martínez, B. Simard, M. A. Gómez-Fatou and A. Johnston, Composites, Part A, 2012, 43, 1267–1279 CrossRef CAS.
- A. M. Diez-Pascual and M. Naffakh, ACS Appl. Mater. Interfaces, 2013, 5, 9691–9700 CAS.
- W. C. Oliver and G. M. Pharr, J. Mater. Res., 1992, 7, 1564–1583 CrossRef CAS.
Footnotes |
| † Electronic supplementary information (ESI) available. See DOI: 10.1039/c7ra09094c |
| ‡ These authors contributed equally to this work. |
| This journal is © The Royal Society of Chemistry 2017 |

