
 Open Access Article
 This Open Access Article is licensed under a
 Creative Commons Attribution 3.0 Unported Licence
Detailed molecular movements during poly(L-lactic acid) cold-crystallization investigated by FTIR spectroscopy combined with two-dimensional correlation analysis†
Bai Xuea,
Lan Xie *a and
Junhua Zhang*b
*a and
Junhua Zhang*b
aDepartment of Polymer Materials and Engineering, College of Materials and Metallurgy, Guizhou University, Guiyang 550025, China. E-mail: mm.lanxie@gzu.edu.cn
bThe State Key Laboratory of Polymer Materials Engineering, Polymer Research Institute of Sichuan University, Chengdu 610065, China. E-mail: zhangjh@scu.edu.cn; Fax: +86-28-85402465
First published on 5th October 2017
Abstract
A good understanding of the detailed molecular movements of the poly(L-lactic acid) (PLLA) cold-crystallization is significant for academic investigation and commercial application. In this article, the cold-crystallization process of PLLA was successfully investigated via temperature-dependent FTIR spectroscopy combined with the perturbation correlation moving-window two-dimensional (PCMW2D) spectroscopy and generalized two-dimensional correlation (2D) spectroscopy. PCMW2D reveals that the cold-crystallization of PLLA undergoes two processes: Process I (60.8–73.7 °C) and Process II (91.1–104.0 °C), which is consistent with the results of differential scanning calorimetry (DSC) measurement. The method of estimating the regularization enthalpy of function groups (CH3, C![[double bond, length as m-dash]](https://www.rsc.org/images/entities/char_e001.gif) O, and CCO–O) during both Process I and Process II is established based on van't Hoff plots. The results show that the enthalpy of the regularization of chain segments is decreased with the increasing mobility. The sequential order of the groups' movement in both Process I and Process II is successfully investigated by the generalized 2D correlation analysis, which has great significance for understanding the detailed microdynamics mechanism of the PLLA cold-crystallization. Process I is the relaxation process, which undergoes 2 steps and Process II is the primary cold-crystallization process, which has 5 steps.
O, and CCO–O) during both Process I and Process II is established based on van't Hoff plots. The results show that the enthalpy of the regularization of chain segments is decreased with the increasing mobility. The sequential order of the groups' movement in both Process I and Process II is successfully investigated by the generalized 2D correlation analysis, which has great significance for understanding the detailed microdynamics mechanism of the PLLA cold-crystallization. Process I is the relaxation process, which undergoes 2 steps and Process II is the primary cold-crystallization process, which has 5 steps.
1. Introduction
Depending on different thermal and/or mechanical treatments, PLLA crystals could grow in three modifications (α, β, and γ forms which are characterized by different helix conformations and cell symmetries). The most common polymorph, the α form, obtained from melt- or cold-crystallization, or from the solution-spinning process1 has a left-handed 103 helix chain conformation with the parameters a = 1.06 nm, b = 0.61 nm, and c = 2.88 nm in an orthorhombic unit cell, which was first determined by De Santis and Kovacs.2 Nevertheless, Hoogsteen and coworkers3 detected extra 00l reflections, indicating some deviation of a “pure” 103 helical conformation of PLLA chains. The meridional reflections are attributed to a periodic distortion of the nonintegral helix as a result of the interchain interactions between the methyl groups. Eling et al.4 first determined the β modification of PLLA which developed upon mechanical stretching of α crystalline or from solution-spinning processes at higher drawing temperatures and/or higher hot-draw ratio. A third γ crystal modification of PLLA growing upon epitaxial crystallization on hexamethylbenzene substrate has two antiparallel helices in an orthorhombic unit cell with a = 0.99 nm, b = 0.63 nm, and c = 0.88 nm, which was recently described by Cartier et al.5 Very recently, Zhang and coworkers6–9 proposed that another new crystal modification named α′ form (disorder α form) is likely to be crystallized below 120 °C in PLLA, different from the order α form crystallized at the temperature above 120 °C, which has been confirmed on the basis of infrared spectroscopy and X-ray data.It's well known that Fourier transform infrared spectroscopy (FTIR) is sensitive to the local molecular environment and the conformation of polymer chains. Therefore, FTIR spectroscopy has been widely applied to elucidate structural variations of macromolecules during the melt or crystallization process.10,11 Nevertheless, the spectra of PLLA especially in the region of 1300–1000 cm−1 associated with ester groups are greatly overlapped and the detailed analysis of PLLA FTIR spectra is very difficult to be performed. Generalized 2D correlation spectroscopy first proposed by Noda in 199312 is a powerful and versatile tool to find the subtle spectral changes due to the significant enhancement of the spectral resolution compared with that of the corresponding one-dimensional spectroscopy by spreading highly overlapped spectral peaks along the second dimension. It emphasizes spectral features and probes the sequential order of spectral variables occurring under the influence of a controlled physical variable. Thus, generalized 2D correlation FTIR spectroscopy has gained popularity in investigating the complex physical or chemical transition processes of polymers. Zhang et al.7,8 reported the isothermal crystallization behaviors of PLLA from the glassy and melt states which were investigated via FTIR spectroscopy combined with generalized 2D correlation spectroscopy. The isothermal cold-crystallization was carried out at 78 °C from amorphous state, while the isothermal melt-crystallization was monitored at 150 °C from melt state. Amazingly, significant differences were detected between the spectral changes during the isothermal cold- and melt-crystallization processes of PLLA, which illustrated that different crystal modifications might have been formed.
Moving-window two-dimensional (MW2D) correlation spectroscopy extended from generalized 2D correlation spectroscopy using the data subdivision technique was first proposed by Thomas and Richardson in 2000.13 MW2D correlation spectrum is plotted as a 2D contour map between a spectral variable axis and a perturbation variable axis. In 2006, Morita et al.14 proposed the concept of perturbation-correlation moving-window two-dimensional (PCMW2D) correlation spectroscopy which was based on generalized 2D correlation spectroscopy and MW2D correlation spectroscopy. For PCMW2D correlation spectroscopy, a pair of synchronous and asynchronous contour maps are plotted on a 2D plane defined by the perturbation variable axis (here, temperature) and spectral variable axis (here, wavenumber). The synchronous and asynchronous PCMW2D correlation intensities correspond to the spectral gradient and negative rate of spectral gradient change along the perturbation variable axis, respectively, which results in that the spectral correlation intensity variations along both spectral variable axis and perturbation variable axis can be more easily visualized.
Recently, the isothermal cold-crystallization, isothermal melt-crystallization, crystal modifications, thermal behavior, conformational behavior, glass transition behavior, and crystallization dynamics of PLLA have been widely investigated by FTIR spectroscopy.5–10,15–18 However, the detailed molecular movement during PLLA cold-crystallization process has been rarely reported. In the present study, the cold-crystallization process of PLLA was successfully investigated via the temperature-dependent FTIR spectroscopy combined with PCMW2D correlation spectroscopy and generalized 2D correlation spectroscopy. The regularization enthalpies of the chemical groups during both Process I and Process II were estimated via van't Hoff plots. The detailed molecular movement during the cold-crystallization process was successfully determined by powerful generalized 2D correlation analysis, which was significant for understanding the detail microdynamics mechanism of the PLLA cold-crystallization and optimizing the application of PLLA.
2. Experimental
2.1 Materials
Poly(L-lactic acid) (PLLA) with the trade mark of 4032D used in the present study was obtained from Nature Works LLC (America). PLLA in a pellet form presents a density of 1.24 g cm−3 and molecular mass Mw ≈ 207 kDa. Analytically pure chloroform utilized as the solvent of PLLA was purchased from Chengdu Kelong Chemical Reagent Company (China).2.2 FTIR spectroscopy
The film sample of PLLA for FTIR spectroscopy was obtained by solvent casting from 1 wt% chloroform solution. The film was dried at room temperature for 6 h to evaporate the majority of the solvent and then placed in a vacuum oven at 40 °C for 48 h to completely remove the residual solvent. A Nicolet iS10 FTIR spectrometer equipped with a deuterated triglycine sulfate (DTGS) detector was applied to perform the FTIR measurement. In order to collect FTIR spectra of PLLA with the incremental temperature, the film sample should be put into a homemade variable-temperature cell during the measurement. The PLLA film was heated from 20 °C to 220 °C at a heating rate of 5 °C min. A total of 95 FTIR spectra were recorded from 20 scans with a resolution of 4 cm−1 in the range of 4000–500 cm−1 during the heating process.2.3 Two-dimensional correlation analysis
PCMW2D and generalized 2D correlation FTIR spectroscopies were carried out and plotted by a 2D correlation spectroscopy software (2DCS 4.0), developed by Zhou.19 The intensity of each FTIR spectrum was normalized by dividing the average value of intensity before performing 2D correlation analysis. A window size of 2m + 1 = 11 was chosen for PCMW2D analysis in the calculation. The 5% autocorrelation intensity was regarded as noise and cut off. In both PCMW2D and generalized 2D correlation spectra, the blue areas represent negative correlation intensity, while the pink ones represent positive correlation intensity. The characteristics of the spectral variation along the perturbation variables' direction can be easily observed in the 2D maps, which illustrates that 2D correlation spectroscopies are powerful in finding hidden, weak or overlapped peaks along the spectral direction.202.4 Differential scanning calorimetry
DSC measurement of PLLA film prepared from the solvent-casting method was performed on a differential scanning calorimeter (DSC-204, Netzsch, Germany). The sample of 7–8 mg was placed in an aluminum sample pan. And then the sample was scanned from 20 °C to 220 °C at a heating rate of 5 °C min, under a nitrogen gas flow of 40 ml min−1.3. Results and discussion
PLLA is a semicrystalline biopolymer with a relatively low crystallization rate.9 The FTIR spectral changes of the common PLLA sample without melt-quenching or annealing in the wavenumber regions of 3100–2650 cm−1, 1850–1700 cm−1, 1500–1000 cm−1, and 970–850 cm−1 during the heating process from 20 °C to 220 °C are shown in Fig. 1 and 2. All the four regions of FTIR spectra corresponding to C–H stretching vibration (3100–2800 cm−1), CO stretching vibration (1800–1700 cm−1), CH3, CH bending and C–O–C stretching (1500–1000 cm−1), and the skeletal stretching and CH3 rocking (970–850 cm−1) are very sensitive to the structural changes occurring in the cold-crystallization process. Nevertheless, several characteristic bands are heavily overlapped or relatively very weak, which limits the application of FTIR spectra on the investigation of PLLA melting or crystallization behaviors. PCMW2D correlation spectroscopy is a powerful tool to find the weak, hidden, or overlapped peaks. Moreover, PCMW2D can be easily utilized to determine the temperature regions of polymer transitions.
 | ||
| Fig. 1 The temperature-dependent FTIR spectra of PLLA upon heating from 20 °C to 220 °C, (a) 3100–2600 cm−1 and (b) 1850–1700 cm−1. | ||
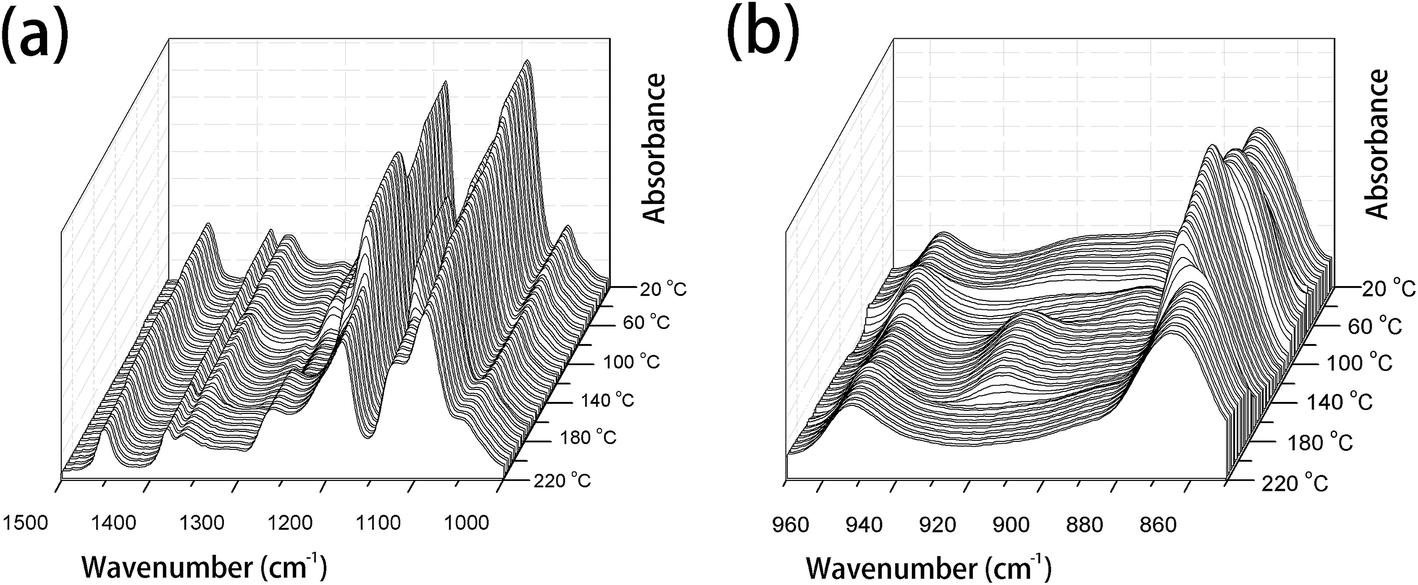 | ||
| Fig. 2 The temperature-dependent FTIR spectra of PLLA upon heating from 20 °C to 220 °C, (a) 1500–1000 cm−1 and (b) 970–850 cm−1. | ||
3.1 Temperature regions determined by PCMW2D and DSC
Fig. 3 illustrates the PCMW2D correlation FTIR spectra of PLLA in the wavenumber region of 1899–1650 cm−1, calculated from the spectra in Fig. 1. The PCMW2D correlation FTIR spectra of PLLA in the regions of 3099–2850 cm−1, 1549–1300 cm−1, 1301–1052 cm−1, and 996–850 cm−1 are shown in Fig. S1 and S2.† PCMW2D spectra consist of synchronous (on the top) and asynchronous (on the bottom) correlation spectra. The pink areas represent positive correlation intensity and on the contrary, the blue areas represent negative correlation intensity. In the synchronous correlation spectra, the positive correlation intensity reveals the increasing of the absorbance intensity at a given wavenumber in the temperature-dependent FTIR spectra, and vice versa.21 For the synchronous spectra in all the wavenumber regions, the correlation bands are mainly observed in three temperature regions which are defined as Process I, Process II, and Process III. Process I is centered at 69.5 °C (slightly higher than the glass-transition temperature (Tg)), Process II is observed at 99.6 °C (the cold-crystallization temperature (Tcc)), and Process III is centered at 168.5 °C (the melting temperature (Tm)). In this article, we focus our interests on the cold-crystallization of PLLA (Process I and Process II). | ||
| Fig. 3 PCMW2D correlation FTIR spectra of PLLA in the region of 1899–1650 cm−1 calculated from the temperature-dependent spectroscopy. The blue areas represent negative correlation intensity and the pink areas represent positive correlation intensity. | ||
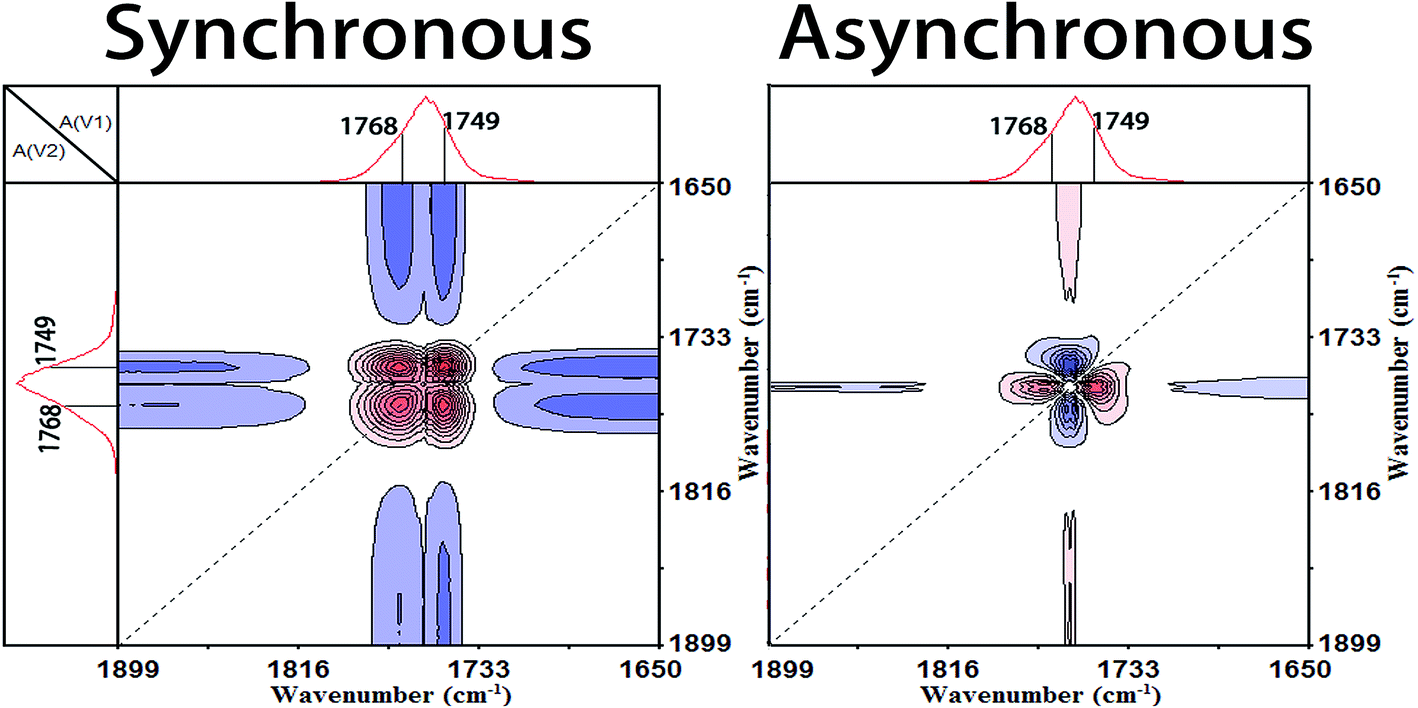
O stretching bands of 1790–1730 cm−1 show two positive correlation peaks at 1768 cm−1 and 1749 cm−1 which have been assigned to tg (51) and tt (21) conformers in the interphase by Sarasua et al.24 The crystalline phase, the interphase, and the amorphous phase are three phases discerned in the switchboard crystallization pattern, according to traditional crystallization theories. The interphase is considered as a transition phase between crystalline and amorphous phases and it is a metastable state with a typical thickness of 1–2 nm.24 The interphase of PLLA is largely increased with the incremental temperature in Process I.No obvious correlation peaks are observed in the synchronous spectrum in the wavenumber region of 1300–1000 cm−1, which is mainly corresponding to the stretching vibration of C–O–C backbone and rocking of CH3. The most probable reason is that the mobility of the polymer backbone is much lower than that of side groups and the relaxation of backbone is much slower. Therefore the structural change of the PLLA backbone is very slight with the increasing temperature in Process I. The asynchronous spectra could be easily applied to determine the temperature regions of polymer transitions.21,25 As shown in Fig. 3, the temperature region of Process I for all the characteristic PLLA bands is accurately determined within 60.8–73.7 °C.
| FTIR wavenumber (cm−1) | Assignments | Explanations | |
|---|---|---|---|
| Process I | Process II | ||
| a “{” represents the band splitting, “↑” represents the intensity of the band increases with the increasing temperature, “↓” represents the intensity of the band decreases with the increasing temperature. | |||
| 2995↑ | {3005↑, {2990↓ | νas(CH3) | |
| {1768↑, {1749↑ | {1782↓, {1760↑, {1749↓ | ν(CO) |
1782 cm−1 corresponds to gg interphase, 1768 cm−1 is attributed to tg interphase, 1760 cm−1 is ascribed to gt crystalline and gt interphase, 1749 cm−1 is assigned to tt interphase |
| 1454↑ | {1458↑, {1442↑ | δas(CH3) | |
| 1384↑ | {1389↑, {1379↓ | δs(CH3) | |
| 1362↑ | {1368↑, {1359↑ | δs(CH3) + δ(CH) | The coupling of CH3 symmetric bending with the CH bending |
| 1212 | {1214↑, {1193↑ | νas(CCO–O) + ras(CH3) | The coupling of C–O–C stretching with the CH3 rocking |
| 865↑ | {871↑, {860↓ | ν(C–COO) | 871 cm−1 band is also sensitive to the 103 helix conformation |
To further determine the temperature regions of PLLA heating process, differential scanning calorimetry (DSC) measurement was carried out with the PLLA film sample obtained via solution casting. The heating DSC curve is shown in Fig. 4. An endothermic peak is observed at 61.8 °C near the glass-transition temperature (Tg = 53.4 °C) because of physical aging of the polymer materials.27 There are chain segment relaxations for both the regular helical conformation and the irregular chain conformation. When the PLLA sample is reheated above Tg, chain segments are active enough to adjust themselves for reaching the more stable and regular conformation.
 | ||
| Fig. 4 DSC curve of PLLA upon heating at a heating rate of 5 °C min−1. | ||
The characteristic data of PLLA, including the glass-transition temperature (Tg), the relaxation temperature (Tr), the cold-crystallization temperature (Tcc), the α′-to-α phase transition temperature (Tα′–α), the melting temperature (Tm), and the temperature regions of Process I and Process II obtained by PCMW2D and DSC, respectively, are listed in Table 2. The results obtained from these two methods are obviously different. The most probable reasons are as follows: (1) DSC technique measures the heat flow during the heating process of PLLA, responding to the long-range chain structure, whereas the FTIR spectroscopy is sensitive to local molecular environment presenting the vibration of short-range structure.6,8,17 (2) The heating systems control precisions in DSC and FTIR heating cell are quite different, and temperature registered in FTIR cell may lag behind the controller's reading. Although the definite reason is very complicated and ambiguous, there's no doubt that the result difference origins from the different measurement method.
| Tg (°C) | Tr (°C) | Tcc (°C) | Tα′–α (°C) | Tm (°C) | Process I (°C) | Process II (°C) | |
|---|---|---|---|---|---|---|---|
| PCMW2D | — | 69.5 | 99.6 | 146.8 | 168.5 | 60.8–73.7 | 91.1–104.0 |
| DSC | 53.4 | 61.8 | 99.4 | 152.5 | 168.3 | 57.1–70.8 | 89.1–110.7 |
3.2 Enthalpy of the regularization of CH3, C![[double bond, length as m-dash]](https://www.rsc.org/images/entities/h3_char_e001.gif) O, and CCO–O groups
O, and CCO–O groups
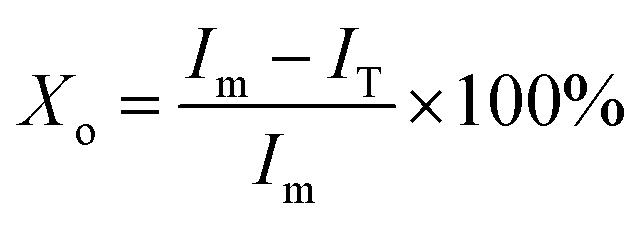
The bands of 921 cm−1 and 955 cm−1 are well separated in the FTIR spectra (Fig. 2), therefore, these two bands are possible to quantitatively determine the crystallinity of PLLA.11,15 Sarasua et al.11 reported that the PLLA crystallinity was easily calculated from the percent area loss of the band at 955 cm−1. In this paper, the modified formula is shown as follows:
 | (1) |
Fig. 5(a) and (b) show the intensity of the band at 955 cm−1 and the ordering degree as a function of temperature, respectively. It is clearly observed that the ordering degree is decreasing with the increasing temperature below 60.4 °C, which is mainly ascribed to the temperature effect. The first abrupt increase of the ordering degree is observed in the temperature region of 60.8–77.3 °C, corresponding to Process I. The most probable reason is that the relaxation of chain segments is largely accelerated and the mobility is increased above Tg. Polymer chain segments are active enough to adjust themselves for reaching the more stable interphase whose ordering degree is much higher than that of amorphous phase. The second abrupt increase is shown in the temperature range from 90.1 to 104.0 °C, corresponding to Process II. The ordering degree with the highest value of 40.6% is obtained at 104.0 °C. During this temperature region, PLLA is rapidly cold-crystallized, therefore, the ordering degree of PLLA is largely increased. A large decrease of ordering degree is presented in the temperature region of 162.3–177.2 °C, corresponding to the melting process of PLLA. The ordering degree continuously decreases above 177.2 °C due to the temperature effect.
 | ||
| Fig. 5 (a) Intensity of the band at 955 cm−1 as a function of temperature, (b) the ordering degree of PLLA calculated from the band at 955 cm−1 as a function of temperature. | ||
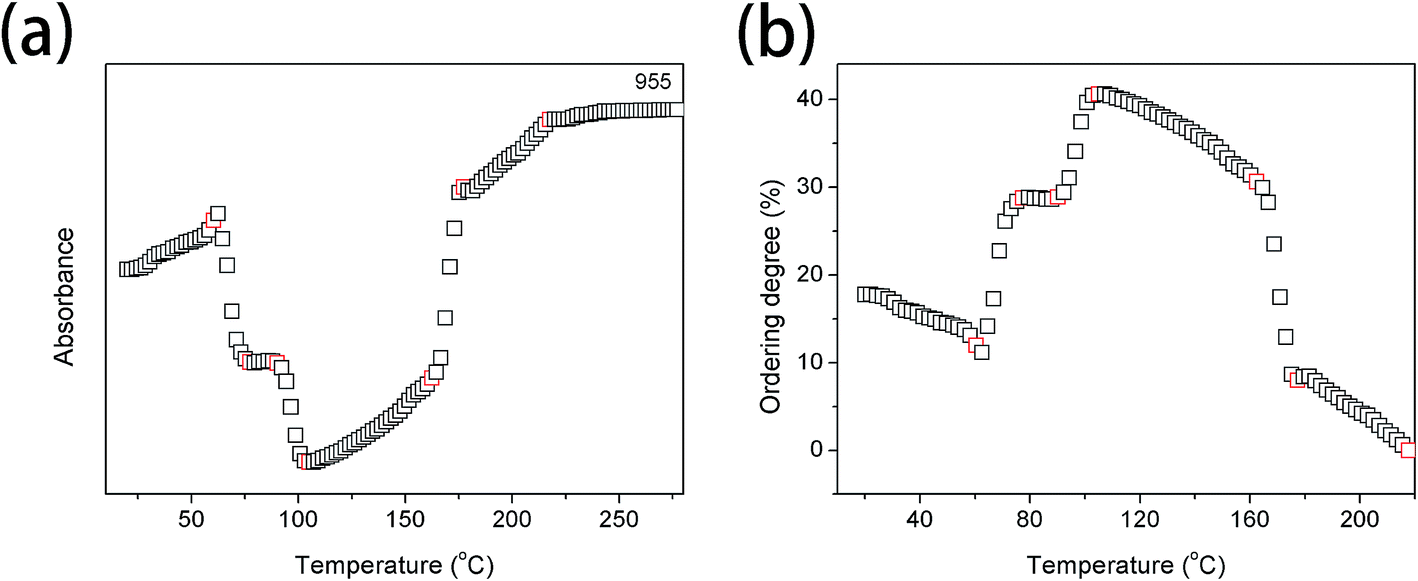
As shown in Fig. 6, the intensities of the bands at 1760, 1458, 1193, and 1133 cm−1, which are ascribed to ν(CO), δas(CH3), νas(CCO–O) + ras(CH3), and rs(CH3), respectively, increase with the incremental temperature during the PLLA primary cold-crystallization process (Process II, 91.1–104.0 °C). These bands have been previously assigned to crystalline sensitive bands.6–8,15 However, the intensities of these bands also increase with the incremental temperature during the relaxation process (Process I, 60.8–73.7 °C). Another band at 921 cm−1, which is also increased during the cold-crystallization process, has been successfully assigned to the 103 helical chain conformation existing in both the crystalline and amorphous phase.9,11,24 Therefore, the bands at 1760, 1458, 1193, and 1133 cm−1 are more rational to be determined as regular conformation sensitive bands rather than crystalline sensitive bands. The ordering degree of function groups (CO, CH3, and CCO–O) is largely increased with the increasing temperature in both Process I and Process II. The enthalpy of the regularization of these groups can be calculated according to the intensity of the characteristic FTIR bands.
 | ||
| Fig. 6 Intensities of the bands at 1760 cm−1, 1458 cm−1, 1193 cm−1, 1133 cm−1, and 921 cm−1 as a function of temperature. | ||
The regularization of groups in PLLA chains can be considered as an equilibrium reaction, which is expressed as follows:
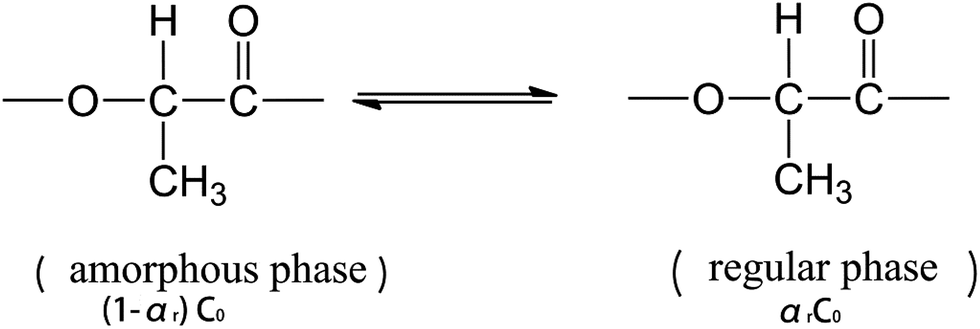 | (2) |
 | (3) |
According to the Beer–Lambert law,28 the relationship between absorbance A and the molar concentration C can be expressed as the following equations:
| A0 = εLC0 | (4) |
| A104 = εLC104 | (5) |
| Ar = εLCr | (6) |
The molar fraction of the regular chemical groups (αr) can be calculated from the equation:
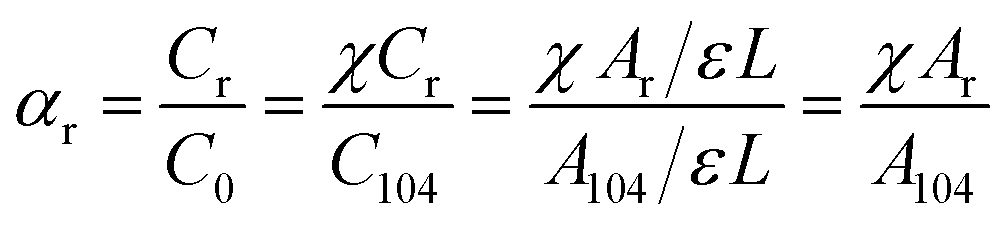 | (7) |
The molar fraction of the amorphous chemical groups (αa) can be expressed as:
| αa = 1 − αr | (8) |
The equilibrium constant (K) can be expressed as:
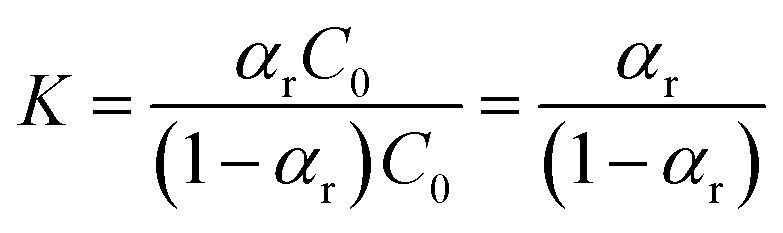 | (9) |
Eqn (9) can be transformed into the van't Hoff form:
 | (10) |
Therefore, a straight line can be fitted from the plot between 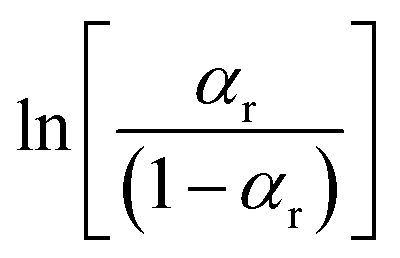 and 1/T using the line fitting. The regularization enthalpy of chemical groups could be easily estimated from the slope of the fitting line.
van't Hoff plots obtained from the temperature-dependent FTIR spectra are presented in Fig. 7. It is clearly seen that two straight lines which are rapidly decreased with the increasing value of 1/T can be commendably fitted for each van't Hoff plot. These two decreasing lines are observed in the 1/T regions of 2.65 × 10⁻³–2.75 × 10⁻³ and 2.89 × 10⁻³–2.98 × 10⁻³, corresponding to Process II and Process I, respectively. The estimated regularization enthalpies of chemical groups in Process I and II are presented in Table 3. For the regularization of the chemical groups, an endothermic process is determined owing to the positive value of the obtained enthalpy. Thus, the larger absolute value of the enthalpy indicates the more difficulty of the chemical groups regularization.
 | ||
| Fig. 7 van't Hoff plots from the temperature-dependent FTIR spectra of PLLA, calculating from the absorbance change at (a) 1133 cm−1, (b) 1193 cm−1, (c) 1458 cm−1 and (d) 1760 cm−1. | ||
| Wavenumber (cm−1) | Assignments | Enthalpy of the regularization (kJ mol−1) | |
|---|---|---|---|
| Process I | Process II | ||
| 1133 | rs(CH3) | 17.4 ± 2.0 | 27.8 ± 3.1 |
| 1193 | νas(CCO–O) + rs(CH3) | 23.4 ± 1.8 | 52.9 ± 5.2 |
| 1458 | δas(CH3) | 16.8 ± 1.7 | 27.4 ± 1.6 |
| 1760 | ν(CO) |
21.8 ± 1.8 | 29.0 ± 2.0 |
During both Process I and Process II, the regularization enthalpies of CH3 group calculated from the band at 1133 cm−1 are approximately equal to the CH3 enthalpies estimated from the band at 1458 cm−1. The enthalpies of CO regularization are 21.8 ± 1.8 kJ mol−1 in Process I and 29.0 ± 2.0 kJ mol−1 in Process II, which are both larger than those of CH3 regularization. However, the regularization enthalpies of CCO–O combined with CH3 increase to the values of 23.4 ± 1.8 kJ mol−1 in Process I and 52.9 ± 5.2 kJ mol−1 in Process II. This illustrates that CO groups can much more easily form the regular phase than CCO–O groups. Nevertheless, the regularization of CO is more difficult than that of CH3, which is corresponding to the mobility sequence at the same temperature: CH3 > CO > CCO–O. The regularization enthalpy of chemical groups is decreased with their increasing mobility. Moreover, for all the functional groups, the regularization enthalpy is increased from Process I to Process II. The most probable reason is that the relaxation of chain segments mainly occurs in Process I and the cold-crystallization takes place in Process II. The perfection extent of the regular phase in primary cold-crystallization process (Process II) is largely higher than that in the relaxation process (Process I). Thus, the ordered arrangement of chemical groups in Process II needs more energy to reach the stable conformation.
3.3 Generalized 2D correlation analysis
In order to capture a detailed mechanism from the molecular movements, the temperature-dependent FTIR spectra within Process I (60.8–73.7 °C) and Process II (91.1–104.0 °C) were applied to carry out the generalized 2D correlation analysis. The sequential order of the spectral intensity at a certain wavenumber can be easily determined by the sign of the correlation peaks, according to Noda's rule:12,29(1) If Φ(ν1, ν2) < 0, Ψ(ν1, ν2) < 0 or Φ(ν1, ν2) > 0, Ψ(ν1, ν2) > 0, then the movement of ν1 is before that of ν2.
(2) If Φ(ν1, ν2) < 0, Ψ(ν1, ν2) > 0 or Φ(ν1, ν2) > 0, Ψ(ν1, ν2) < 0, then the movement of ν2 is before that of ν1.
(3) If Φ(ν1, ν2) < 0 or Φ(ν1, ν2) > 0, Ψ(ν1, ν2) = 0, the movements of ν1 and ν2 are simultaneous.where Φ(ν1, ν2) is the synchronous intensity and Ψ(ν1, ν2) is the asynchronous intensity.
O)↑ > ν(C–COO)↑ > δas(CH3)↑ = δs(CH3)↑ > νas(CCO–O) + ras(CH3)↑ > νas(O–CCO)↑ > δs(CH3) + δ(CH)↑.
 | ||
| Fig. 8 Synchronous (left) and asynchronous (right) 2D correlation FTIR spectra calculated from the temperature-dependent spectra of Process I (60.8–73.7 °C) in the region 1899–1650 cm−1 vs. 1899–1650 cm−1. | ||
| Cross correlation peak (cm−1) | Sign in synchronous spectra | Sign in asynchronous spectra | Sequential order | Cross correlation peak (cm−1) | Sign in synchronous spectra | Sign in asynchronous spectra | Sequential order |
|---|---|---|---|---|---|---|---|
| a “↑” represents the intensity of the band increases with the increasing temperature, “↓” represents the intensity of the band decreases with the increasing temperature. “>” represents “before”, “<” represents “after” and “=” represents “with”. Both 955 cm−1 and 921 cm−1 corresponds to νas (CCO–O) + ras(CH3). The bonds CCO–O and O–CCO represent the C–O (ester) and Cα–O modes, respectively. | |||||||
| (1768, 1454) | + | + | 1768 > 1454 | (1384, 868) | − | + | 1384 < 868 |
| (1768, 1384) | + | + | 1768 > 1384 | (1364, 1266) | + | − | 1364 < 1266 |
| (1768, 1364) | + | + | 1768 > 1364 | (1364, 1182) | + | − | 1364 < 1182 |
| (1768, 1266) | + | − | 1768 < 1266 | (1364, 1095) | + | − | 1364 < 1095 |
| (1768, 1182) | + | + | 1768 > 1182 | (1364, 955) | − | + | 1364 < 955 |
| (1768, 1095) | + | + | 1768 > 1095 | (1364, 921) | − | + | 1364 < 921 |
| (1768, 955) | − | + | 1768 < 955 | (1364, 868) | − | + | 1364 < 868 |
| (1768, 921) | − | + | 1768 < 921 | (1266, 1182) | − | − | 1266 > 1182 |
| (1768, 868) | − | − | 1768 > 868 | (1266, 1095) | − | − | 1266 > 1095 |
| (1454, 1384) | + | 0 | 1454 = 1384 | (1266, 955) | − | 0 | 1266 = 955 |
| (1454, 1364) | + | + | 1454 > 1364 | (1266, 921) | − | 0 | 1266 = 921 |
| (1454, 1266) | + | − | 1454 < 1266 | (1266, 868) | − | − | 1266 > 868 |
| (1454, 1182) | + | + | 1454 > 1182 | (1182, 1095) | + | + | 1182 > 1095 |
| (1454, 1095) | + | + | 1454 > 1095 | (1182, 955) | − | + | 1182 < 955 |
| (1454, 955) | − | + | 1454 < 955 | (1182, 921) | − | + | 1182 < 921 |
| (1454, 921) | − | + | 1454 < 921 | (1182, 868) | − | + | 1182 < 868 |
| (1454, 868) | − | + | 1454 < 868 | (1095, 955) | − | + | 1095 < 955 |
| (1384, 1364) | + | + | 1384 > 1364 | (1095, 921) | − | + | 1095 < 921 |
| (1384, 1266) | + | − | 1384 < 1266 | (1095, 868) | − | + | 1095 < 868 |
| (1384, 1182) | + | + | 1382 > 1182 | (955, 921) | 0 | 0 | 955 = 921 |
| (1384, 1095) | + | + | 1384 > 1095 | (955, 868) | + | + | 955 > 868 |
| (1384, 955) | − | + | 1384 < 955 | (921, 868) | − | − | 921 > 868 |
| (1384, 921) | − | + | 1384 < 921 | ||||
| 1266↓ = 921↓ = 955↓ > 1768↑ > 868↑ > 1454↑ = 1384↑ > 1182↑ > 1095↑ > 1364↑ | |||||||
| νas(CCO–O) + δ(CH)↓ = r(CH3) + ν(C–C)↓ > ν(CO)↑ > ν(C–COO)↑ > δas(CH3)↑ = δs(CH3)↑ > νas(CCO–O) + ras(CH3)↑ > νas(O–CCO)↑ > δs(CH3) + δ(CH)↑ |
|||||||
The band of 1266 cm−1 has been assigned to the νas(CCO–O) + δ(CH) vibration mode of the less energy-favorable gg conformer of PLLA, which is sensitive to the amorphous PLLA phase.30,31 Firstly, the random packed 103 helical chains frozen in the glassy state are relaxed in Process I. And at the same time, the ester and methyne groups existing in the amorphous phase are decreased, which indicates that the disordered chains begin to move and rearrange. The second step is the regularization of polymer chains during Process I. In the regularization process, the first molecular movement is CO groups because of the strong polarity and intense interaction with other polar groups.32,33 And then the movement of C–C backbones takes place. Thirdly, the side methyl groups regularly arrange because of the higher mobility.
Subsequently, the macromolecular motion of the regularization is the ester groups (CO–O). Zhang et al.6–9 and Kister et al.10 have assigned the bands at about 1182 cm−1 and 1095 cm−1 to νas(C–O–C) and νs(C–O–C), respectively. However, the ester CO–O–C bonds in ester compounds are in resonance with CO groups and the two C–O bonds are no longer identical. Thus, Sarasua et al.11,24,26 have referred the bands as the two asymmetrical coupled vibrations: CCO–O (ester) and O–CCO (Cα–O) modes. According to the generalized 2D correlation analysis, the changes of the bands at 1182 cm−1 and 1095 cm−1 are asynchronous which demonstrates that the two C–O bonds in ester are different with each other. So in this paper, we referred the 1182 cm−1 and 1095 cm−1 as the CCO–O (ester) and O–CCO (Cα–O) modes, respectively, following the results of Sarasua. Finally, the order formation of methyne (CH) is built and the regularization of the whole chain is completed in Process I.
O)↓ > νas(CCO–O) + ras(CH3)↑ > ν(CO)↑ > νas(O–CCO)↑ > δs(CH3)↓ > νas(CCO–O) + δ(CH)↓ = r(CH3) + ν(C–C)↑ = r(CH3) + ν(C–C)↓ > δs(CH3) + δ(CH)↑ > ν(C–COO)↑ > δas(CH3)↑ = δs(CH3)↑.
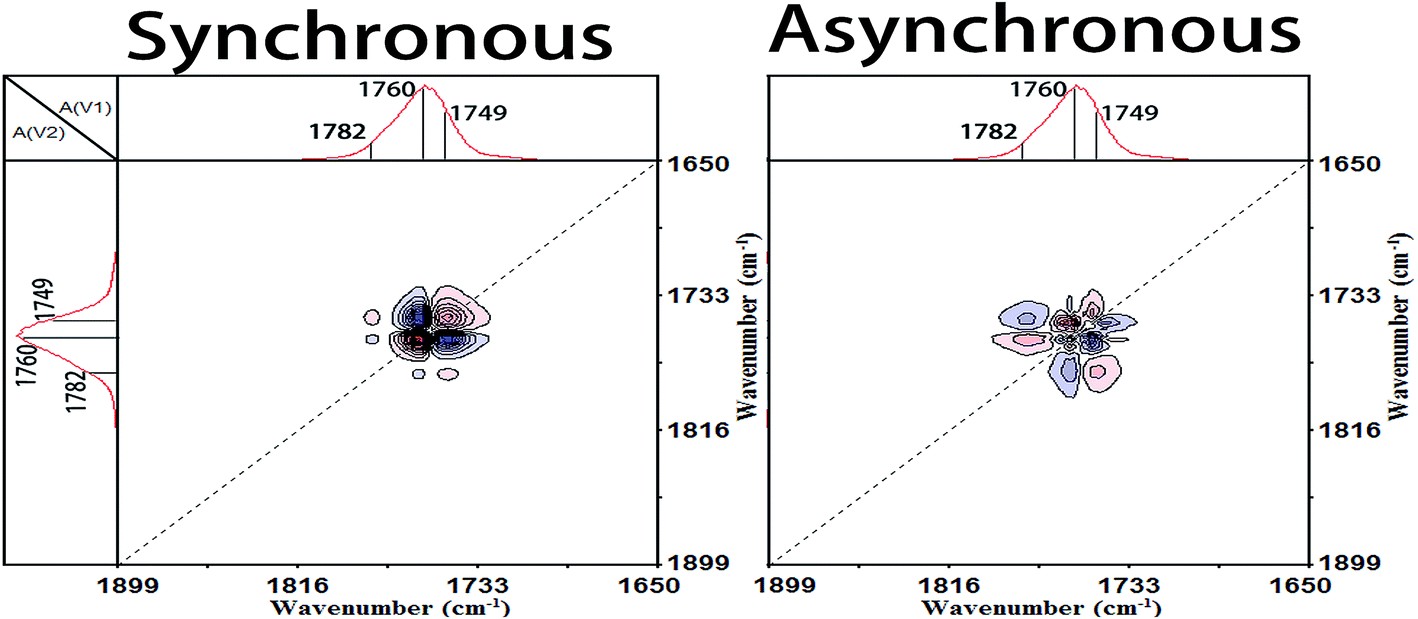 | ||
| Fig. 9 Synchronous (left) and asynchronous (right) 2D correlation FTIR spectra calculated from the temperature-dependent spectra of Process II (91.1–104.0 °C) in the region 1899–1650 cm−1 vs. 1899–1650 cm−1. | ||
| Cross correlation peak (cm−1) | Sign in synchronous spectra | Sign in asynchronous spectra | Sequential order | Cross correlation peak (cm−1) | Sign in synchronous spectra | Sign in asynchronous spectra | Sequential order |
|---|---|---|---|---|---|---|---|
| (1760, 1749) | − | + | 1760 < 1749 | (1389, 955) | − | + | 1389 < 955 |
| (1760, 1458) | + | + | 1760 > 1458 | (1389, 921) | − | + | 1389 < 921 |
| (1760, 1389) | + | + | 1760 > 1389 | (1389, 871) | − | + | 1389 < 871 |
| (1760, 1379) | − | − | 1760 > 1379 | (1379, 1359) | − | − | 1379 > 1359 |
| (1760, 1359) | + | + | 1760 > 1359 | (1379, 1266) | + | + | 1379 > 1266 |
| (1760, 1266) | − | − | 1760 > 1266 | (1379, 1193) | − | + | 1379 < 1193 |
| (1760, 1193) | + | − | 1760 < 1193 | (1379, 1109) | − | + | 1379 < 1109 |
| (1760, 1109) | + | + | 1760 > 1109 | (1379, 1088) | + | − | 1379 < 1088 |
| (1760, 1088) | − | + | 1760 < 1088 | (1379, 955) | + | + | 1379 > 955 |
| (1760, 955) | − | − | 1760 > 955 | (1379, 921) | − | − | 1379 > 921 |
| (1760, 921) | + | + | 1760 > 921 | (1379, 871) | − | − | 1379 > 871 |
| (1760, 871) | + | + | 1760 > 871 | (1359, 1266) | − | + | 1359 < 1266 |
| (1749, 1458) | − | − | 1749 > 1458 | (1359, 1193) | + | − | 1359 < 1193 |
| (1749, 1389) | − | − | 1749 > 1389 | (1359, 1109) | + | − | 1359 < 1109 |
| (1749, 1379) | + | + | 1749 > 1379 | (1359, 1088) | − | + | 1359 < 1088 |
| (1749, 1359) | − | − | 1749 > 1359 | (1359, 955) | − | + | 1359 < 955 |
| (1749, 1266) | + | + | 1749 > 1266 | (1359, 921) | + | − | 1359 < 921 |
| (1749, 1193) | − | − | 1749 > 1193 | (1359, 871) | + | + | 1359 > 871 |
| (1749, 1109) | − | − | 1749 > 1109 | (1266, 1193) | − | + | 1266 < 1193 |
| (1749, 1088) | + | − | 1749 < 1088 | (1266, 1109) | − | + | 1266 < 1109 |
| (1749, 955) | + | + | 1749 > 955 | (1266, 1088) | + | − | 1266 < 1088 |
| (1749, 921) | − | − | 1749 > 921 | (1266, 955) | + | 0 | 1266 = 955 |
| (1749, 871) | − | − | 1749 > 871 | (1266, 921) | − | 0 | 1266 = 921 |
| (1458, 1389) | + | 0 | 1458 = 1389 | (1266, 871) | − | − | 1266 > 871 |
| (1458, 1379) | − | + | 1458 < 1379 | (1193, 1109) | + | + | 1193 > 1109 |
| (1458, 1359) | + | − | 1458 < 1359 | (1193, 1088) | − | + | 1193 < 1088 |
| (1458, 1266) | − | + | 1458 < 1266 | (1193, 955) | − | − | 1193 > 955 |
| (1458, 1193) | + | − | 1458 < 1193 | (1193, 921) | + | + | 1193 > 921 |
| (1458, 1109) | + | − | 1458 < 1109 | (1193, 871) | + | + | 1193 > 871 |
| (1458, 1088) | − | + | 1458 < 1088 | (1109, 1088) | − | + | 1109 < 1088 |
| (1458, 955) | − | + | 1458 < 955 | (1109, 955) | − | − | 1109 > 955 |
| (1458, 921) | + | − | 1458 < 921 | (1109, 921) | + | + | 1109 > 921 |
| (1458, 871) | + | − | 1458 < 871 | (1109, 871) | + | + | 1109 > 871 |
| (1389, 1379) | − | + | 1389 < 1379 | (1088, 955) | + | + | 1088 > 955 |
| (1389, 1359) | + | − | 1389 < 1359 | (1088, 921) | − | − | 1088 > 921 |
| (1389, 1266) | − | + | 1389 < 1266 | (1088, 871) | − | − | 1088 > 871 |
| (1389, 1193) | + | − | 1389 < 1193 | (955, 921) | − | 0 | 955 = 921 |
| (1389, 1109) | − | + | 1389 < 1109 | (955, 871) | − | − | 955 > 871 |
| (1389, 1088) | − | + | 1389 < 1088 | (921, 871) | + | + | 921 > 871 |
| 1088↓ > 1749↓ > 1193↑ > 1760↑ > 1109↑ > 1379↓ > 1266↓ = 921↑ = 955↓ > 1359↑ > 871↑ > 1458↑ = 1389↑ | |||||||
| νas(O–CCO)↓ > ν(CO)↓ > νas(CCO–O) + ras(CH3)↑ > ν(CO)↑ > νas(O–CCO)↑ > δs(CH3)↓ > νas(CCO–O) + δ(CH)↓ = r(CH3) + ν(C–C)↑ = r(CH3) + ν(C–C)↓ > δs(CH3) + δ(CH)↑ > ν(C–COO)↑ > δas(CH3)↑ = δs(CH3)↑ |
|||||||
In the cold-crystallization (Process II), the first step of the molecular movement is the O–CCO (Cα–O) and CO groups in the amorphous phase or interphase.7,11,34,35 The two groups existing in the irregular polymer conformations are largely decreased and the movement of O–CCO groups is prior to that of CO groups. Then, the ester groups (CO–O–C) are regularly rearranged. The sequential order of the ester regularization is CCO–O (ester) groups before carbonyl groups before O–CCO (Cα–O) groups. Thirdly, the amorphous methyl groups (CH3) begin to diffuse into the regular phase and the CH3 groups among different PLLA chains are in close contact.6 Fourthly, the CCO–O groups combined with CH groups sensitive to the amorphous phase are heavily decreased. And simultaneously, large numbers of 103 helical chains which are the major component of PLLA α crystals are formed. This demonstrates that the crystallization degree of PLLA is rapidly increased in this primary cold-crystallization process. The final step is the perfection process of 103 helical chains. The CH groups, C–C backbones, and CH3 groups locating in the 103 helical chains are orderly rearranged to build the more perfect 103 helical chains and crystals.
4. Conclusion
In this paper, the temperature-dependent FTIR spectroscopy combined with the perturbation correlation moving-window two-dimensional (PCMW2D) spectroscopy and generalized two-dimensional correlation (2D) spectroscopy was applied to investigate the cold-crystallization process of poly(L-lactic acid) (PLLA). Two temperature regions of 60.8–73.7 °C and 91.1–104.0 °C are detected via the combination of PCMW2D and differential scanning calorimetry (DSC) measurements. These two temperature regions are defined as Process I (the relaxation process) and Process II (the primary cold-crystallization process), respectively. As FTIR spectroscopy is sensitive to local molecular environment presenting the vibration of short-range structure, the bands at 1760, 1458, 1193, and 1133 cm−1 previously assigned to crystalline sensitive bands are proposed to be regular conformation sensitive bands, like the band of 921 cm−1. Therefore, the intensity of the bands directly reveals the ordering degree of PLLA rather than the crystalline degree. The regularization enthalpy of the PLLA function groups is calculated from van't Hoff plots. During both Process I and Process II, the regularization enthalpy of CO is higher than that of CH3 groups, however, lower than that of CCO–O groups. This illustrates that the regularization enthalpy of chemical groups is decreased with their increasing mobility. Furthermore, the regularization enthalpy of all the chemical groups in Process II is much larger than that in Process I. Powerful generalized 2D correlation analysis was applied to study the sequential order of the movement of the chain segments during the cold-crystallization process. It was found that Process I undergoes 2 steps and Process II undergoes 5 steps. For Process I, the first step is the relaxation of the random packed 103 helical chains frozen in the glassy state and the decrease of the amorphous ester and methyne groups. The second step is the regularization of polymer chains. The sequential order of group movements in the regularization process is ν(CO)↑ > ν(C–COO)↑ > δas(CH3)↑ = δs(CH3)↑ > νas(CCO–O) + ras(CH3)↑ > νas(O–CCO)↑ > δs(CH3) + δ(CH)↑. The changes of the bands at 1182 cm−1 and 1095 cm−1 are asynchronous which demonstrates that the 1182 cm−1 and 1095 cm−1 correspond to the CCO–O (ester) and O–CCO (Cα–O) modes, respectively. For Process II, the first step is the decrease of the amorphous O–CCO (Cα–O) and CO groups. The second step is rearrangement of the ester groups. The third step is the close contact of CH3 groups among different PLLA chains. The fourth step is the formation of 103 helical chains and the fifth step is the perfection process.
Conflicts of interest
There are no conflicts of interest to declare.References
- D. Lorenzo, Eur. Polym. J., 2005, 41, 569–575 CrossRef
.
- P. De Santis and A. J. Kovacs, Biopolymers, 1968, 6, 229–306 CrossRef PubMed
- W. Hoogsteen, A. R. Postema, A. J. Pennings, G. T. Brinke and P. Zugenmaier, Macromolecules, 1990, 23, 634–642 CrossRef CAS
- B. Eling, S. Gogolewski and A. J. Pennings, Polymer, 1982, 23, 1587–1593 CrossRef CAS
- L. Cartier, T. Okihara, Y. Ikada, H. Tsuji, J. Puiggali and B. Lotz, Polymer, 2000, 41, 8909–8919 CrossRef CAS
- J. Zhang, H. Tsuji, I. Noda and Y. Ozaki, J. Phys. Chem. B, 2004, 108, 11514–11520 CrossRef CAS
- J. Zhang, H. Tsuji, I. Noda and Y. Ozaki, Macromolecules, 2004, 37, 6433–6439 CrossRef CAS
- J. Zhang, Y. Duan, H. Sato, H. Tsuji, I. Noda, S. Yan and Y. Ozaki, Macromolecules, 2005, 38, 8012–8021 CrossRef CAS
- J. Zhang, C. Li, Y. Duan, A. J. Domb and Y. Ozaki, Vib. Spectrosc., 2010, 53, 307–310 CrossRef CAS
- G. Kister, G. Cassanas and M. Vert, Polymer, 1998, 39, 267–273 CrossRef CAS
- E. Meaurio, N. Lopez-Rodriguez and J. R. Sarasua, Macromolecules, 2006, 39, 9291–9301 CrossRef CAS
- I. Noda, Appl. Spectrosc., 1993, 47, 1329–1336 CrossRef CAS
- M. Thomas and H. H. Richardson, Vib. Spectrosc., 2000, 24, 137–146 CrossRef CAS
- S. Morita, H. Shinzawa, I. Noda and Y. Ozaki, Appl. Spectrosc., 2006, 60, 398–406 CrossRef CAS PubMed
- J. Zhang, H. Sato, H. Tsuji, I. Noda and Y. Ozaki, Macromolecules, 2005, 38, 1822–1828 CrossRef CAS
- J. Zhang, Y. Duan, A. J. Domb and Y. Ozaki, Macromolecules, 2010, 43, 4240–4246 CrossRef CAS
- J. Zhang, K. Tashiro, H. Tsuji and A. J. Domb, Macromolecules, 2008, 41, 1352–1357 CrossRef CAS
- K. Wasanasuk and K. Tashiro, Macromolecules, 2011, 44, 9650–9660 CrossRef CAS
- T. Zhou, A. Zhang, C. Zhao, H. Liang, Z. Wu and J. Xia, Macromolecules, 2007, 40, 9009–9017 CrossRef CAS
- A. Savitzky and M. J. E. Golay, Anal. Chem., 1964, 36, 1627–1639 CrossRef CAS
- G. Su, T. Zhou, Y. Zhang, X. Liu and A. Zhang, Soft Matter, 2016, 12, 1145–1157 RSC
- I. M. Hodge, Macromolecules, 1983, 16, 898–902 CrossRef CAS
- A. R. Berens and I. M. Hodge, Macromolecules, 1982, 15, 756–761 CrossRef CAS
- E. Meaurio, E. Zuza, N. Lopez-Rodriguez and J. R. Sarasua, J. Phys. Chem. B, 2006, 110, 5790–5800 CrossRef CAS PubMed
- G. Su, T. Zhou, X. Liu, J. Zhang, J. Bao and A. Zhang, RSC Adv., 2015, 5, 84729–84745 RSC
- J. Sarasua, N. L. Rodriguez, A. L. Arraiza and E. Meaurio, Macromolecules, 2005, 38, 8362–8371 CrossRef CAS
- L. Qin, J. Qiu, M. Liu, S. Ding, L. Shao, S. Lu, G. Zhang, Y. Zhao and X. Fu, Chem. Eng. J., 2011, 166, 772–778 CrossRef CAS
- D. F. Swinehart, J. Chem. Educ., 1962, 39, 333 CrossRef CAS
- Q. Yuan, T. Zhou, L. Li, J. Zhang, X. Liu and X. Ke, RSC Adv., 2015, 5, 31153–31165 RSC
- P. J. Pan, B. Zhu, W. H. Kai, T. Dong and Y. Inoue, Macromolecules, 2008, 41, 4296–4304 CrossRef CAS
- H. Urayama, S. Moon and Y. Kimura, Macromol. Mater. Eng., 2003, 288, 137–143 CrossRef CAS
- P. J. Pan, B. Zhu and Y. Inoue, Macromolecules, 2007, 40, 9664–9671 CrossRef CAS
- S. Kang, S. L. Hsu, H. D. Stidham, P. B. Smith, M. A. Leugers and X. Yang, Macromolecules, 2001, 34, 4542–4548 CrossRef CAS
- J. Dlouha, L. Suryanegara and H. Yano, Soft Matter, 2012, 8, 8704–8713 RSC
- H. Mao, G. Shan, Y. Bao, Z. L. Wu and P. Pan, Soft Matter, 2016, 12, 4628–4637 RSC
Footnote |
| † Electronic supplementary information (ESI) available: Temperature-dependent FTIR in the range of 970–850 cm−1; PCMW2D correlation FTIR spectra; the ordering degree calculated from DSC data; generalized 2D correlation spectra of PLLA. See DOI: 10.1039/c7ra08921j |
| This journal is © The Royal Society of Chemistry 2017 |