 Open Access Article
Positive charge pesticide nanoemulsions prepared by the phase inversion composition method with ionic liquids
Xin Zhao,
Yanqiu Zhu,
Chenhui Zhang,
Jinmei Lei,
Yue Ma and
Fengpei Du *
*
Department of Applied Chemistry, College of Science, China Agricultural University, Beijing, 100193, P. R. China. E-mail: dufp@cau.edu.cn
First published on 17th October 2017
Abstract
The deposition of pesticide liquid droplets on plant surfaces is of great importance in agricultural application. More than 50% of agrochemicals are lost and wasted during the spraying and wetting processes. Because the surfaces of plant leaves are negatively charged, we produced a kind of positive charge lambda-cyhalothrin loaded oil-in-water nanoemulsion in the system water/EL-80-Span 60/solvent 150# via the phase inversion composition (PIC) method with addition of Ionic Liquids (ILs). The electrostatic interaction between the negative charge surface and positive charge droplet would highly increase the wetting property. The results show that the positive zeta potential of nanoemulsion droplets gained along with the increase concentration of P14444Br, but with the increase concentration of P4444Br, the negative zeta potential of nanoemulsion droplets changed slightly and stayed around −17.8 mV (without any ILs). Besides, we explored the rheology characteristic of prepared nanoemulsions. Additionally, the contact angle experiments show that the positively charged nanoemulsions have a stronger adsorption on the negative surface and the contact angle decreased along with the increase of positive charge. Significantly, with addition of ILs, the nanoemulsions showed an excellent long-term stability due to electrostatic repulsion between droplets and homogeneous nanoscale droplet size. The highly stable pesticide nanoemulsions are of great importance in practical application and the nanoemulsions prepared with ILs offered a good potential as a carrier for drug delivery.
1. Introduction
Pesticides provide tremendous benefits to agriculture by decreasing crop losses caused by weeds, pathogenic bacteria, insects, rodents and many other pests worldwide.1 In recent years, the usage of pesticides has saved the food protection and reduced the economic loss at the same time in China. However, the pesticide utilization is rather low due to the poor wettability of droplets on plant surfaces2 for their hydrophobic/superhydrophobic properties. The sprayed droplets on impact on the plant surface can bounce or roll off plant surfaces.3 The intermediate stage between production and application is the formulation of pesticides, which determines the effectiveness and ease of implementation.4 The main kinds of pesticide formulations are emulsifiable concentrates (EC) and wettable power (WP).5,6 Nowadays water-based formulations gain more attention as EC contains too much organic solvent that causes environmental pollution,7 WP have low stability that would influence its application.8 Emulsion in water (EW) and suspension concentrate (SC) are widely used replacement formulations, the plenty of water reduces the environmental effect in certain extent. However, the formation of EW needs amount of energy input and the droplet size of EW is about 0.5–3.5 μm that is a relatively large particle size, and besides it would cause undesirable side effects such as toxicity.9 Suspension concentrate (SC) expresses prone to sedimentation and agglomeration. The poor interface property, low permeability and low stability limit its application.Nanoemulsions were defined as emulsions consisting of nanoscaled oil or water droplets (typically beyond the range of 20–200 nm) that dispersed in an opposite phase as the surfactants arranging at the oil/water interface.10 Nanoemulsions have gained great attentions for its particular characteristic in many fields, such as long-term kinetic stability,11 transparent or translucent appearance,12 gravitational sedimentation or creaming than conventional emulsions.13 Nanoemulsions are widely applied in many fields, for example drug delivery,13,14 food quality improvement,15 personal care products in the cosmetics industry,16 and agrochemical industry.4,8,17 The pesticide nanoemulsion formulations have already researched in past years. β-Cypermethrin has been incorporated in the system water/poly(oxyethylene) nonionic surfactant/methyl decanoate18 and this emulsion can be an ideal candidate as a water-insoluble pesticide delivery system. Besides, another β-cypermethrin nanoemulsion formulation has been achieved by using methyl laurate as oil phase, alkyl polyglycoside (APG) and polyoxyethylene 3-lauryl ether (C12E3) as mixed surfactants.10
However, these studies focus on the formation of nanoemulsions, lefts the plant leaf surface characteristic behind and do not take the interaction between droplet and plant leaf surface into account. The surface of organism is typically negatively charged, including microorganism,19,20 plant leaf,21,22 epithelial cells in the various tissues.23 Therefore, positive charge droplets might be expected to attract to their surface for electrostatic interaction, whereas negative charge droplets would be expected to be repelled. The electrical charge on the droplets of nanoemulsions can be manipulated in many ways, for example, by using one or more emulsifiers with different charge characteristics or by adsorbing charge substances onto the droplet surfaces.24 Thyme oil has been incorporated with positive charge (LAE) nanoemulsion particles and show more effective antimicrobial because the positive charge droplets would be attracted to the surfaces of negative charge yeast cells.24 Positive charge nanoemulsions have prepared by addition of cationic surfactant CTAB by a one-step sub-PIT method and the mixed cationic-nonionic surfactants stabilized nanoemulsions act relatively high long-term stability for electrostatic stabilization.11 Consequently, a kind of pesticide nanoemulsions formulations that consist of monodisperse nanoscale and positive charge particle would enhance the wetting, adhesion, and permeating between pesticide formulation with crops, thus increasing the effectively utilizing of pesticides.
Some researchers get positive charge nanoemulsion by altering the pH and the electric charge shows slightly positive at pH = 2 (around +6 mV).25 Others have tried adding inorganic salt such as AlCl3 and got positive charge droplets, the ξ-potential is around 10 mV at a concentration of AlCl3 0.5 M.26 In agrochemical, low pH and high inorganic salt concentration may cause irreversible damage to plant, which limit the usage of pesticide, so we tried adding surface-active ionic liquids into nanoemulsions to get positive charge droplets.
Ionic liquids (ILs) are kinds of components consist of an anionic part and a cationic part.27 Researches indicate that some ILs with long-chain alkyl groups can self-assemble to form aggregation in microemulsions and aqueous solutions28 and thus show surface-active. These ILs are called surface-active ionic liquids (SAILs).29 The changing alkyl chain length, charged head group structure, functional groups, both cationic and anionic surface active ILs have already been discussed.30–33 These ILs have been found to have a superior surface activity in comparison to corresponding alkyltrimethylammonium based surfactants.34 For example, ILs have been developed as micelle forming surfactants for chiral and achiral CE (capillary electrophoresis) separations35 and the green solvent in extracting organic substance. Besides, the addition of imidazolium ILs could block organic amine–silanol interactions on the silica surface and improve resolution.36 ILs has already been used in preparing microemulsions in past years.37,38 However, pesticide microemulsion would be limited in application for whose formulation requires a high surfactant concentration (about 20% or higher).39 Nanoemulsions can be prepared at a surfactant concentration between 3% and 10%.39
In this article, we have investigated the influence of the externally added ILs alkyl chain length and concentrations on the droplet size, polydispersity, zeta potential, viscosity, and the stability of nanoemulsions. Additionally, the modification of solid surface by nanoemulsions and contact angle of nanoemulsions on wheat (Triticum aestivum) were explored. The positive charge nanoemulsions can be easily tuned by varying different types of SAILs. Furthermore, the charge nanoemulsions have exhibited excellent long-term stability for electrostatic stabilization and nanoscale droplet size. The positive charged nanoemulsions prepared with ILs offers a good potential as a carrier for drug delivery of lambda-cyhalothrin and would improve the pesticide effect.
2. Experimental
2.1 Materials
The nonionic surfactant polyoxyethylene castor oil (EL-80, HLB = 14.4, C.P.) and solvent 150# (main composition is tetramethylbenzene) were supplied by Nantong Zhanyi Chemical Co., Ltd. Another nonionic surfactant sorbitan monostearate (Span 60, HLB = 4.7, C.P.) and pesticide lambda-cyhalothrin were purchased from Numen (Beijing) International Biotech Co., Ltd. The ILs ([BMIm]Cl, [OMIm]Cl, [C12-MIm]Cl, [C16-MIm]Cl, P4444Br, P8444Br, P12444Br, P14444Br) (as shown in Table 1) were purchased from Lanzhou Institute of Chemical Physics, Chinese Academy of Sciences. Milli-Q water (water purified by treatment with Milli-Q apparatus, Millipore Corp., Bedford, MA, USA) was used in whole experiments. Wheat leaves (Jimai 22) were got in a greenhouse of China Agricultural University. The length and width of each leaf was strictly controlled and the leaf was cut and adhered to the glass slide with double-sides adhesive tape.2.2 Nanoemulsion formation
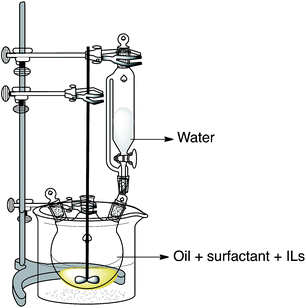
The preparation of the nanoemulsion can be divided into three steps. Firstly, the nonionic surfactants (EL-80 and Span 60), pesticide and ILs were dissolved into the solvent 150# under mechanical stirring at 150 rpm in water bath (323 K). Secondly, the water phase was added drop-wise into the oil mixture at a rate of 1 mL min−1 in water bath (323 K) under mechanical stirring at 150 rpm (Fig. 1). Thirdly, when the samples were cooled down to room temperature, they were subsequently poured into glass vials and placed under 327 K, 298 K, and 273 K, respectively. The influences of ILs types and ILs concentrations were investigated systematically. In the preparation of nanoemulsions, the composition and preparation conditions used were uniform: 10 wt% of solvent 150#, 10 wt% mixed surfactant (EL-80: Span 60 = 3![[thin space (1/6-em)]](https://www.rsc.org/images/entities/char_2009.gif) :
:![[thin space (1/6-em)]](https://www.rsc.org/images/entities/char_2009.gif) 1), 5% of the lambda-cyhalothrin, varies ILs and the others was water. We used solvent 150# as solvent for it has high-boiling-point and has excellent solubility properties, good chemical and physical stability.
1), 5% of the lambda-cyhalothrin, varies ILs and the others was water. We used solvent 150# as solvent for it has high-boiling-point and has excellent solubility properties, good chemical and physical stability.
2.3 Droplet size measurements
Droplet size (z-average diameter) and size distribution (PDI) of nanoemulsions were measured by dynamic light scatter (DLS) using Malvern Zetasizer Nano-ZS90 (Malvern Instruments, UK) at 298 K. The instrument contains an argon laser (λ = 633 nm) with variable intensity. The emulsion was diluted about 1000 times with Milli-Q water before measurements in order to avoid multiple light scattering effects and each measurement was made with three readings per sample.2.4 Zeta potential measurements
The zeta potential of nanoemulsion droplets was measured by using Malvern Zetasizer Nano-ZS90 (Malvern Instruments, UK) at 298 K. The emulsion was diluted about 1000 times with Milli-Q water before measurements. Results were reported as the average of three measurements.2.5 Transmission electron microscopy (TEM)
TEM images were obtained on Hitachi H-7650B electron microscope operating at the accelerating voltage of 80 kV; to obtain the detail information about morphology and particle size of the nanoemulsion particles. For the preparation of samples, about 10 μL of diluted nanoemulsion sample (100 times) was dropped on the copper coated carbon grid for 1 minute, and the extra sample was wiped off with capillary tube. Then about 10 μL of 2% phosphotungstic acid (PTA) solution (pH 6.4) was added for staining 1 minute, and the extra phosphotungstic acid was wiped off with capillary tube. Put the copper at room temperature for overnight before being placed in the electron microscope.2.6 Determination of critical micelle concentration (CMC)
The CMC values of aqueous surfactant solutions were calculated by two methods: surface tension measurements and conductivity method. The surface tension was measured by the wilhelmy plate method by using a surface tensiometer (Dataphysics, Germany, DCAT21) at 298 K. Before each measurement, the platinum plate was thoroughly cleaned and burnt under alcohol flame till red in order to remove the absorbed impurities completely before each measurement. The surface tension of pure water (72.00 mN m−1) was used to calibrate the tensiometer and check the cleanliness of the glassware in this measurement. More than ten successive measurements were carried out in each measurement and the standard deviation did within ±0.2 mN m−1. The conductivity method was performed by using a conductometer (Shanghai instrument and electrical scientific instrument Limited by Share Ltd, China, DDSJ-308A) with a PT/platinized electrode at 298 K.2.7 Rheological measurements
Rheological measurements were carried out by a rheometer (Brookfield Engineering Laboratories Middleboro, R/S plus, MA, USA) at 298 K. All measurements were performed with a spindle of DG3-DIN under shear rate control condition within the range 1 s−1 to 200 s−1.2.8 Long-term stability test
The long-term stability of nanoemulsions was assessed by measuring the change of droplet size along with the time of storage at different storage temperature by DLS (298 K).2.9 Contact angle measurement
3. Results and discussion
3.1 Effect of alkyl chain length of ILs on the droplet size and zeta potential of nanoemulsions
Two types of ILs (phosphonium ILs and imidazolium ILs) were chosen in this part and the concentrations of the two types ILs were all 0.4 wt%. The dependence of the droplet sizes of nanoemulsions on the ILs type was given in Table 2. The PDI of each nanoemulsion was around 0.2 that was considered to be the homogenous system.40 From Table 2, we could see that the sizes of droplets decreased along with the increase of alkyl chain length in phosphonium ILs from butyl to dodecyl, and when the alkyl chain length was twelve, a minimum size was obtained. Whereas, a further increase in alkyl chain length from dodecyl to tetradecyl caused an increase of droplet size in nanoemulsions. The trend of mean droplet size with the increase of alkyl chain length of imidazolium ionic liquids was the same with the nanoemulsions with phosphonium ILs. The sizes of droplets decreased along with the increase of alkyl chain length in imidazolium ILs from octane to dodecyl, and when the alkyl chain was dodecyl, a minimum size was obtained. Whereas, a further increase in alkyl chain length from dodecyl to cetyl caused an increase of droplet size in nanoemulsions. The smallest droplet was observed when the alkyl chain of ILs was dodecyl.| Additives | Initial droplet size/nm | Polydispersity | Zeta potential/mV |
|---|---|---|---|
| [BMIm]Cl | 201.3 | 0.148 | −17.4 |
| [OMIm]Cl | 193.9 | 0.119 | −22.0 |
| [C12-MIm]Cl | 153.4 | 0.245 | 5.54 |
| [C16-MIm]Cl | 159.2 | 0.174 | 47.4 |
| P4444Br | 219.3 | 0.174 | −19.8 |
| P8444Br | 193.5 | 0.110 | −22.6 |
| P12444Br | 161.7 | 0.142 | 16.2 |
| P14444Br | 185.1 | 0.165 | 33.7 |
The formation of the ILs nanoemulsions droplets size may be due to the differences in polarity and lipophilicity between ILs.41 The hydrophobic of phosphonium and imidazolium ILs gains along with the increase of alkyl chain length. The hydrophilic ILs that having coordinating anions is easier to dissolve in the EL-80/Span 60 rather than hydrophobic ILs.42 Besides, due to the arrangement changes on the surfaces of the emulsifiers with the addition of ILs cations to the formulation could lead to the formation of smaller droplet sizes.43 Thus, the size of the two types ILs nanoemulsions droplets decreased with the increase of alkyl chain length to dodecyl. The slight increase in droplet size at a tetradecyl may be due to P14444Br possessing more at the oil–water interface.
The functional performance of nanoemulsions containing lambda-cyhalothrin is likely to depend on the electrical characteristics of the oil droplets for this would be expected to affect their interactions with the anionic surfaces of plant leaf surfaces. The zeta potential of initial nanoemulsions (stabilized by only EL-80 and Span 60) was negatively charged (−17.1 mV), which could be attributed to the presence of some anionic impurities (such as free fatty acids) in the surfactant or some anionic species (such as hydroxyl ions) from the water's adsorption to the droplet surfaces.24 The effect of ILs types on the zeta potential of nanoemulsion droplets was determined (Table 2.). When different alkyl chain length of phosphonium ILs was added to the initial nanoemulsion, the droplet charge increased from −19.8 mV to 33.7 mV along with the alkyl chain length increase from butyl to tetradecyl. As the same, we could see the same tendency of imidazolium ILs added nanoemulsions, the droplet zeta potential increased from −22 mV to 47.4 mV following the alkyl chain length increase from octyl to cetyl. The positive charge brought by the cationic head group of more than dodecyl chain ILs neutralize the original negative charges, resulting in a charge reversal and ultimately a positive charge on the droplets. Besides, with the alkyl chain length rising from dodecyl to tetradecyl, the positive charge of droplet surfaces increased from 16.2 mV to 33.7 mV. And with the alkyl chain length rising from dodecyl to cetyl, the positive charge of droplet surfaces increased from 5.54 mV to 47.4 mV. These results suggested that the ILs with a more than twelve-alkyl chain acted as cationic surfactant, and at least some of the cationic surfactant molecules adsorbed to the oil droplet surfaces.44
Generally, the charge stabilization is considered to be effective if the zeta potential of nanoemulsion is above +30 mV or below −30 mV.45 Since phosphonium-based ILs shown higher thermal stability and lower toxicity compared to imidazolium-based ILs,46 P4444Br and P14444Br were chosen for the following research.
3.2 Surface and aggregation properties of P14444Br and P4444Br in aqueous solution
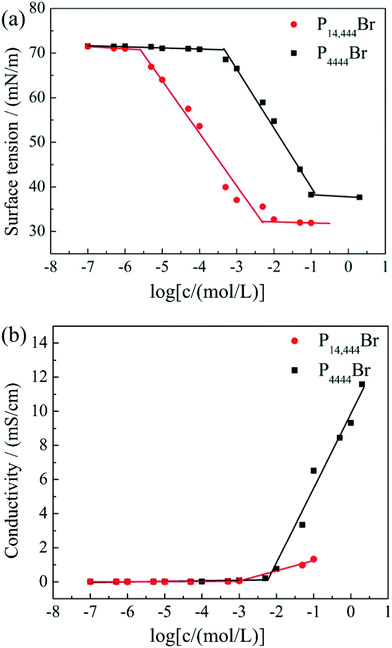
The surface tension value is generally considered as an indicator of the adsorption efficiency of surfactant molecules at the air-liquid interface.47 The equilibrium surface tension of P14444Br and P4444Br in aqueous solution versus the logarithm of the concentration was shown in Fig. 2a. It can be figured out that the surface tension of P14444Br and P4444Br solution progressively decreased along with the increase of concentration and then reached a plateau. So, the P4444Br and the P14444Br could be called surface active agent which is surfactant. The plateau of surfactant solution indicated that the transition point corresponded to the critical micelle concentration that is CMC,48 and the surface tension of CMC is the γCMC. This was determined by the breakpoint of the two fitted straight lines. The maximum surface excess concentration Γmax and Amin could be calculated by Gibbs adsorption49 using the slopes of plots versus log concentration with the eqn (1) and (2). The ΔGθmic and ΔGθads could be calculated with the eqn (3) and (4).50,51
 | (1) |
 | (2) |
 | (3) |
| ΔGθads = ΔGθmic − 6.022ΠAmin | (4) |
![[thin space (1/6-em)]](https://www.rsc.org/images/entities/char_2009.gif) log
log![[thin space (1/6-em)]](https://www.rsc.org/images/entities/char_2009.gif) C is the slope of fitted line below CMC of surface tension plots, n is the number of solute species whose concentration at the interface changes with variation in the value of bulk concentration, NA is the Avogadro's number, Π (=γ0 − γ) is the surface pressure in the region of surface saturation, γ0 is the surface tension of pure water. The parameters above of P14444Br and P4444Br solution were shown below (Table 3).
C is the slope of fitted line below CMC of surface tension plots, n is the number of solute species whose concentration at the interface changes with variation in the value of bulk concentration, NA is the Avogadro's number, Π (=γ0 − γ) is the surface pressure in the region of surface saturation, γ0 is the surface tension of pure water. The parameters above of P14444Br and P4444Br solution were shown below (Table 3).
| ILs | CMC (mol L−1) | γCMC (mN m−1) | Γmax (mol m−2) | Amin (Å2) | Π (mN m−1) | ΔGθmic (kJ mol−1) | ΔGθads (kJ mol−1) |
|---|---|---|---|---|---|---|---|
| P14444Br | 4.75 × 10⁻³ | 31.13 | 2.07 × 10⁻⁶ | 80.24 | 40.87 | −23.21 | −42.96 |
| P4444Br | 1.36 × 10⁻¹ | 38.21 | 2.32 × 10⁻⁶ | 71.60 | 33.79 | −14.90 | −29.47 |
The CMC values of surfactants in aqueous solutions are crucial parameter for their aggregation behaviors. It can be calculated by several methods. Except for the above mentioned surface tension method, we also measured the CMC by conductivity method, and the results was shown in Fig. 2b. The inflection point of x axis was CMC. In Fig. 2a the break points of x axis were 1.36 × 10⁻¹ mol L−1 (P4444Br) and 4.75 × 10⁻³ mol L−1 (P14444Br), which were the same with that in Fig. 2b. So, the obtained CMC values of the two ILs show the following order: P4444Br (1.36 × 10⁻¹ mol L−1) > P14444Br (4.75 × 10⁻³ mol L−1), and γCMC value show the same order: P4444Br (38.21 mN m−1) > P14444Br (31.13 mN m−1). The results show that the CMC and γCMC decreased from P4444Br to P14444Br as the alkyl chain increased from butyl to tetradecyl. This was attributed to the increase of hydrophobic of the two ILs, due to the increase of alkyl chain length, which caused a decrease in the formation of micelles.
In addition, parameters of aggregation and adsorption were further calculated at equilibrium in Table 3. The obtained Γmax values of the two ILs show the following order: P4444Br (2.32 × 10⁻⁶) > P14444Br (2.07 × 10⁻⁶), and Amin value exhibited an opposite order: P4444Br (80.24 Å2) < P14444Br (71.60 Å2). This indicated that more ILs surfactants were adsorbed at the air/water interface with an increase of hydrophobic alkyl chain. Moreover, P4444Br and P14444Br were able to spontaneously form micelles and adsorbed at the air/water interface for both the free energies of micellization and adsorption (ΔGθmic and ΔGθads) were negative. It is obvious that the absolute value of ΔGθads was larger than that of ΔGθmic. The more negatively of ΔGθads values, the easier adsorption behaviour occurred, which was governed by the thermodynamic stability of the molecules at the air–water interface, in comparation with the micellization behavior. This was in accordance with the literature data.51,52
3.3 Effect of ILs concentrations on droplet size and zeta potential of nanoemulsions
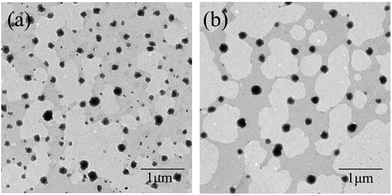
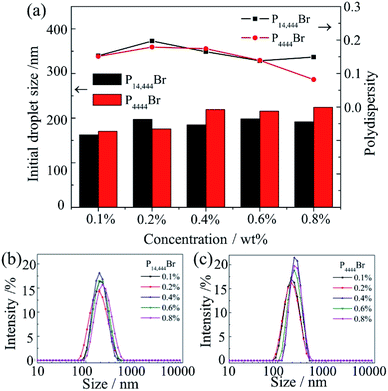
We added different concentrations of P4444Br and P14444Br separately and the PDI of each nanoemulsions were below 0.2 that were considered to be homogenous systems.40 Fig. 3 showed the transmission electron microscopy (TEM) images of nanoemulsions with 0.4% P4444Br (Fig. 3a) and 0.4% P14444Br (Fig. 3b). Through these images, nanoemulsions were appeared dark with a spherical shape of droplets and the particle size ranged from 100 to 200 nm, which matched with the data from DLS. It is obvious that the nanoemulsion system is homogenous, the droplet size was in nanosize range and the shape of droplet were spherical, thus can be considered as nanoemulsions. Fig. 4 was the effect of the ILs concentration on the mean droplet size and polydispersity of the nanoemulsions. We can figure out that the mean droplet size initially increased with the increasing of ILs concentrations, and when the concentrations continuous increasing, the droplet sizes basically remained unchanged. Because of the charge screening by more counterions from ILs, the effective volume fraction dropped, and depletion attractions generated in micelles in continuous phase and led to extensive droplet aggregation that resulted in the droplet sizes increasing.53 And when the adsorption reached equilibrium, the droplet sizes kept as a constant. In Fig. 4b and c, we can see that formation of nanoemulsions with different concentrations of ILs expressed different droplet size distribution. The narrowest distribution of droplet size could be got at the highest.The impact of adding ILs with different alkyl chain length and different concentrations on the zeta potential of the nanoemulsions droplets was determined (Fig. 5). The zeta potential of the initial nanoemulsion (containing Span 60 and EL-80) was negative (−17.1 mV), which could be attributed to the presence of some anionic impurities (such as free fatty concentration of ILs acids) in the surfactant or some anionic species (such as hydroxyl ions) from the water's adsorption to the droplet surfaces.24 When P4444Br was added to the initial nanoemulsion, the droplet charge became much more anionic. The negative charge on the droplets increased from −17.1 to −20.1 mV when the P4444Br concentration was increased from 0 to 0.1%. Moreover, with an addition of higher concentration of P4444Br, the charge remained relatively constant. This suggested that the P4444Br molecules adsorbed to the oil–water interface and displace some of the mix surfactants (Span 60 and EL-80), which is the same with anionic surfactant SDS in thyme oil nanoemulsions.24 Conversely, when P14444Br was added to the initial nanoemulsion, the droplet charge became more cationic. The positive charge on the droplets increased from −17.1 to 6.83 mV when the P14444Br concentration increased from 0 to 0.1%. The change in droplet charge with increasing P14444Br concentration was steepest from 0 to 0.1%, and still increased less steep from 0.1% to 0.6%, but stayed constant with an increasing concentration from 0.6% to 0.8%. This suggests that the P14444Br molecules had adsorbed to the oil–water interface and displaced at least some of the mix surfactants molecules, which is the same with cationic surfactant lauric arginate in thyme oil nanoemulsions.24
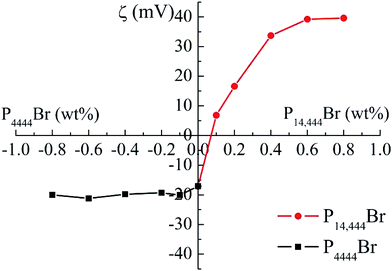 | ||
| Fig. 5 Effect of the ILs concentrations of EL-80-Span 60 stabilized nanoemulsions on the droplet zeta potential. The coordinate of horizontal ordinate intersection is (0, 0). | ||
The initial change in particle charge with increasing concentration was higher for P14444Br than for P4444Br (Fig. 5), which may be attributed to differences in their molecular characteristics. The two ILs possess the same hydrophilic head group. However, the P14444Br has a tetradecyl and P4444Br has a butyl hydrophobic chain oppositely. The hydrophobic of tetradecyl is stronger than the butyl, which suggested that the P14444Br molecules may be able to pack more effectively at the oil–water interface. Nanoemulsions with a range of different charge characteristics can be prepared by mixing nonionic-coated droplets with different types and concentrations of ILs.
3.4 Rheology study
The rheology evaluation of pesticide nanoemulsion is an important parameter for development and application of nanoemulsions for which can give useful information about the rheology behaviour of nanoemulsion. Fig. 6 showed the shear viscosity as a function of shear rate for nanoemulsions with different concentrations of ILs. From Fig. 6a and b, we could see that the nanoemulsions added with P14444Br (a) and P4444Br (b) show the same tendency. The viscosity of all nanoemulsions was decreased sharped with increasing of shear rate and then plateaued. From these we could see that the flow behaviour of the nanoemulsions we got were typical non-Newtonian flow behaviour, and shear thinning behaviour at low shear rates up 200 s−1 for all nanoemulsions, these nanoemulsions were all non-Newtonian pseudoplastic fluid. And their viscosity values increased with the increasing of ILs concentration. The structure of the nanoemulsions was gradually destroyed and locally dense clusters were disrupted into individual droplets with the increase of shear rate.54 When the shear rate increased to overcome the Brown motion, the interaction of droplet to droplet was deformed and disrupted. And the droplets became more ordered beyond the flow field and offered less resistance to flow that resulted the decrease of viscosity.55,56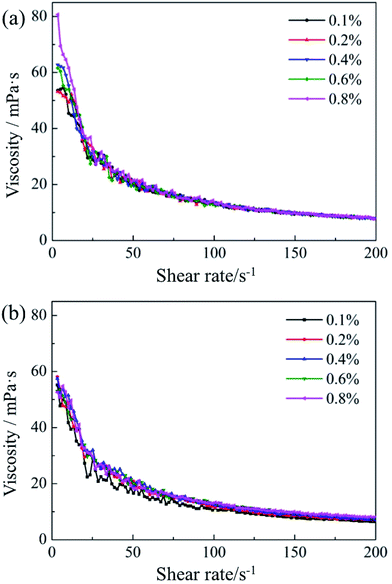 | ||
| Fig. 6 Shear viscosity as a function of shear rate for nanoemulsions with different concentrations ILs. (a) P14444Br, (b) P4444Br. | ||
The power law model (5) and the Herschel–Bulkley model (6) were all used to fit curves of shear stress versus shear rate. The Table 4 appends the fitted results of the two models.
τ = k![[small gamma, Greek, dot above]](https://www.rsc.org/images/entities/i_char_e0a2.gif) n n
| (5) |
τ = τ0 + k![[small gamma, Greek, dot above]](https://www.rsc.org/images/entities/i_char_e0a2.gif) n n
| (6) |
![[small gamma, Greek, dot above]](https://www.rsc.org/images/entities/i_char_e0a2.gif) is shear rate, k is a consistency index, τ is shear stress, n is a flow behaviour index, τ0 is yield stress. In Table 4, R2 is the correlation coefficient. We found out that the curves of shear stress versus shear rate for all concentrations of ILs nanoemulsions were fitted well by the power law model and Herschel–Bulkley model; especially the Herschel–Bulkley model was much better. The consistency index was a measure of apparent viscosity and was well in agreement with the results of viscosity measurements. Emulsions possessed of a relatively high yield stress could prevent the creaming of the emulsions.
is shear rate, k is a consistency index, τ is shear stress, n is a flow behaviour index, τ0 is yield stress. In Table 4, R2 is the correlation coefficient. We found out that the curves of shear stress versus shear rate for all concentrations of ILs nanoemulsions were fitted well by the power law model and Herschel–Bulkley model; especially the Herschel–Bulkley model was much better. The consistency index was a measure of apparent viscosity and was well in agreement with the results of viscosity measurements. Emulsions possessed of a relatively high yield stress could prevent the creaming of the emulsions.
| c/wt% | Power law model τ = k![[small gamma, Greek, dot above]](https://www.rsc.org/images/entities/i_char_e0a2.gif) n n |
Herschel–Bulkley model τ = τ0 + k![[small gamma, Greek, dot above]](https://www.rsc.org/images/entities/i_char_e0a2.gif) n n |
||||||
|---|---|---|---|---|---|---|---|---|
| k/Pasn | n | R2 | k/Pasn | n | τ0 | R2 | ||
| P14444Br | 0.10 | 0.2445 | 0.36 | 0.9672 | −2.240 | 2.10 | 0.112 | 0.9878 |
| 0.20 | 0.2570 | 0.35 | 0.9640 | −2.608 | 2.47 | 0.099 | 0.9852 | |
| 0.40 | 0.2635 | 0.34 | 0.9660 | −2.087 | 1.99 | 0.116 | 0.9849 | |
| 0.60 | 0.2613 | 0.34 | 0.9684 | −1.589 | 1.54 | 0.137 | 0.9830 | |
| 0.80 | 0.2993 | 0.32 | 0.9700 | −1.752 | 1.76 | 0.122 | 0.9834 | |
| P4444Br | 0.10 | 0.2140 | 0.35 | 0.9579 | −1.971 | 1.87 | 1.060 | 0.9783 |
| 0.20 | 0.2670 | 0.32 | 0.9420 | −2.035 | 1.97 | 0.108 | 0.9841 | |
| 0.40 | 0.2837 | 0.32 | 0.9435 | −2.544 | 2.37 | 0.100 | 0.9855 | |
| 0.60 | 0.2397 | 0.36 | 0.9635 | −2.779 | 2.60 | 0.097 | 0.9885 | |
| 0.80 | 0.2222 | 0.38 | 0.9774 | −1.030 | 1.13 | 0.172 | 0.9908 | |
3.5 Long-term stability
The major destabilization mechanism of nanoemulsions is Ostwald ripening which results from the difference in solubility between small and large droplets.57 Large droplets grow for there exist expense small droplets in polydisperse emulsions due to the mass transport of dispersed phase through the intermediate continuous phase driven by Laplace pressure differences.58 The rate of Ostwald ripening ω can be obtained by LSW (Lifshitz–Slezov–Wagner) theory:
 | (7) |
There are many factors can influence the droplet size and the stability of nanoemulsion, which results in a change of the rate of Ostwald ripening. The stability of nanoemulsions that were prepared by high-energy method could be having fine stability, but these high-energy methods cost high energy and might cause viscous heating.12 From the previous studies it is difficult to obtain highly kinetically stable nanoemulsions by the low-energy method. Sun and his team studied the Span 80-Tween 80 stabilized paraffin O/W nanoemulsions by PIC method at a preparation temperature of 343 K thus enhanced the surfactant adsorption at the O/W interface and reduced the viscous resistance of the oil phase. The size distribution of these nanoemulsions did not change over 5 months.60 However the relatively high stable nanoemulsions have to be prepared in higher temperature.
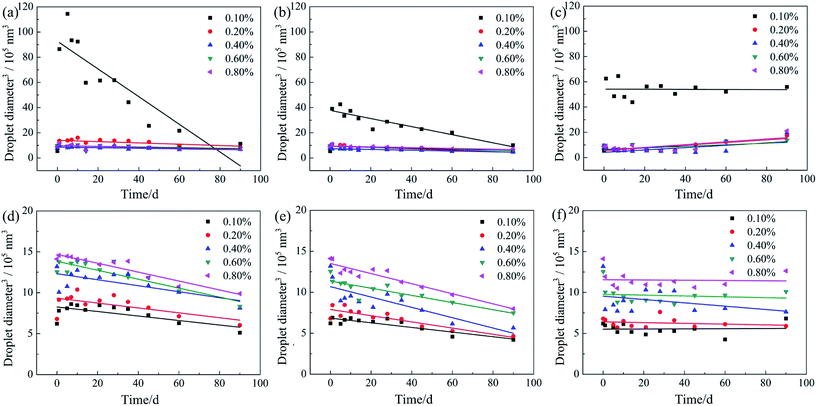
The stability of these nanoemulsions with the addition of P14444Br and P4444Br was assessed by following the change in droplet size with time of storage at different temperatures, as summarized in Fig. 7. The electrical charge on the droplets plays an important role in the stability of nanoemulsions due to electrostatic stabilization. Nanoemulsions with an addition of 0.1 wt% P14444Br (Fig. 7a–c) had the lowest stability with increased droplet size at different temperatures. There was no significant difference in droplets size of the emulsions with concentrations of P14444Br from 0.2 wt% to 0.8 wt%. The size distributions of nanoemulsions prepared with P14444Br have not changed over 90 days in 298 K. From the Fig. 7a–c, we can see that storage temperature had slight influence on the droplet size of nanoemulsions. The head groups of surfactant have a lot of hydrogen bonding sites and thus form hydrogen bonds between the hydroxyl group of Span 60 and EL-80 with the anions of ILs.61 P14444Br with tetradecyl possess excellent surface activity and strongly absorbed on the oil/water interface for its well hydrophobic than P4444Br.41 Besides, the zeta potential increased along with the increasing of P14444Br concentrations, the relatively high electrical charge between nanoscale droplets contributed to nanoemulsions stability due to electrostatic repulsion. In Fig. 7d and e, the droplet sizes of nanoemulsions prepared with P4444Br changed slightly over 90 days in 298 K and 273 K. When nanoemulsions prepared with P4444Br were stored in 327 K (Fig. 7f), there was no significant difference in droplets size of nanoemulsions with concentrations of P4444Br at 0.1 wt%, 0.2 wt%, 0.4 wt%, 0.6 wt% and 0.8 wt%. As the negative charge did not change with the increasing of P4444Br concentrations, the electrostatic repulsion of nanoemulsions with series P4444Br concentrations was similar.
In our study, the Ostwald ripening process is almost prevented by adding a certain amount of SAILs (P14444Br and P4444Br). This is of great significance from an applied point of view.
3.6 The hydrophobic modification of solid surface and the contact angle on wheat leaf
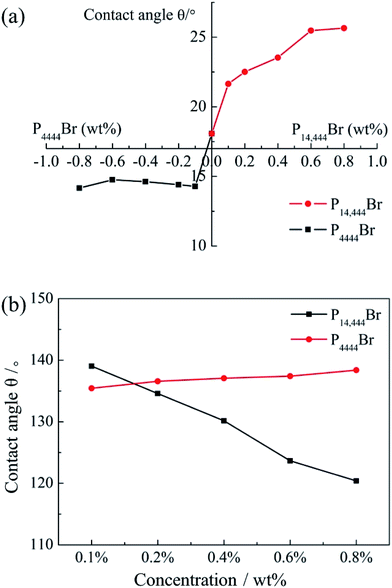
We compared the contact angle of water on hydrophobic modified glass slide as a function of P14444Br/P4444Br concentration in Fig. 8a which show a familiar trend with nanoemulsion zeta potential (Fig. 5). The contact angle of positive nanoemulsions modified solid surface gained with the increase of P14444Br concentration. However, the contact angle of negative nanoemulsions modified solid surface relatively stable with the increase of P14444Br concentration. We figured out that as the surface of glass slide was negative, the positive charge droplet adsorbed on the surface of glass slide due to the electrostatic attraction. And with the increase of positive charge, the electrostatic attraction increased, which caused the contact angle showing an increasing tendency. But the electrostatic repulsion between the glass slide and negative charge droplet presented weak adsorption and thus the contact angle changed less. So the positive charge nanoemulsion could be used in the hydrophobic modification of solid surface. In summary, the better adsorption of positive charge nanoemulsion with negative charge surface could effectively enhance the pesticide retention.In order to figure out whether the droplet charge play an important role in pesticide nanoemulsions retention, we studied the contact angle of nanoemulsions with different concentrations of ILs on wheat leaf below. We found out that the contact angle decreased from 139.04° to 120.39° with the concentration of P14444Br increased from 0.1 wt% to 0.4 wt% (Fig. 8b). And the contact angle slightly increased from 135.44° to 138.39° with the concentration of P14444Br increased form 0.1 wt% to 0.4 wt%. Clearly, the contact angle on wheat leaf decreased with the increase of positive charge due to the electrostatic attraction interaction between positive charge droplet and negative charge leaf surface. Oppositely, the contact angle on wheat leaf slightly increased along with the increase of negative charge mainly for the electrostatic repulsion interaction between the similarly charged leaf surface and droplet. So, the positive charge could promote the wetting of pesticide nanoemulsions on plant surfaces and thus stated that the pesticide-loaded positive charge nanoemulsions possessed excellent wetting properties.
4. Conclusions
Nanoemulsions with ILs have been obtained by the PIC method at 323 K. The addition of different alkyl chain length ILs can affect the zeta potential of nanoemulsions. With the increase of alkyl chain length, the droplet charge reversed from negative to positive. P14444Br can absorb at the O/W interface and changes the droplet zeta potential from negative to positive, but the addition of P4444Br can only get negative charge nanoemulsions. Once formed, the droplet size of nanoemulsions could not change in 90 days at room temperature. The shear viscosity of nanoemulsions clearly decreases with the increase of shear rate and shows non-Newtonian fluid behavior. In our study, the Ostwald ripening process is almost prevented by adding a certain amount of SAILs (P14444Br and P4444Br). Additionally, the contact angle experiments show that the positive charge nanoemulsions have a strong adsorption on negative surface and can decrease the contact angle on wheat leaves. This study provided a promising approach to produce fine lambda-cyhalothrin nanoemulsions with positive charge and enhanced the wetting property of nanoemulsions that is considerably important for application in agrochemistry.Conflicts of interest
“There are no conflicts to declare”.Acknowledgements
This work is supported by the National Natural Science Foundation of China (No. 21573283) and grants from the National Key Research and Development Plan (No. 2017YFD020030X).References
- R. M. Johnson and A. B. Pepperman, Pestic. Sci., 1996, 48, 157–164 CrossRef CAS.
- C.-H. Zhang, X. Zhao, J.-M. Lei, Y. Ma and F.-P. Du, Soft Matter, 2017, 13, 503–513 RSC.
- M. Damak, S. R. Mahmoudi, M. N. Hyder and K. K. Varanasi, Nat. Commun., 2016, 7, 12560 CrossRef CAS PubMed.
- A. Kalaitzaki, N. E. Papanikolaou, F. Karamaouna, V. Dourtoglou, A. Xenakis and V. Papadimitriou, Langmuir, 2015, 31, 5722–5730 CrossRef CAS PubMed.
- R. Brown, M. Giansiracusa, A. F. Kirby, D. Saylik and M. E. Doyle, AU. Pat., 2013126948A1, 2013.
- I. Vythilingam, A. R. Zainal and T. Hamidah, Southeast Asian J. Trop. Med. Public Health, 1999, 30, 177–183 CAS.
- J. L. Cordiner, Comput. Chem. Eng., 2004, 29, 83–92 CrossRef CAS.
- C. J. Lim, M. Basri, D. Omar, M. B. A. Rahman, A. B. Salleh and R. N. Z. R. A. Rahman, Ind. Crops Prod., 2012, 36, 607–613 CrossRef CAS.
- I. M. Shirley, H. B. Scher, R. M. Perrin, P. J. Wege, M. Rodson, J. L. Chen and A. W. Rehmke, Pest Manage. Sci., 2001, 57, 129–132 CrossRef CAS.
- Z.-P. Du, C.-X. Wang, X.-M. Tai, G.-Y. Wang and X.-Y. Liu, ACS Sustainable Chem. Eng., 2016, 4, 983–991 CrossRef CAS.
- H. Pan, L.-J. Yu, J. Xu and D.-J. Sun, Colloids Surf., A, 2014, 447, 97–102 CrossRef CAS.
- M. M. Fryd and T. G. Mason, Annu. Rev. Phys. Chem., 2012, 63, 493–518 CrossRef CAS PubMed.
- H.-L. Yu and Q.-R. Huang, J. Agric. Food Chem., 2012, 60, 5373–5379 CrossRef CAS PubMed.
- L.-J. Wang, J.-F. Dong, J. Chen, J. Eastoe and X.-F. Li, J. Colloid Interface Sci., 2009, 330, 443–448 CrossRef CAS PubMed.
- R. M. Walker, E. A. Decker and D. J. McClements, J. Food Eng., 2015, 164, 10–20 CrossRef CAS.
- S. Mayer, J. Weiss and D. J. McClements, J. Colloid Interface Sci., 2013, 402, 122–130 CrossRef CAS PubMed.
- G. E. Nenaah, Ind. Crops Prod., 2014, 53, 252–260 CrossRef CAS.
- L.-J. Wang, X.-F. Li, G.-Y. Zhang, J.-F. Dong and J. Eastoe, J. Colloid Interface Sci., 2007, 314, 230–235 CrossRef CAS PubMed.
- J. Li, D. J. McClements and L. A. McLandsborough, J. Food Sci., 2001, 66, 570–574 CrossRef CAS.
- M. Naïtali, F. Dubois-Brissonnet, G. Cuvelier and M.-N. Bellon-Fontaine, Int. J. Food Microbiol., 2009, 130, 101–107 CrossRef PubMed.
- W. Moore, Ind. Eng. Chem., 1925, 17, 465–466 CrossRef CAS.
- D. Choi, D. W. Kim, D. Yoo, K. J. Cha, M. La and D. S. Kim, Nano Energy, 2017, 36, 250–259 CrossRef CAS.
- M. P. Y. Piemi, D. Korner, S. Benita and J.-P. Marty, J. Controlled Release, 1999, 58, 177–187 CrossRef CAS PubMed.
- K. Ziani, Y. Chang, L. McLandsborough and D. J. McClements, J. Agric. Food Chem., 2011, 59, 6247–6255 CrossRef CAS PubMed.
- L. Bai and D. J. McClements, J. Colloid Interface Sci., 2016, 479, 71–79 CrossRef CAS PubMed.
- J. K. Beattie and A. M. Djerdjev, Angew. Chem., Int. Ed., 2004, 43, 3568–3571 CrossRef CAS PubMed.
- S. Javadian, V. Ruhi, A. Asadzadeh Shahir, A. Heydari and J. Akbari, Ind. Eng. Chem. Res., 2013, 52, 15838–15846 CrossRef CAS.
- C. Tourné-Péteilh, B. Coasne, M. In, D. Brevet, J.-M. Devoisselle, A. Vioux and L. Viau, Langmuir, 2014, 30, 1229–1238 CrossRef PubMed.
- B. Šarac, Ž. Medoš, A. Cognigni, K. Bica, L.-J. Chen and M. Bešter-Rogač, Colloids Surf., A, 2017, 532, 609–617 CrossRef.
- A. Cornellas, L. Perez, F. Commeles, I. Ribosa, A. Manresa and M. T. Garcia, J. Colloid Interface Sci., 2011, 355, 164–171 CrossRef CAS PubMed.
- O. A. E. Seoud, P. A. R. Pires, T. Abdel-Moghny and E. L. Bastos, J. Colloid Interface Sci., 2007, 313, 296–304 CrossRef PubMed.
- M. Blesic, A. Lopes, E. Melo, Z. Petrovski, N. V. Plechkova, J. N. C. Lopes, K. R. Seddon and L. P. N. Rebelo, J. Phys. Chem. B, 2008, 112, 8645–8650 CrossRef CAS PubMed.
- M. T. Garcia, I. Ribosa, L. Perez, A. Manresa and F. Comelles, Colloids Surf., B, 2014, 123, 318–325 CrossRef CAS PubMed.
- M. Anouti, J. Jones, A. Boisset, J. Jacquemin, M. Caillon-Caravanier and D. Lemordant, J. Colloid Interface Sci., 2009, 340, 104–111 CrossRef CAS PubMed.
- M. P. Collins, L. Zhou, S. E. Camp and N. D. Danielson, J. Chromatogr. Sci., 2012, 50, 869–876 CAS.
- L. Zhou and N. D. Danielson, J. Chromatogr. B: Anal. Technol. Biomed. Life Sci., 2013, 940, 112–120 CrossRef CAS PubMed.
- F. Yan and J. Texter, Chem. Commun., 2006, 2696–2698 RSC.
- Y.-N. Gao, S.-b. Han, B.-X. Han, G.-Z. Li, D. Shen, Z.-H. Li, J.-M. Du, W.-G. Hou and G.-Y. Zhang, Langmuir, 2005, 21, 5681–5684 CrossRef CAS PubMed.
- D. J. McClements, Soft Matter, 2012, 8, 1719–1729 RSC.
- F. Jia, H. Gao, H. Jia and W. Zhang, Mol. Cryst. Liq. Cryst., 2016, 633, 1–13 CrossRef CAS.
- D. Dobler, T. M. Schmidts, I. Klingelhöfer and F. Runkel, Int. J. Pharm., 2013, 441, 620–627 CrossRef CAS PubMed.
- S. B. M. Nor, P. M. Woi and S. H. Ng, J. Mol. Liq., 2017, 234, 30–39 CrossRef.
- H. Bataller, S. Lamaallam, J. Lachaise, A. Graciaa and C. Dicharry, J. Mater. Process. Technol., 2004, 152, 215–220 CrossRef CAS.
- Y.-H. Chang, L. McLandsborough and D. J. McClements, Food Chem., 2015, 172, 298–304 CrossRef CAS PubMed.
- S. Y. Teo, S. Y. Lee, H. L. Ong, C. L. Ong, S. N. Gan, M. J. Rathbone and A. G. A. Coombes, J. Nanomater., 2015, 2015, 1–8 CrossRef.
- R. P. Morco, A. Y. Musa and J. C. Wren, Solid State Ionics, 2014, 258, 74–81 CrossRef CAS.
- S.-S. Hu, Z.-H. Zhou, L. Zhang, Z.-C. Xu, Q.-T. Gong, Z.-Q. Jin, L. Zhang and S. Zhao, Soft Matter, 2015, 11, 7960–7968 RSC.
- G.-Y. Wang, Z.-P. Du, Q.-X. Li and W. Zhang, J. Phys. Chem. B, 2010, 114, 6872–6876 CrossRef CAS PubMed.
- M. J. Rosen, Surfactants and Interfacial Phenomena, John Wiley and Sons, New York, 2004 Search PubMed.
- A. Bhadani, M. Tani, T. Endo, K. Sakai, M. Abe and H. Sakai, Phys. Chem. Chem. Phys., 2015, 17, 19474–19483 RSC.
- S. M. Tawfik, A. A. Abd-Elaal, S. M. Shaban and A. A. Roshdy, J. Ind. Eng. Chem., 2015, 30, 112–119 CrossRef CAS.
- J. Lin, M.-N. Zhu, X. Wu, C. Zheng, Z.-L. Liu, Q.-Y. Wang, D.-D. Lu, Q.-Y. He and X.-Y. Chen, Colloids Surf., A, 2016, 511, 190–200 CrossRef CAS.
- Y.-H. Tian, L.-H. Chen and W.-P. Zhang, J. Dispersion Sci. Technol., 2016, 37, 1511–1517 CrossRef CAS.
- J. N. Wilking, C. B. Chang, M. M. Fryd, L. Porcar and T. G. Mason, Langmuir, 2011, 27, 5204–5210 CrossRef CAS PubMed.
- K. W. Song, Y. S. Kim and G. S. Chang, Fibers Polym., 2006, 7, 129–138 CrossRef.
- D. J. McClements, Emulsion Rheology, In Food Emulsions-Principles, Practice and Techniques, CRC Press, Washington, DC, 1999 Search PubMed.
- T. Tadros, P. Izquierdo, J. Esquena and C. Solans, Adv. Colloid Interface Sci., 2004, 108–109, 303–318 CrossRef CAS PubMed.
- D. J. McClements, Food Emulsions: Principles, Practice, and Techniques, CRC Press, Boca Raton, 2005 Search PubMed.
- P. Taylor, Adv. Colloid Interface Sci., 1998, 75, 107–163 CrossRef CAS.
- L.-J. Yu, C. Li, J. Xu, J.-C. Hao and D.-J. Sun, Langmuir, 2012, 28, 14547–14552 CrossRef CAS PubMed.
- Y. Fukaya, K. Hayashi, M. Wada and H. Ohno, Green Chem., 2008, 10, 44–46 RSC.
| This journal is © The Royal Society of Chemistry 2017 |


