 Open Access Article
Creative Commons Attribution 3.0 Unported Licence
An ultra melt-resistant hydrogel from food grade carbohydrates
Benjamin R. Thompson a,
Tommy S. Horozov
 a,
Simeon D. Stoyanov
 bcd and
Vesselin N. Paunov
 *a
*a
aSchool of Mathematics and Physical Sciences (Chemistry), University of Hull, Hull, HU67RX, UK. E-mail: V.N.Paunov@hull.ac.uk; Tel: +44(0) 1482 465660
bUnilever R&D Vlaardingen, Olivier van Noortlaan 120, 3133 AT Vlaardingen, The Netherlands
cLaboratory of Physical Chemistry and Soft Matter, Wageningen University, 6703 HB Wageningen, The Netherlands
dDepartment of Mechanical Engineering, University College London, Torrington Place, London WC1E 7JE, UK
First published on 25th September 2017
Abstract
We report a binary hydrogel system made from two food grade biopolymers, agar and methylcellulose (agar–MC), which does not require addition of salt for gelation to occur and has very unusual rheological and thermal properties. It is found that the storage modulus of the agar–MC hydrogel far exceeds those of hydrogels from the individual components. In addition, the agar–MC hydrogel has enhanced mechanical properties over the temperature range 25–85 °C and a maximum storage modulus at 55 °C when the concentration of methylcellulose was 0.75% w/v or higher. This is explained by a sol–gel phase transition of the methylcellulose upon heating as supported by differential scanning calorimetry (DSC) measurements. Above the melting point of agar, the storage modulus of agar–MC hydrogel decreases but is still an elastic hydrogel with mechanical properties dominated by the MC gelation. By varying the mixing ratio of the two polymers, agar and MC, it was possible to engineer a food grade hydrogel of controlled mechanical properties and thermal response. SEM imaging of flash-frozen and freeze-dried samples revealed that the agar–MC hydrogel contains two different types of heterogeneous regions of distinct microstructures. The latter was also tested for its stability towards heat treatment which showed that upon heating to temperatures above 120 °C its structure was retained without melting. The produced highly thermally stable hydrogel shows melt resistance which may find application in high temperature food processing and materials templating.
Introduction
Hydrogels are 3D hydrophilic, polymeric networks containing either chemical or physical cross-links with the ability to be considerably swollen with water. Being cheap, aqueous based and largely biocompatible materials, hydrogels have attracted a great amount of attention1 due to their alluring properties and have been used in various areas such as tissue engineering,2 drug delivery and wound dressing,3 biomedical applications4 and food structuring.5 With the growing number of versatile hydrogel applications there is demand for more specific hydrogel materials of tailorable properties. Binary hydrogel systems can give properties superior to either of the individual components6,7 with the gelation of one polysaccharide being notably affected by addition of a second polysaccharide. Agar hydrogel alone shows syneresis of water, whereas when combined with locust bean gum, a more elastic hydrogel with reduced syneresis is produced.8 Gellan can be either low-acyl or high-acyl, depending on the manufacturing process used.9 When low-acyl gellan and high-acyl gellan is mixed in a 1![[thin space (1/6-em)]](https://www.rsc.org/images/entities/char_2009.gif) :
:![[thin space (1/6-em)]](https://www.rsc.org/images/entities/char_2009.gif) 1 ratio, the deformability of the hydrogel is increased without any loss of strength when compared to a low-acyl gellan hydrogel of the same overall polymer concentration.10 Agar and κ-carrageenan co-hydrogels were studied at various mixing ratios and it was seen that the gelling temperature decreased, along with forming more deformable but weaker hydrogels.11 Xanthan gum forms a viscous solution in water with pseudoplastic flow behaviour but when mixed with locust bean gum in a 1
1 ratio, the deformability of the hydrogel is increased without any loss of strength when compared to a low-acyl gellan hydrogel of the same overall polymer concentration.10 Agar and κ-carrageenan co-hydrogels were studied at various mixing ratios and it was seen that the gelling temperature decreased, along with forming more deformable but weaker hydrogels.11 Xanthan gum forms a viscous solution in water with pseudoplastic flow behaviour but when mixed with locust bean gum in a 1![[thin space (1/6-em)]](https://www.rsc.org/images/entities/char_2009.gif) :
:![[thin space (1/6-em)]](https://www.rsc.org/images/entities/char_2009.gif) 1 ratio, a large increase in viscosity is seen at low concentrations and gelation occurs at overall polymer concentration as low as 0.3%.12
1 ratio, a large increase in viscosity is seen at low concentrations and gelation occurs at overall polymer concentration as low as 0.3%.12
Agar consists of both agarose and agaropectin, with the former being the constituent that causes gelation. Agarose is composed of a linear polymer of the disaccharide D-galactose and 3,6-anhydro-L-galactopyranose and is insoluble in cold water but hydrates at temperatures close to the boiling point of water where its molecules have a random coil conformation (see Scheme 1). Upon cooling the solution to below the gelling temperature, the agarose chains form double helixes, which aggregate to form a three-dimensional structure with water entrapped within the polymer matrix.13 The gelling temperature of agar is dependent on the methoxyl content, with an increase of methoxyl content showing an increase in gelling temperature.14 This thermo-reversible hydrogel shows a large thermal gelling hysteresis, gelling around 38 °C and melting around 85 °C.8 Agar is widely used in the food industry,15 electrophoresis16 and as a solid culture media for bacteria.17
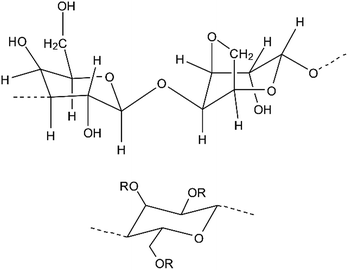 | ||
| Scheme 1 The top image shows the repeating unit of the gelling fraction of agar and the bottom image shows the molecular structure of MC where R represents either H or CH3. | ||
Methylcellulose (MC) is a derivative of cellulose produced by partial methylation of cellulose18 where the degree of substitution (DS) of hydroxyl with methoxyl groups per anhydro-D-glucose unit determines the solubility of the polymer (see Scheme 1).19 MC is insoluble at high temperatures, but hydrates in cold water. After hydration, the viscosity of the MC solution increases with an increase in temperature and forms a gel above a certain temperature that is dependent on the DS and the concentration of MC in solution.19–21 The gelation process is attributed to an initial association of the hydrophobic methylated regions, followed by formation of a turbid gel and phase separation.20,22–25 The heat setting nature of MC, along with its thermoreversibility,26 makes it appealing for use in cooking as a thickener or a binder.18 Previous studies have shown that MC–agar solutions have much quicker gelation times compared to MC alone when held at a constant temperature.27 In this paper we demonstrate the formulation of a novel two-component, physically cross-linked hydrogel system comprising of agar and MC that shows enhanced mechanical properties over the temperature range investigated (25–85 °C) compared to agar or MC alone. For example, when the composition of the binary hydrogel is 1.0–1.0% w/v we have found that the storage modulus (G′) of the hydrogel is largest at 55 °C. We attribute this to a sol–gel phase transition of the MC in the mixed gel which is also backed up by DSC data. We have utilised SEM of freeze-dried agar–MC hydrogels to investigate their microstructure which shows heterogeneous mixing with formation of agar-rich and MC-rich regions. The agar–MC hydrogels also show stability to various forms of heat treatment by maintaining its structure at temperatures well above the melting point of agar alone, which may find a number of applications in high temperature hydrogel templating or as novel structuring agents in the food industry.
Experimental
Materials
Agar (extracted from Gracilaria converfoides (L.)) was purchased from Special ingredients. The total ash content and acid insoluble ash content was less than 1.5% and 0.5%, respectively. The exact methoxyl content of the used agar was unknown. However, the manufacturer's quoted gelation temperature is between 40 and 45 °C, suggesting that the methoxyl content is between 1.5% and 3.5%.14 MC (SG A7C, food grade with a methoxyl content of 30%, a DS of 1.8 and a viscosity of 700 cPs (2% w/v solution))28 was a gift from the Dow Chemical Company, Germany. Deionised water was obtained by a Milli-Q purification system (Millipore) and used in all experiments.Preparation of agar–MC hydrogels and MC solutions
Agar hydrogels (1.0% w/v or 2.0% w/v) were prepared by heating water to 97 °C using a water bath, adding the appropriate mass of the agar powder, and homogenising with an Ultra-Turrax homogeniser for 15 minutes whilst being covered with foil to minimise the evaporation of water. It was poured into moulds, covered with parafilm and set at room temperature, then left in a fridge (4 °C) for 24 hours. MC solutions (1.0% w/v or 2.0% w/v) were prepared by dispersing MC powder in cold water with a homogeniser, then they were left in a fridge (4 °C) for 24 hours to allow the MC to fully hydrate and dissolve. Preparation of the two-component agar–MC hydrogel of various compositions was done by heating water to 97 °C using a water bath and adding the appropriate masses of agar and MC powders, followed by homogenisation for 15 minutes whilst being covered with foil to minimise evaporation. It was poured into moulds, covered with parafilm and set at room temperature, then left in a fridge (4 °C) for 24 hours before characterisation. We did not observe any significant loss of water due to evaporation during the preparation of the hydrogels.Rheology measurements
All rheological measurements were performed using a Bohlin CVO 120 rheometer (Malvern Instruments) with a 20 mm diameter parallel plate geometry and a gap size of 2200 μm. Temperature control was done with the use of a Peltier plate. Oscillatory tests were performed and the storage modulus at 25 °C, 40 °C, 55 °C, 70 °C and 85 °C was measured at increasing shear stress from 1–100 Pa. The frequency used was always 1 Hz. At each temperature, the sample was equilibrated for 30 seconds prior to being measured. To prevent evaporation of water from the agar and agar–MC hydrogels during testing, a thin layer of low viscosity silicone oil (40 cP) was added to their surface.Uniaxial compressive tests
Samples of agar or agar–MC hydrogels (2.0% w/v agar, 1.5–0.5% w/v agar–MC or 1.0–1.0% w/v agar–MC) were prepared and left overnight in the fridge for at least twelve hours. The dimensions of each cylindrical sample were approximately 20 mm height and 30 mm diameter (accurate values were used for calculations). Before testing, the samples were removed from the fridge and allowed to return to room temperature. They were then placed onto a Mark-10 ESM303 compression testing apparatus with a loading cell of 500 N. They were compressed between two parallel plates at room temperature at a rate of 1.2 mm min−1. The compressional strength was taken as the stress at structural failure and the Young's modulus was determined from the gradient of linear region of the stress/strain curve.DSC measurements
DSC measurements were carried out on agar–MC hydrogel (1.0–1.0% w/v) using a NETZSCH DSC 214 Polyma differential scanning calorimeter. The hydrogel sample of approximately 100 mg was placed into a medium pressure steel crucible and sealed. An equal mass of water was used as a reference. The sample was heated from 10 °C to 100 °C with a heating rate of 2 °C min−1 then cooled from 100 °C to 10 °C at the same rate.Temperature stability
The freeze–thaw stability of agar–MC hydrogel (1.0–1.0% w/v) was investigated by preparation of three hydrogel samples of equal mass and shape. They were weighed, then frozen in a freezer at −18 °C for 24 hours, then removed from the freezer, placed in a sealed container and thawed at 30 °C using a thermostatic bath for one hour. The samples were reweighed after removal from the released aqueous phase to evaluate the syneresis. The high temperature stability was investigated by subjecting hydrogel samples of equal mass and surface area to two different high temperature environments. The first test involved placing a sample of agar hydrogel (2.0% w/v) and a sample of agar–MC hydrogel (1.0–1.0% w/v) into a furnace at 150 °C for 45 minutes whilst the second involved immersing a sample of each hydrogel into water (200 cm3) and autoclaving at 121 °C (Classic Prestige Medical autoclave, 105 kPa).SEM image analysis
Samples of MC solution (2.0% w/v), agar hydrogel (2.0% w/v) and agar–MC hydrogel (1.0–1.0% w/v) were mounted on a copper SEM stub, flash frozen in slush nitrogen (∼−210 °C) then transferred to the preparation stage at −140 °C where it was fractured with a blade that was cooled to the same temperature. Slushing reduces the N2 temperature by about 14 °C to −210 °C and minimises boiling upon sample freezing. The samples were then sublimed at −70 °C and 2–4 Pa for 7 min and transferred onto a cryo-SEM cool stage in the preparation chamber under vacuum. The sample was then fractured and coated with an electro-conductive coating (Pt) by using an integrated sputter coater. Finally, they were transferred into the SEM chamber of a Zeiss Evo 60 scanning electron microscope at −140 °C with an accelerating voltage of 15 kV.X-ray diffraction measurements
A sample of three hydrogels (2.0% w/v agar, 1.0–1.0% w/v agar–MC and 2.0% w/v MC) were flash-frozen in liquid nitrogen and then freeze-dried for 72 hours at −55 °C and 7 Pa. The dried samples were chopped into a powder and X-ray diffraction (XRD) analysis was performed using a Siemens D5000 X-ray diffractometer with Cu Kα radiation (0.151418 nm wavelength) with a 2θ range between 5° and 80°.Results and discussion
Mechanical properties of the agar–MC hydrogels
A two-component hydrogel comprising of agar and MC has been formulated in a ratio of 1![[thin space (1/6-em)]](https://www.rsc.org/images/entities/char_2009.gif) :
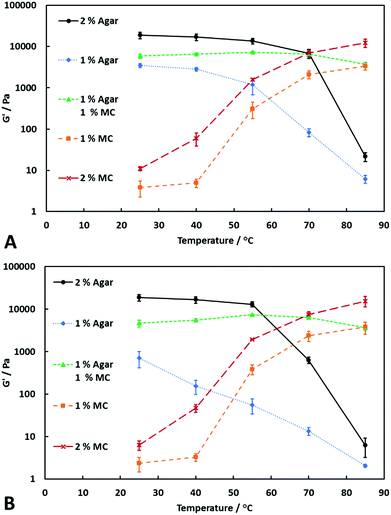
:![[thin space (1/6-em)]](https://www.rsc.org/images/entities/char_2009.gif) 1, with an overall polymer concentration of 2.0% w/v. Its storage modulus was compared with those of agar (1.0% and 2.0% w/v) and MC (1.0% w/v and 2.0% w/v) alone over a range of temperatures. The results shown in Fig. 1 demonstrate the differences between the storage modulus at varying temperatures and at constant shear stress (20 Pa and 62 Pa, respectively). From Fig. 1A and B, it can be seen that the storage modulus of the agar hydrogels decreases with increasing the temperature between 25 and 85 °C, showing a minimum at 85 °C because the latter is near the melting point of agar.8 As the shear stress was increased, the storage modulus of agar decreased. This was most noticeable at 70 °C, where the increased temperature has started to weaken the hydrogel. The increase in shear stress disturbs the agar polymer network and, combined with the elevated temperature, causes the large decrease in the storage modulus.
1, with an overall polymer concentration of 2.0% w/v. Its storage modulus was compared with those of agar (1.0% and 2.0% w/v) and MC (1.0% w/v and 2.0% w/v) alone over a range of temperatures. The results shown in Fig. 1 demonstrate the differences between the storage modulus at varying temperatures and at constant shear stress (20 Pa and 62 Pa, respectively). From Fig. 1A and B, it can be seen that the storage modulus of the agar hydrogels decreases with increasing the temperature between 25 and 85 °C, showing a minimum at 85 °C because the latter is near the melting point of agar.8 As the shear stress was increased, the storage modulus of agar decreased. This was most noticeable at 70 °C, where the increased temperature has started to weaken the hydrogel. The increase in shear stress disturbs the agar polymer network and, combined with the elevated temperature, causes the large decrease in the storage modulus.
MC hydrogels behaved oppositely to agar hydrogels, with the storage modulus increasing with increasing temperature, showing that the MC solution becomes a gel once heated above a certain temperature. For the grade of MC used in these experiments, the gelation temperature was between 40 and 55 °C. It is known that the gelation temperature of MC also varies with the MC concentration19–21 but this was not investigated in detail here. Furthermore, at the shear stresses investigated we did not observe weakening of the MC hydrogels. In fact, the storage modulus increased with increased shear stress. However, this is likely due to the hydrogel being held at a temperature above the gelation temperature for a longer period of time, as MC hydrogels continue to increase in strength over time when held above the gelling temperature.19
The two-component agar–MC hydrogel showed characteristics of both agar and MC, depending on the temperature. At the lower temperatures, its mechanical properties are dominated by the agar present, and at higher temperatures MC is the polymer contributing to the hydrogel strength. However, even at temperatures below the gelling point of MC, the two-component system shows an almost two-fold increase in storage modulus when compared with 1.0% w/v agar containing no MC, suggesting a synergistic effect between the two polymers.
The agar–MC hydrogel samples also showed resistance to an increased shear stress compared to 1.0% w/v agar hydrogel alone. The agar–MC hydrogel has a fairly constant storage modulus upon increasing the temperature from 25 °C up to nearly 90 °C with a shallow maximum around 55 °C; this is due to the temperature being above the gelling point of MC. The MC begins to gel, which reinforces the agar hydrogel network, increasing the storage modulus by between 25 and 100% when compared to the same hydrogel at 25 °C. At 70 °C, the agar–MC hydrogel's strength begins to slightly decrease which is likely to be due to the partial weakening of the agar network and by 85 °C the mechanical properties are dominated solely by the MC, showing a similar storage modulus to 1.0% w/v MC alone.
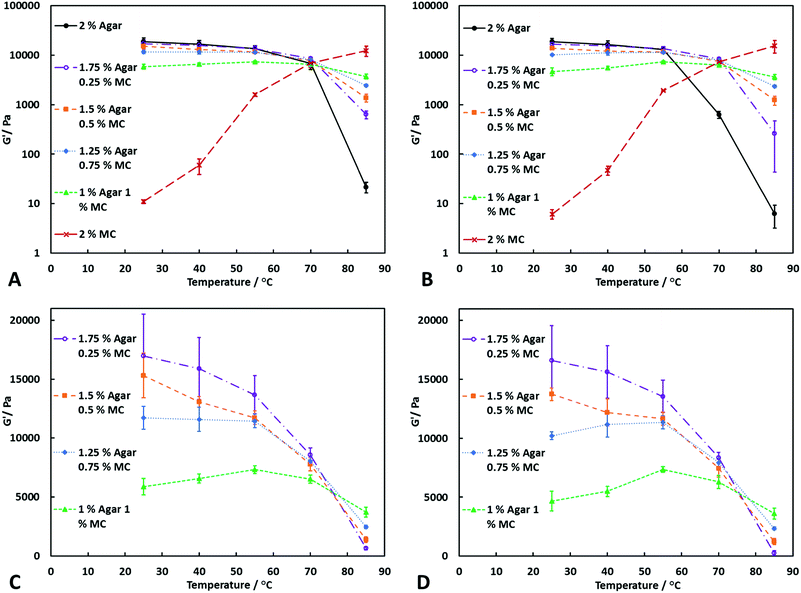
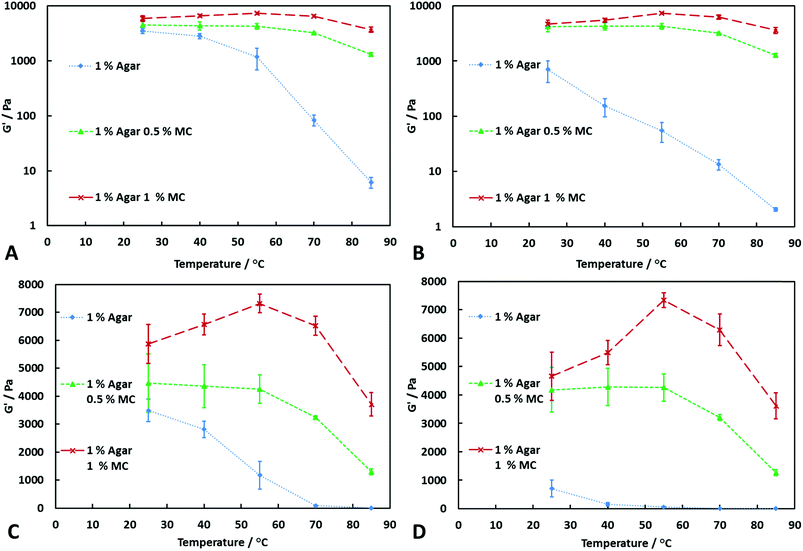
From Fig. 2A, it can be seen that at a shear stress of 20 Pa, the agar–MC hydrogels are significantly stronger than agar alone at 85 °C. At 70 °C, the two-component hydrogels are more resistant to increased shear stress than agar hydrogel alone, even when the concentration of MC is as low as 0.25% w/v, as shown in Fig. 2B. However, once the temperature reaches 85 °C, the low concentration of MC is unable to resist the increase in shear stress which results in a large decrease in the storage modulus. On the other hand, when the concentration of MC is 0.5% w/v or higher, the hydrogel can withstand the increase in shear stress due to the formation of a stronger polymer network. From Fig. 2A–B, it can be seen that varying the ratio of agar to MC at the same overall polymer concentration significantly changes the storage modulus over the whole temperature range. When the concentration of agar is much higher than MC, the storage modulus at low temperatures is high, but shows a larger decrease when the temperature is increased. As the concentration of agar is decreased and the concentration of MC is increased, the storage modulus of the hydrogel is decreased at low temperatures but increased at high temperatures. When the concentration of MC is high enough, a maximum in the storage modulus vs. temperature is seen at 55 °C. By varying the ratio of agar to MC, it is possible to tailor hydrogels with desired mechanical properties over a temperature range. Fig. 3A and B show that as upon increasing the concentration of MC mixed with agar, the storage modulus of the hydrogel increases at all temperatures compared at agar alone. Furthermore, it can be seen that the addition of MC significantly increases the resistance of the hydrogel to an increase in the shear stress. From Fig. 3C and D, the maximum G′ at 55 °C can clearly be seen when the concentration of MC is 1.0% w/v. Above 55 °C, G′ of the agar–MC hydrogels begin to slightly decrease due to the high temperature starting to disrupt the agar hydrogel network. The data suggests that the MC present reinforces nearly twice the agar polymer network at 1![[thin space (1/6-em)]](https://www.rsc.org/images/entities/char_2009.gif) :
:![[thin space (1/6-em)]](https://www.rsc.org/images/entities/char_2009.gif) 1 agar-to-MC ratio and makes it much less sensitive to the temperature with this effect being amplified at temperatures above the gelling point of the MC hydrogel.
1 agar-to-MC ratio and makes it much less sensitive to the temperature with this effect being amplified at temperatures above the gelling point of the MC hydrogel.
Uniaxial compressive tests
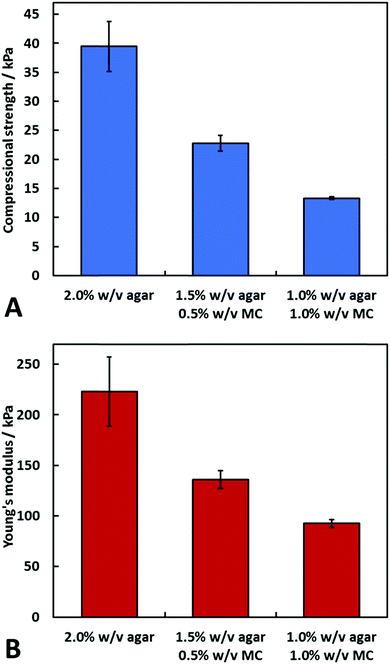
We have also investigated the mechanical properties of agar and agar–MC hydrogels through uniaxial compression tests. The samples were subjected to compression until structural failure which allowed for calculation of the compressional strength and Young's modulus. Fig. 4 shows that 2.0% w/v agar has a higher compressional strength and Young's modulus at room temperature. At this temperature, agar is the polymer dominating the mechanical properties as the temperature is below that of the gelation temperature of MC.DSC measurement
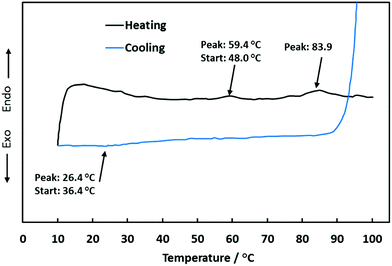
Fig. 5 shows a DSC thermogram for a sample of the agar–MC hydrogel. In the heating curve, two endothermic peaks were observed. The first peak has an onset temperature of 48.0 °C and a peak temperature of 59.4 °C and corresponds to the sol–gel transition of MC. The second peak, which corresponds to the gel–sol transition of agar, has an onset temperature of 71.0 °C and a peak temperature of 83.9 °C. The cooling curve shows a single exothermic peak which corresponds to the sol–gel transition of agar.MC is known to be a thermo-reversible hydrogel,26 however, no peak can be seen showing its gel–sol transition at low temperatures. The endothermic peak due to gelation of MC supports the assumption that, once MC begins to gel, it reinforces the agar hydrogel network, which in turn increases its mechanical properties resulting in the maximum G′ seen at 55 °C.
Thermal stability
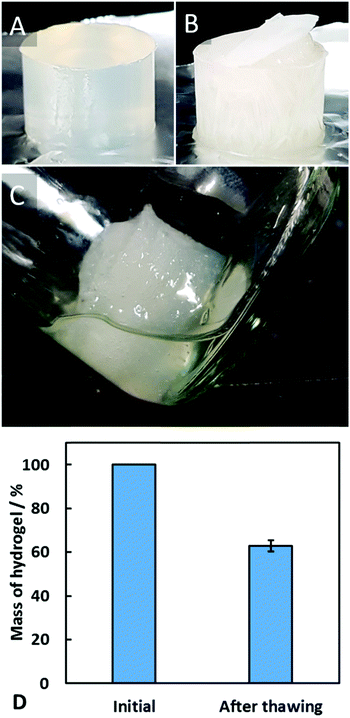
The freeze–thaw stability of agar–MC hydrogels was investigated by freezing the hydrogel at −18 °C for 24 hours, followed by subsequent thawing at 30 °C for 1 hour. After freezing, the structure of the sample had changed, and after thawing, there was syneresis of a viscous liquid from the hydrogel. After the sample had thawed, the hydrogel had decreased to 63 ± 3% of its original mass (see Fig. 6). This is likely to be due to the ice crystals formed on freezing thus physically disrupting the gel network, leading to a weaker gel upon thawing which enhances the syneresis to occur.The stability of the agar–MC hydrogels was also investigated at high temperatures. The first experiment was to immerse the hydrogel samples in water in a sealed container and then heat them up in an autoclave. The autoclave reaches a temperature of 121 °C (well above the melting point of agar) and operates at an elevated pressure of 105 kPa. The sample was left in the autoclave for a full heating and cooling cycle and then viewed afterwards. The appearance of the agar–MC hydrogel is shown in Fig. 7, where it is compared to an agar hydrogel sample undergoing the same treatment. Upon removal of the agar–MC sample from the autoclave, it was seen that it retained its shape whereas the agar melted and mixed with the water. This is due to the enhanced hydrogel network of MC formed before the agar network melts, then the agar gel network reforming upon cooling. The agar–MC hydrogel also becomes more turbid which is a characteristic of a sol–gel transition of MC.19
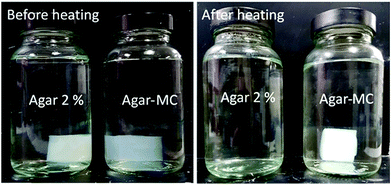
We also heated samples of agar–MC and agar hydrogels in a furnace at 150 °C, and compared their appearances. The samples were left in a furnace for 45 minutes at 150 °C, removed and then compared. Fig. 8 shows the appearance of the two hydrogel samples before and after heating. The agar–MC hydrogel retained its shape whereas the agar hydrogel melted. Again, an increase in turbidity of the agar–MC sample is observed due to the gelation of MC. Mass was lost from both samples due to the evaporation of water. However, the fact that the agar–MC sample retained its shape at this high temperature suggests that this two-component hydrogel could be used for high temperature templating. It could also be used in the development of new food products as it is made from food grade polymers that do not require salts to form a gel, i.e. they form physical gels and they keep their structure at the high temperatures used in cooking and high temperature food processing. It is also possible to encapsulate a flavour or taste enhancing compounds in hydrogels, thus making them attractive materials for food product development. Our further work will explore some of those possible uses of such agar–MC hydrogels.
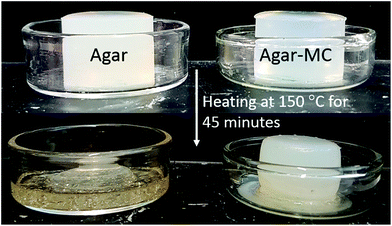 | ||
| Fig. 8 This shows the agar hydrogel (2.0% w/v) and the agar–MC hydrogel (1.0–1.0% w/v) before (top) and after (bottom) heating in a furnace at 150 °C for 45 minutes. | ||
Hydrogel microstructure analysis
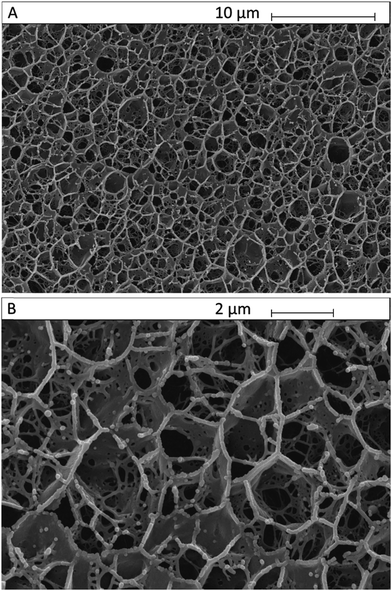
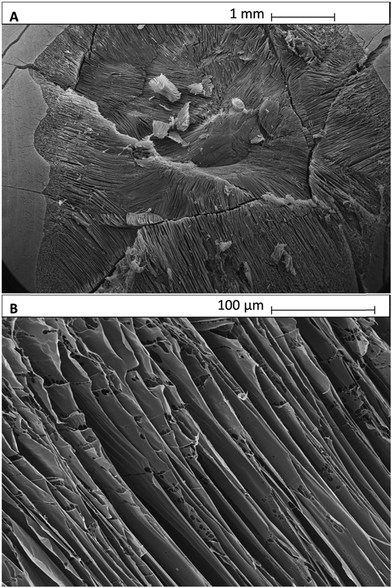
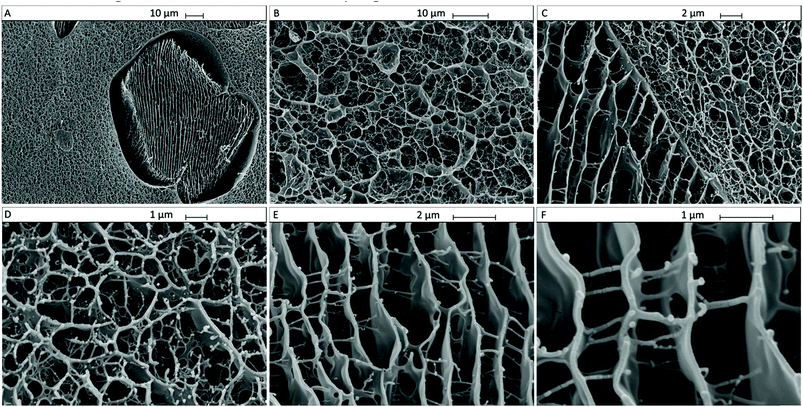
We analysed the microstructure of agar hydrogel (2.0% w/v), MC in solution (2.0% w/v) and agar–MC hydrogel (1.0–1.0% w/v) by imaging the flash-frozen and freeze-dried samples by SEM as shown below in Fig. 9, 10 and 11. The samples were flash-frozen in slush nitrogen and fractured with a blade held at −140 °C. Upon subliming at −70 °C for 7 minutes, the microstructures were revealed.The microstructure of MC hydrogel is known to be independent of the MC concentration.29 Furthermore, we did not observe any difference between 1.0% w/v and 2.0% w/v agar hydrogel morphology upon freeze-dying.
Fig. 9A and B display the microstructure of the agar hydrogel which shows a pentagonal pore structure as seen in the literature.30 A droplet of MC solution after flash-freezing, freeze-drying and fracturing is shown in Fig. 10A and B. It shows very well ordered layered sheet-like MC structures on a scale larger than 1 mm. The microstructure of the agar–MC hydrogels was then imaged in a very similar way and two distinct structures can be seen within the polymer network in Fig. 11. Regions of an agar-like network structure can be clearly seen in Fig. 11A, B and D. Although the network cells look more interconnected than those for agar alone in Fig. 9, their similarity indicates that those are likely agar-rich regions.
Enclosures with a very different structure co-existing with the agar-rich regions are also seen in Fig. 11A and C. Their structure is more reminiscent of the MC hydrogels as shown in Fig. 10A and B thus indicating that a MC-rich phase is also present in the agar–MC hydrogel. The sheet-like layered structure is similar to that of MC in Fig. 10, however the sheets are connected by fibers which are not seen when MC is alone. In some of these regions, there is an interface where the two structures of agar and MC-rich phases meet (Fig. 11C). They appear to be randomly distributed throughout the three-dimensional hydrogel structure, suggesting that the overall microstructure of the agar–MC-hydrogel is defined during the gelation of agar. The latter are likely to fortify the hydrogel which explains its superior mechanical properties compared to those of the agar and MC hydrogels alone.
XRD analysis
We obtained the XRD patterns of three freeze-dried hydrogel samples (2.0% w/v agar, 2.0% w/v MC and 1.0–1.0% w/v agar–MC) and the results are shown in Fig. 12. The diffraction pattern for MC is in agreement with other studies in the literature which have suggested that MC is semi-crystalline.31,32 The reduction in the intensity of the MC peaks after addition of agar indicates that agar interferes with the ordering of MC. Other studies have come to the same conclusion when investigating composites of MC and chitosan.32 Analogous XRD patterns have been seen for agar where it was concluded that crystallisation of agar did not occur during gelation.33,34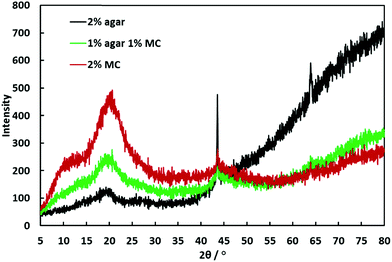 | ||
| Fig. 12 XRD analysis of freeze-dried agar hydrogel (2.0% w/v), freeze-dried MC solution (2.0% w/v) and freeze-dried agar–MC hydrogel (1.0–1.0% w/v). | ||
Conclusions
We have formulated a novel two-component hydrogel consisting of agar and MC with tailorable storage modulus over a range of temperatures. The agar–MC hydrogels show improved rheological properties over a temperature range of 25–85 °C. The storage modulus of the agar–MC hydrogel goes through a maximum when the temperature is 55 °C due to a sol–gel phase transition of MC present in the mixed hydrogel. Evidence of this transition was seen during DSC measurements. The addition of MC to agar showed an increase in storage modulus at temperatures both below and above the gelling point of MC. At temperatures above the melting point of agar, the mixed gel was still elastic with the rheological properties dominated by MC. SEM imaging of freeze-dried samples of agar–MC allowed us to reveal details of their microstructure. The mixed gel showed heterogeneous mixing, with randomly distributed MC-rich regions within an agar-rich continuous network. It was found that the mixed agar–MC gel was stable after being heated above 120 °C. At these temperatures agar alone melts, whereas the agar–MC hydrogel maintains its structure. The high melt-resistance of the two-component agar–MC hydrogels, along with the fact that both components are food grade polymers and do not require a salt for gelation, implies that they could be used in the food industry for baking or in high temperature templating of a range of porous and composite materials.Conflicts of interest
There are no conflicts to declare.Acknowledgements
B. T. acknowledges the financial support from EPSRC/Unilever CASE studentship for his PhD study. The authors appreciated the technical help from Mr Tony Sinclair at the University of Hull Microscopy Suite with the SEM sample preparation and imaging. We also thank Ahmed F. Albus and Zahraa Al-Mashaykhi for their help with sample preparation and XRD measurements.References
- J. Kopeček, Biomaterials, 2007, 28, 5185–5192 CrossRef PubMed.
- L. Zhang, K. Li, W. Xiao, L. Zheng, Y. Xiao, H. Fan and X. Zhang, Carbohydr. Polym., 2011, 84, 118–125 CrossRef CAS.
- M. Constantin, S.-M. Bucatariu, F. Doroftei and G. Fundueanu, Carbohydr. Polym., 2017, 157, 493–502 CrossRef CAS PubMed.
- S. Morariu, M. Bercea, M. Teodorescu and M. Avadanei, Eur. Polym. J., 2016, 84, 313–325 CrossRef CAS.
- M. Rutkevičius, G. H. Mehl, J. T. Petkov, S. D. Stoyanov and V. N. Paunov, J. Mater. Chem. B, 2015, 3, 82–89 RSC.
- J. P. Gong, Y. Katsuyama, T. Kurokawa and Y. Osada, Adv. Mater., 2003, 15, 1155–1158 CrossRef CAS.
- S. Liu and L. Li, ACS Appl. Mater. Interfaces, 2016, 8, 29749–29758 CAS.
- R. Armisén and F. Gaiatas, 4-Agar, in Handbook of Hydrocolloids, ed. G. O. Phillips and P. A Williams, Woodhead Publishing Limited, Cambridge, 2nd edn, 2009, ch. 4, pp. 82–107 Search PubMed.
- G. Sworn, 9-Gellan gum, in Handbook of Hydrocolloids, ed. G. O. Phillips and P. A Williams, Woodhead Publishing Limited, Cambridge, 2nd edn, 2009, ch. 9, pp. 204–227 Search PubMed.
- R. Mao, J. Tang and B. G. Swanson, Carbohydr. Polym., 2000, 41, 331–338 CrossRef CAS.
- M. H. Norziah, S. L. Foo and A. A. Karim, Food Hydrocolloids, 2006, 20, 204–217 CrossRef CAS.
- G. Sworn, 17-Xanthan Gum, in Food Stabilisers, Thickeners and Gelling Agents, ed. A. Imeson, Wiley-Blackwell, Hoboken, NJ, 2010, ch. 17, pp. 325–342 Search PubMed.
- S. Arnott, A. Fulmer, W. E. Scott, I. C. M. Dea, R. Moorhouse and D. A. Rees, J. Mol. Biol., 1974, 90, 269–284 CrossRef CAS PubMed.
- K. B. Guiseley, Carbohydr. Res., 1970, 13, 247–256 CrossRef CAS.
- A. Imeson, 3-Agar, in Food Stabilisers, Thickeners and Gelling Agents, ed. A. Imeson, Wiley-Blackwell, Hoboken, NJ, 2010, ch. 3, pp. 31–49 Search PubMed.
- P. Serwer, Electrophoresis, 1983, 4, 375–382 CrossRef CAS.
- P. C. Debergh, Physiol. Plant., 1983, 59, 270–276 CrossRef CAS.
- M. J. Cash and S. J. Caputo, 6-Cellulose Derivatives, in Food Stabilisers, Thickeners and Gelling Agents, ed. A. Imeson, Wiley-Blackwell, Hoboken, NJ, 2010, ch. 6, pp. 95–115 Search PubMed.
- P. L. Nasatto, F. Pignon, J. L. M. Silveira, M. E. R. Duarte, M. D. Noseda and M. Rinaudo, Polymers, 2015, 7, 777–803 CrossRef CAS.
- L. Li, P. M. Thangamathesvaran, C. Y. Yue, K. C. Tam, X. Hu and Y. C. Lam, Langmuir, 2001, 17, 8062–8068 CrossRef CAS.
- N. Sarkar, J. Appl. Polym. Sci., 1979, 24, 1073–1087 CrossRef CAS.
- M. Hirrien, C. Chevillard, J. Desbrières, M. A. Axelos and M. Rinaudo, Polymer, 1998, 39, 6251–6259 CrossRef CAS.
- K. Kobayashi, C.-I. Huang and T. P. Lodge, Macromolecules, 1999, 32, 7070–7077 CrossRef CAS.
- P. L. Nasatto, F. Pignon, J. L. M. Silveira, M. E. R. Duarte, M. D. Noseda and M. Rinaudo, Int. J. Polym. Anal. Charact., 2015, 20, 110–118 CrossRef CAS.
- J. R. Lott, J. W. McAllister, S. A. Arvidson, F. S. Bates and T. P. Lodge, Biomacromolecules, 2013, 14, 2484–2488 CrossRef CAS PubMed.
- J. Desbrières, M. Hirrien and M. Rinaudo, Carbohydr. Polym., 1998, 37, 145–152 CrossRef.
- B. C. Martin, E. J. Minner, S. L. Wiseman, R. L. Klank and R. J. Gilbert, J. Neural. Eng., 2008, 5, 221–231 CrossRef PubMed.
- Web-site of DOW Answer Center, https://dowac.custhelp.com/app/answers/detail/a_id/1180/related/1, accessed on 24/08/2017.
- J. R. Lott, J. W. McAllister, M. Wasbrough, R. L. Sammler, F. S. Bates and T. P. Lodge, Macromolecules, 2013, 46, 9760–9771 CrossRef CAS.
- A. S. Medin, PhD thesis, Uppsala University, 1995.
- N. Rangelova, L. Radev, S. Nenkova, I. M. Miranda Salvado, M. H. Vas Fernandes and M. Herzog, Cent. Eur. J. Chem., 2011, 9, 112–118 CAS.
- A. Pinottia, M. A. Garcia, M. N. Martino and N. E. Zaritzky, Food Hydrocolloids, 2007, 21, 66–72 CrossRef.
- M. Matsuo, T. Tanaka and L. Ma, Polymer, 2002, 43, 5299–5309 CrossRef CAS.
- Q. Cao, Y. Zhang, W. Chen, X. Meng and B. Liu, Int. J. Biol. Macromol., 2017 DOI:10.1016/j.ijbiomac.2017.08.134.
| This journal is © The Royal Society of Chemistry 2017 |

