 Open Access Article
Creative Commons Attribution 3.0 Unported Licence
Green synthesis of mesoporous anatase TiO2 nanoparticles and their photocatalytic activities
Sunderishwary S. Muniandya,
Noor Haida Mohd Kausb,
Zhong-Tao Jiang c,
Mohammednoor Altarawneh
 c and
Hooi Ling Lee
 *a
*a
aNanomaterials Research Group, School of Chemical Sciences, Universiti Sains Malaysia, Penang, Malaysia. E-mail: hllee@usm.my
bNano Hybrid Materials Group, School of Chemical Sciences, Universiti Sains Malaysia, Penang, Malaysia
cSurface Analysis and Materials Engineering Research Group, School of Engineering & Information Technology, Murdoch University, Murdoch, WA 6150, Australia
First published on 12th October 2017
Abstract
Titanium dioxide (TiO2) materials have been the focus of many promising applications due to their low-cost, availability and biocompatible properties. In this study, mesoporous anatase TiO2 nanoparticles were synthesised using a green chemistry approach. This visible-light active photocatalyst was prepared via a simple and solvent free precipitation method at low temperatures using titanium tetraisopropoxide (TTIP) as a precursor and soluble starch as the template. The effect of initial solution pH and concentration of TTIP on surface morphology and photocatalytic activities of TiO2 nanoparticles were evaluated. Based on the results obtained, the TiO2 nanocatalyst prepared using 0.01 mol of TTIP under basic conditions revealed the best photocatalytic activity. The as-synthesised nanoparticles were further characterised using X-ray powder diffraction (XRD), scanning electron microscopy (SEM) and nitrogen adsorption analysis (NAA). The XRD spectrum confirmed that the catalyst was composed of anatase tetragonal TiO2 phase. The Brunauer–Emmett–Teller (BET) surface area of 81.59 m2 g−1 proved the presence of mesopores (average pore size = 8.7 nm) which partially contributed to and catalysed the photodegradation process of methylene blue (MB) solution under sunlight. The effects of various parameters such as initial dye concentration, catalyst dosage and recyclability of the catalyst were evaluated to determine the best conditions. Results obtained suggest that TiO2 nanoparticles synthesised through the green chemistry approach under optimum conditions exhibited an effective photodegradation process of MB solution under sunlight.
1 Introduction
Titanium dioxide (TiO2) is one of the most extensively studied materials due to its harmless nature and good chemical and thermal stability.1 Titanium dioxide possesses high potential because of its availability and low cost. It is a binary metal oxide that exists in three different polymorphs; namely anatase, rutile and brookite. These polymorphs exhibit different bandgap energies with rutile TiO2 (3.0 eV), anatase TiO2 (3.2 eV) and brookite TiO2 (∼3.2 eV). In past decades, TiO2 has received great attention for applications such as self-cleaning, solar cells, gas sensors,2 anti-fogging, deodorisation and waste water remediation due to its superhydrophilic property.3 Among these applications, photocatalysis is considered to be the most practical due to its usage of sunlight to decompose organic pollutants.4,5 The mechanism involved in photocatalysis reaction exerted by semiconductors,6–8 mainly discussed the formation of free electrons and holes in the conduction and valance band region as explained in the literature.2,10,20,21Many methods such as sol gel route,9,10 hydrothermal,11 polyol synthesis,12 and precipitation13 had been reported in the synthesis of TiO2 nanoparticles (NPs). Among these methods, the sol–gel technique employed a low temperature process. However, the end product would contain high carbon content when organic reagents are used during the experiments. Hydrothermal methods have been used to synthesise metal oxides directly from solution but most of the earlier studies done on synthesis of TiO2 NPs using a hydrothermal method required high temperatures which resulted in the formation of polydispersed powders.12 The polyol process is the most well-known method among the production of metal oxides. Even though this process is able to control various particles property, it employs large amount of polyhydroxy alcohol (solvent) which makes this synthetic route environmentally unfavourable and unsafe. Up to this point in time, very little work has been reported on the synthesis of TiO2 NPs under the precipitation process using the green chemistry approach.
Green chemistry denotes the implementation of chemical processes and products to reduce the use of substances hazardous towards human and the environment.14 Non-toxic solvents, closed reactors, and harmless waste production are normally the factors used in order to reduce the impact on environment by easing waste disposal. Thus, a method can be recognised as a green technique if any previous method was altered according to the twelve principles of the ‘Green Chemistry Principles’.15 Designing a method, according to green chemistry principles, results in an economical, safer, non-toxic and simpler route of synthesis. Therefore, green synthesis of NPs is considered an improved approach as it is environmentally friendly, sustainable, and relatively reproducible and the end products are often more stable.16
In this article, the focus is on developing a green technique adopting the fast precipitation method at a low temperature to synthesise TiO2 Nanoparticles (NPs) using titanium tetraisopropoxide as the source of titanium, water as solvent and starch as template. It is postulated that this modified method minimises the impact on the safety of living organism and the environment. The effects of the pH and concentration of the precursor on TiO2 NPs and their potential on self-cleaning application were also explored.
2 Experimental
2.1 Materials
Titanium(IV) tetraisopropoxide, TTIP ≥97% purity (Sigma-Aldrich, Co., USA), soluble starch (System), ammonium hydroxide, NH4OH (Fluka Analyticals, Sigma-Aldrich, Co., Germany), purchased pure anatase, ≥99% (Sigma-Aldrich, Co., USA), methylene blue, MB (QREC, Grade AR, (Asia) Sdn. Bhd, Malaysia). All reagents were used as purchased and without further purification.2.2 Synthesis of TiO2 nanoparticles
The TiO2 NP was synthesised based on the ZnO synthesis work by Zhang and the co-workers16 with some modifications. In a typical procedure, soluble starch was dissolved in 150 mL of boiling distilled water. Then, 0.01 mol of titanium tetraisopropoxide (TTIP) was added into the starch solution under stirring for 5 min at 85 °C. Yellow solution with white precipitates were formed after adjusting the pH of solution to basic (pH 9.0)/neutral (pH 7.0)/acidic (pH 5.0) by slowly adding ammonium hydroxide (NH4(OH)) solution with constant stirring for 30 min. The resulting precipitate was centrifuged at 8500 rpm for 10 min, followed by several cycles of washing with distilled water and finally dried in an oven at 50 °C. The dried as-obtained powder was further calcined in air at 500 °C for 2 h to obtain TiO2 nanoparticles (NPs).2.3 Characterisations of TiO2 nanoparticles
The crystallinity and phase purity of the synthesised photocatalyst was analysed by powder X-ray diffraction (XRD) (PW 3040/60 X'PERT PRO, PANalytical) using CuKα (1.541 Å) radiation in the range 2θ = 10–90°. The specific surface area and pore size distribution studies were measured by nitrogen adsorption isotherms using a N2 adsorption analyser (NAA) (Micromeritics ASAP 2020 Surface Adsorption Porosimeter (SAP)). The Brunauer–Emmett–Teller (BET) and Barrett–Joyner–Halenda (BJH) models were used to estimate the surface area and pore size of the TiO2 NPs. The TiO2 NPs was further characterised by field emission scanning electron microscope (FESEM) (Leo Supra 50 VP Field Emission SEM) to determine its surface morphology. An acceleration electron voltage of 10 kV voltage was applied to obtain the FESEM images. Further analysis was carried out using high-resolution transmission electron microscopy (HRTEM) (TECNAI G2 20 S-TWIN, FEI) at 200 kV. X-ray photoelectron spectroscopy (XPS) was carried out using high resolution X-ray photoelectron spectroscopy Axis – Ultra DLD, XPS, Kratos with monochromatic AlKα (1486.6 eV), X-ray radiation (15 kV and 10 mA) and equipped with a hemispherical analyser which operated at 150 W. All the reported binding energy (BE) data were calibrated using the C 1s from C–H at 284.6 eV. Curve fitting was accomplished using CASAXPS (version 2.3.17) and a GL (30) Gaussian (70%)–Lorentzian (30%) profile, and the standard Shirley background was used for fitting the components.2.4 Evaluation of photocatalytic activities
The photocatalytic activities of the TiO2 NPs obtained were evaluated via the photocatalytic oxidation of methylene blue (MB) under sunlight irradiation. Prior to irradiation, 0.1 g of calcined TiO2 NPs was dispersed in 200 mL MB (6 mg L−1) and the solution was magnetically stirred for one hour in darkness to reach adsorption equilibrium. The MB solution with photocatalyst was exposed to sunlight (75–120 kLux) for two hours. During irradiation, 10 mL of the mixture was collected and centrifuged for every 15 min. The degradation efficiency of MB solution was analysed using UV-vis spectrometer (LAMBDA 25 UV/Vis Systems). Peaks were observed to be present between 600 to 700 nm. The conversion of MB solution can be calculated using the following equation:
 | (1) |
3 Results and discussion
3.1 XRD analysis
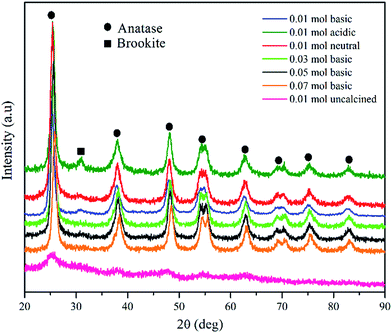
Fig. 1 illustrates the powder X-ray diffraction (XRD) pattern of synthesised TiO2 NPs under different conditions. The sharp peaks obtained at 2θ values 25.3, 37.9, 48.4, 53.9, 55.3, 62.7, 70.1, 74.0 and 82.4 (PDF 98-005-9309) were equivalent to the planes (101), (004), (200), (105), (211), (204), (116), (215) and (303), indicated tetragonal structure of anatase TiO2 nanoparticles. However, for TiO2 NPs synthesised under acidic condition (pH 5), a weak diffraction peak at 2θ = 31° (PDF 98-010-5395) due to (121) face of brookite phase with orthorhombic crystalline structure was observed. Besides, for uncalcined TiO2 powder, a very broad peak around 25.5° was attributed to the characteristic diffraction peak of the amorphous state of TiO2. Once the as-prepared TiO2 powder was calcined, the intensity of XRD peaks became visible confirming that the TiO2 powder underwent a calcination process. This confirms the occurrence of a transition from amorphous to crystalline anatase phase.The average crystallite size, d-spacing, full-width at half maximum (FWHM) were determined using Rietveld refinement (Highscore Expert software). The influence of the concentration of TTIP and pH of initial solution on the crystallite sizes of the TiO2 samples were listed in Table 1. The results show that with increasing TTIP concentration and reduction in the initial solution pH, the FWHM of the diffraction peak decreases and become narrower suggesting that the average crystallite size has become bigger correspondingly. This indicates that the enhancement of the crystallinity, stems from the increment of the crystalline volume ratio due to the size enlargement of the nuclei.17
| Samples | 2θ (degree) | d-spacing | FWHM | Crystallite size (nm) | GOF |
|---|---|---|---|---|---|
| 0.01 mol basic | 25.4 | 3.49 | 0.980 | 8.9 | 1.90 |
| 0.01 mol neutral | 25.3 | 3.52 | 0.969 | 11.6 | 1.89 |
| 0.01 mol acidic | 25.5 | 3.49 | 0.831 | 12.2 | 1.26 |
| 0.03 mol basic | 25.6 | 3.47 | 0.907 | 14.2 | 1.89 |
| 0.05 mol basic | 25.7 | 3.48 | 0.839 | 14.3 | 1.46 |
| 0.07 mol basic | 25.9 | 3.44 | 0.824 | 15.1 | 1.99 |
3.2 N2 adsorption and desorption analysis
The N2 adsorption–desorption isotherms of the as-obtained TiO2 NPs synthesised using different concentration of TTIP and initial solution pH are displayed in Fig. 2(a). Except for purchased pure anatase powder, all the curves exhibited the Type IV isotherm with H3 hysteresis loop of steep condensation at P/P0 = 0.4–0.6, indicating existence of small mesopores. Isotherms with type H3 hysteresis loop suggest the presence of irregular long, slit-like narrow pores according to IUPAC classification. However, the condensation steep shifted to high relative pressure P/P0 = 0.9 − 1.0, suggesting the occurrence of macropores.16 The Barrett–Joyner–Halenda (BJH) pore size distribution for all synthesised samples as shown in Fig. 2(b), displayed the bimodal pore size distribution. As-prepared TiO2 NPs (0.01 mol TTIP, pH 9) without calcination has the lowest average pore diameter of 3.4 nm with narrow distribution. This narrow pore size distribution remained with a slight increase in pore size (3.7 nm) after underwent calcination process. When the concentration of TTIP increased to 0.03 mol, 0.05 mol and 0.07 mol, the mean pore size increased to 4.8 nm, 5.5 nm and 6.5 nm, respectively with a broadened pore size distribution.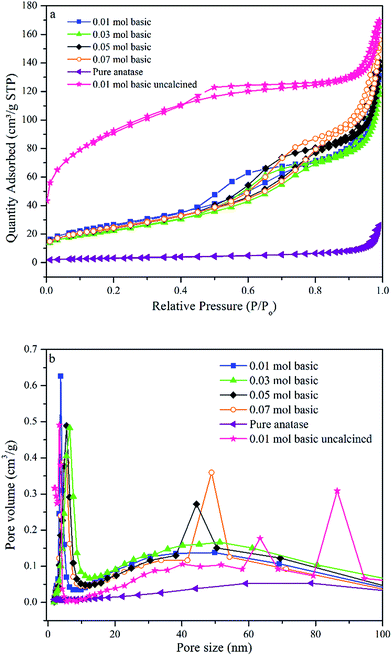 | ||
| Fig. 2 (a) N2 adsorption/desorption isotherm and (b) BJH pore size distribution TiO2 NPs synthesised under different initial pH and concentration of TTIP. | ||
It is also interesting to note that Brunauer–Emmett–Teller (BET) specific surface area also changed with the amount of precursor used as shown in Table 2. It was observed that, surface area changed from 87.2 to 78.5 m2 g−1, which indicates that the increase in concentration of precursor decreases the surface area and subsequently resulting in an increase of the particle size of the samples. Moreover, the surface area of uncalcined TiO2 was decreased from 309.7 to 87.2 m2 g−1 when the sample was introduced with high heating treatment. This is an indication of removal of organic template (starch) resulting in enlargement of pore size, which led to the decrease in surface area.18,19 Also, it was verified that all the synthesised samples revealed higher BET surface area as compared to pure anatase nanopowder (10.4 m2 g−1).
| Concentration of precursor TTIP (mol) | Initial solution pH | BET (m2 g−1) | Crystallite size (nm) | k (min−1) | R2 |
|---|---|---|---|---|---|
| Pure anatase powder | — | 10.4 | — | 0.079 | 0.997 |
| 0.01 | 9.0 | 87.2 | 8.9 | 0.169 | 0.996 |
| 0.01 | 7.0 | 81.6 | 11.6 | 0.048 | 0.976 |
| 0.01 | 5.0 | 72.9 | 12.2 | 0.036 | 0.979 |
| 0.03 | 9.0 | 80.8 | 14.2 | 0.028 | 0.984 |
| 0.05 | 9.0 | 80.1 | 14.3 | 0.016 | 0.980 |
| 0.07 | 9.0 | 78.5 | 15.1 | 0.015 | 0.977 |
3.3 UV-visible diffuse reflectance spectroscopy
The absorption spectra of all TiO2 NPs synthesised samples using various concentrations of TTIP and different initial solution pH are shown in Fig. 3(a). A significant red shift in the band gap of TiO2 NPs synthesised using 0.01 mol TTIP under basic condition were observed from the variation of (αhν)2 with photon energy (hν) compared to other samples. The extrapolated line drawn (Fig. 3(b)) for pure anatase and synthesised TiO2 NPs corresponds to the bandgap of 3.20 and 3.00 eV, respectively. This suggests that the optical bandgap of the TiO2 NPs has been reduced substantially compared to purchased pure anatase. In addition, e− and h+ pairs can be generated, even though the particle is irradiated with longer wavelength-visible light.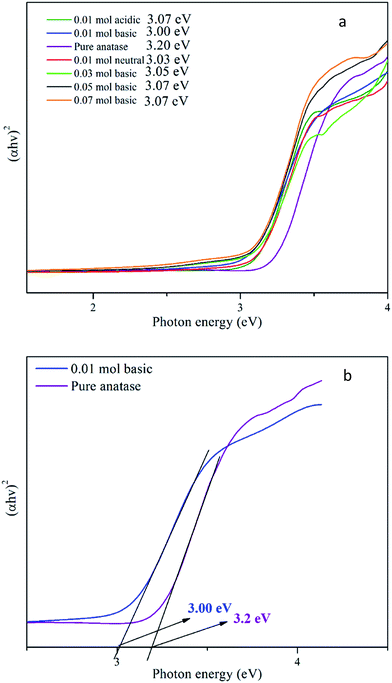 | ||
| Fig. 3 (a) Bandgap of TiO2 NPs synthesised using various concentration of TTIP and initial pH solution (b) compared bandgap spectra of synthesised sample and pure anatase. | ||
Also, as shown in Fig. 3(a), the bandgaps of pure anatase, 0.01 mol (basic), 0.01 mol (neutral), 0.01 mol (acidic), 0.03 mol, 0.05 mol, 0.07 mol were determined to be 3.20, 3.00, 3.03, 3.07, 3.05, 3.07, and 3.07 eV, respectively. Therefore, by increasing the initial pH solution to basic the bandgaps of the products decreases accordingly. The decrease of bandgap could be due to the localized gap states induced by Ti3+ self-doping. This result also indicates that the concentration of Ti3+ in the TiO2 products increased with increasing pH of initial solution (basic).37 The existence of defects in the self – doped TiO2 samples can further be confirmed by XPS analysis later.
3.4 Structures and morphologies
Fig. 4 displays the FESEM images of synthesised TiO2 NPs under different concentration of TTIP and initial solution pH. FESEM image of Fig. 4(a) belongs to uncalcined TiO2 sample where the particles are large and agglomerated. All samples exhibited irregular spherical structures with rougher surfaces after the calcination process because calcination would enhance porous morphology for the as-synthesised TiO2 NPs. From Fig. 4(b)–(d), it was observed that the particle size decreased as the pH of initial solution increased. Fig. 4(b) shows the morphology of sample synthesised using 0.01 mol TTIP under acidic condition (pH 5) has particle size of 99.2 ± 6.7 nm. When the pH of initial solution further increased to basic (pH 9), the particle size reduced drastically to 64.19 ± 2.6 nm. This is further confirmed with the HRTEM image (insert of Fig. 4(d)) which indicated that the size of synthesised TiO2 NPs is in the nano range (20–70 nm). On the other hand, enlargement of particle size can be observed in Fig. 4(e) as the concentration of precursor was increased to 0.07 mol with diameter 80.20 ± 3.3 nm. This is due to enhanced coagulation and sintering resulting from the large concentration of TiO2 nuclei generated at high TTIP precursor concentrations.20,21Besides, the high-resolution SEM images could also give information on the meso or macroscopic properties. Fig. 4(f) demonstrates the extension of the irregular parallel-arrayed long macro and mesoscopic channels through the material from the side view of the sample. Such open ended tube like channels could serve as ideal transport routes for introducing liquid phase into the interior of the framework of TiO2.18–21
3.5 Possible formation mechanism of mesoporous TiO2
Although the exact formation mechanism of the mesoporous TiO2 particles is not very clear, it is postulated that the soluble starch plays a key role in the formation of the mesoporous structures. Since starch is a polysaccharide carbohydrate, it can solubilise well in the boiling water. A dense formed when the starch granules swelled and burst, and the smaller amylose molecules started leaching out of the granules. Nucleation and initial crystal growth starts to take place when the precursor (Ti4+) diffuse and form complexes with amylose molecules near the interspaces between swollen starch microspheres. In most cases, the van der Waals interactions between the surface molecules of the nanocrystallites represent the driving force for self-assembly, and then TiO2 can be assembled to form compact uniform nanoparticles around the inflated starch granules. After calcination at 500 °C for two hours, the swollen starch gel granule template was removed leaving mesoporous structures around the TiO2 particles as illustrated in Scheme 1.16,22Meanwhile, the reactions for the formation of anatase TiO2 NPs are predicted as below:23
Hydrolysis:
| Ti(OCH(CH3)2)4 + 4H2O → Ti(OH)4 + 4(CH2)2CHOH | (2) |
Condensation:
| Ti(OH)4 → TiO2·xH2O + (2 − x)H2O | (3) |
Crystallisation via calcination:
| TiO2·xH2O → TiO2 (anatase) | (4) |
TiO2 nanoparticles were formed when titanium isopropoxides underwent hydrolysis and condensation. Initially, the hydrolysis process of titanium isopropoxides in an aqueous media occurred and titanium hydroxides (Ti(OH)4) was formed as an intermediate as shown in eqn (2). Ti(OH)4 is usually not stable and hence, it would go through the condensation process to produce amorphous hydrous oxide precipitates (TiO2·xH2O) as stated in eqn (3). The formed TiO2·xH2O precipitates were then subjected to the calcination process at 500 °C to remove the water molecules to form the anatase crystalline TiO2 NPs (eqn (4)) which were confirmed in the XRD pattern earlier.
3.6 XPS analysis
XPS analysis was further performed to investigate the chemical states of Ti and O in the synthesised TiO2 NPs. The XPS spectrum Ti, O and C element without any impurities for TiO2 NPs is shown in Fig. 4. The XPS spectra of Ti 2p and O 1s in Fig. 5(a) and (b) confirmed the chemical compositions of TiO2. For the Ti 2p spectra, two primary peaks are attributed to the characteristic Ti 2p1/2 and Ti 2p3/2 peaks of Ti4+. The symmetric curve with a binding energy located at 458.7 and 464.3 eV is in agreement with that of Ti4+ 2p3/2 and Ti4+ 2p1/2 in TiO2, respectively.24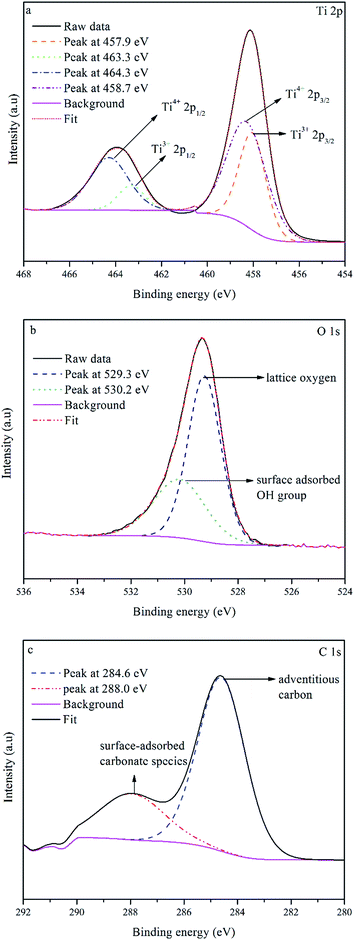 | ||
| Fig. 5 High-resolution XPS spectra of (a) Ti 2p, (b) O 1s and (c) C 1s of synthesised TiO2 NPs using 0.01 mol TTIP under basic condition. | ||
Besides, the Ti 2p peaks were deconvoluted into another two peaks: Ti3+ 2p3/2 at 457.9 eV and Ti3+ 2p1/2 at 463.3 eV which can be claimed as self-doped TiO2 with the presence of Ti3+. Zhou et al.25 and Mai W. et al.26 reported that TiO2 surface defects (Ti3+) played a significant role as they are active sites for oxygen adsorption and for trapping the electron to prevent the recombination of electrons and holes. In addition, surface Ti3+ sites also reduced the bandgap of TiO2 NPs and provided the unique activity and selectivity in the target reactions at relatively high wavelengths. Ti4+ reduction to Ti3+ is usually accompanied by vacuum annealing or thermal treatment (calcination). Self-doped TiO2 can also be generated by the carbon formed from pyrolysis of titanyl organic compounds. In the calcination process, Ti4+ ions accept electrons from these reducing gases or lattice oxygens which are usually removed from stoichiometric TiO2. At low temperature (300 °C), hydrogen interacted physically with adsorbed oxygen on the surface of TiO2. When the thermal temperature was raised higher than 300 °C, electrons were transferred from the H atoms to the O atoms in the lattice of TiO2. Then, the oxygen vacancies were formed when the O atom left with the H atom in the form of H2O. The interface between H2 and TiO2 progressed more significantly as the calcination temperature increased up to 450 °C, in which the electrons transferred from oxygen vacancies to Ti4+ ions, and then Ti3+ ions were formed. In this study, the synthesised TiO2 NPs was calcined at 500 °C, hence, more Ti3+ ions were produced rather than formation of oxygen vacancies (where the oxygen vacancy XPS peaks invisible in the result obtained). Meanwhile, the possible mechanism for the reduction reaction caused by the pyrolysis of titanyl organic compounds is that the carbon from organic component carbonizing could reduce Ti4+ to Ti3+ at high temperature. Basically, the reduction process of Ti4+ to Ti3+ takes place due to the reduction by electron donators such as H2, C, or lattice oxygen in TiO2.25 In the O 1s spectrum, only two peaks at binding energies 529.3 eV, and 530.2 eV are observed which are attributed to lattice oxygen and surface adsorbed OH group.27
The C 1s spectrum (Fig. 5(c)) includes a strong peak at 284.6 eV and a shoulder at 288.0 eV. These features correspond to two forms of carbon species in the sample. The peak at 284.6 eV on the XPS spectra is associated with elemental carbon from organic impurities in the environment that were adsorbed onto the surface of TiO2 and the peak at 288.0 eV is associated with surface-adsorbed carbonate species resulting from carbon residues on the surface of TiO2.28 Besides, it is also proven that TiO2 NPs synthesised showed no carbon doped material originated from the starch, since peak 282.0 eV which assigned to Ti–C bond is absent in the obtained XPS spectrum. Thus, from the XPS result, self-doped TiO2 NPs is the possible factor that the photocatalytic activity occurred near to visible range than at UV range.
3.7 Photocatalytic activity and kinetic studies of TiO2 NPs
 | (5) |
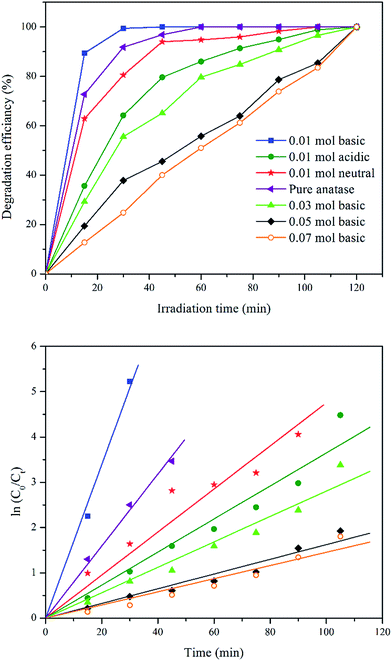 | ||
| Fig. 6 Degradation efficiency and first-order kinetics for TiO2 NPs synthesised using different TTIP concentration and initial solution pH. | ||
According to Table 2, the activity of the synthesised TiO2 photocatalyst decreased in order 0.01 mol basic > purchased pure anatase > 0.01 mol neutral > 0.01 mol acidic > 0.03 mol basic > 0.05 mol basic > 0.07 mol basic. The photoreactivity experiments have shown that MB photodegradation depends on the particle size of the TiO2 powders. Since the concentration of TTIP increased from 0.01 mol to 0.07 mol and the initial solution pH reduced from 9.0 (basic) to 5.0 (acidic), the degradation rate reduced from 0.169 to 0.015 min−1 and from 0.169 to 0.036 min−1, respectively. These results suggest that as we increased the concentration of TTIP and reduced the initial solution pH, incomplete nucleation occurred due to supersaturation of solution which led to the increase in particle size and hence, decrease in the specific surface area of as-synthesised powder, indirectly reducing the photocatalytic degradation efficiency of MB solution. Besides, an increase in crystallite size of synthesised TiO2 NPs under various concentrations of TTIP and initial solution pH (obtained from XRD data), reduces the photocatalytic activity.18,29
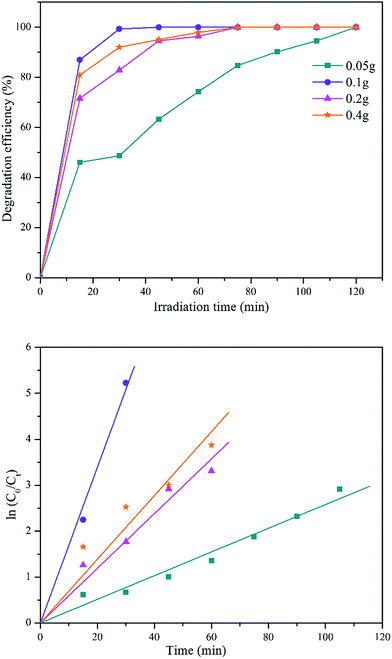 | ||
| Fig. 7 Effect of catalyst dosage plot of MB removal percentage against irradiation time using different catalyst dosage and its first-order kinetic plots. | ||
| Catalyst dosage (g) | k (min−1) | R2 |
|---|---|---|
| 0.05 | 0.026 | 0.9870 |
| 0.1 | 0.169 | 0.9967 |
| 0.2 | 0.059 | 0.9860 |
| 0.4 | 0.069 | 0.9757 |
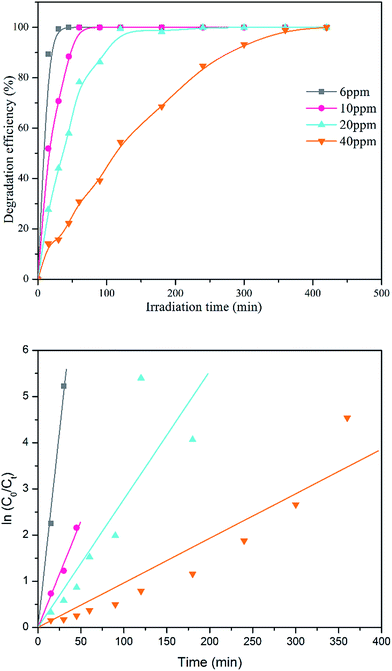 | ||
| Fig. 8 Degradation efficiency of different initial concentration of MB solution and its first-order kinetic model plot. | ||
| Initial dye concentration (ppm) | k (min−1) | R2 |
|---|---|---|
| 6 | 0.169 | 0.9967 |
| 10 | 0.046 | 0.9934 |
| 20 | 0.028 | 0.9757 |
| 40 | 0.009 | 0.9765 |
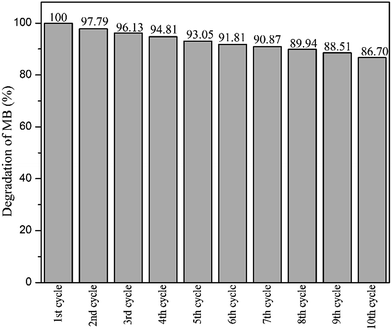
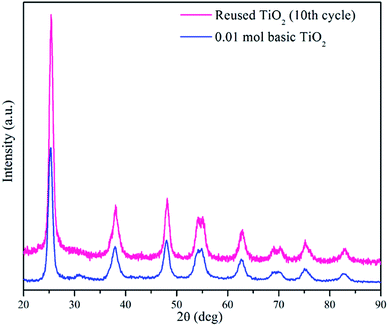
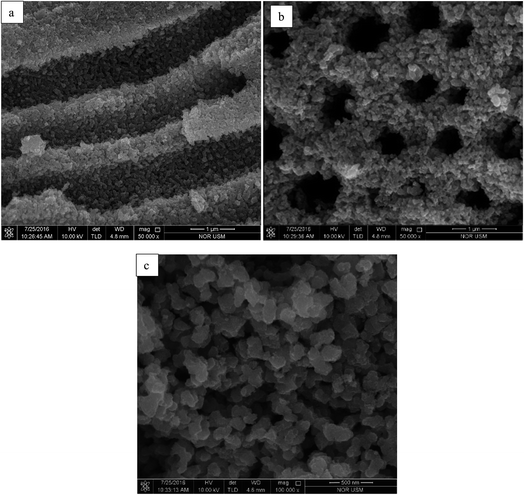
After ten cycles of reusability test, TiO2 NPs were analysed using XRD and FESEM to determine its phase, porosity and morphology stability. Fig. 10 showed XRD spectra of recycled TiO2 NPs for ten times and freshly synthesised TiO2 NPs. Based on the Fig. 10, synthesised TiO2 NPs remained same as in anatase phase after ten washings. As it can be seen, the intensity of the peak belongs to anatase phase 2θ = 25.6° increased due to the heat treatment introduced after washing process for every cycle for overnight. Generally, heat treatment at high temperature could induce the crystallinity and phase transition of metal oxides.36,37 In this case, only increase in crystallinity was observed as the temperature used for each cycle was 100 °C. FESEM was used to analyse the surface morphology and porosity of TiO2 NPs after ten recycles. Fig. 11(a–c) showed the ordered TiO2 porous structures at different magnifications after 10 cycles of photocatalytic activities. The reused TiO2 NPs still exhibited irregular parallel-arrayed long macro and mesoscopic channels through the material from the side view of the sample. No changes were observed on the walls of the TiO2 NPs since TiO2 surface was composed of pores. Besides, the particle size of recycled of TiO2 NPs increased slightly to 68.83 ± 4.4 nm compared to the freshly synthesised TiO2 NPs (64.19 ± 2.6 nm). The slight increase in particle size might cause by the heating process in overnight during every cycle.38 Hence, we can conclude that the reusability test using boiling water in the washing process does not affect the stability of the TiO2 NPs in term of morphology, phase and porosity of the metal oxide.
3.8 Photocatalytic reaction mechanism of Ti3+ surface defects
TiO2 with surface defects enhances the photocatalytic activity by introducing a local state at the bottom of the conduction band (CB) in the range of 0.75 eV–1.18 eV so that it extends the photoresponse of TiO2 from UV to visible light region. As a kind of defect, Ti3+ acts as an electron trap and results in the reduction of an electron hole pair recombination rate, thereby the subsequent reactions caused by the electrons and holes were dramatically improved.39 In this case, electrons donors reacted with holes. The electron can be trapped by Ti4+ to generate an isolated Ti3+ ion as shown in eqn (6). In the presence of O2, the Ti3+ sites easily react with O2, leading to the formation of radicals such as ˙O2−, HO2˙, and ˙OH as shown in eqn (7) and (8). These ˙OH and O2˙− species are able to degrade the MB molecules in solution. These ˙OH and O2˙− species are able to assist in the degradation of the MB molecules in solution. ˙OH species reacts with H+ ion to produce hydrogen peroxide (H2O2) as stated in eqn (9). The H2O2 is then reacted with the electron (ecb−) from TiO2 and subsequently increases the concentration of ˙OH radical to enhance the degradation process as shown in eqn (10).Meanwhile, the photogenerated holes due to transition of electron from valance band (VB) to the local state by Ti3+ have strong oxidation ability and can directly degrade MB to produce less harmful products such as water and carbon dioxide.40,41 The charge transfer processes occurred in TiO2 with surface defect may be as follows:38–41
| e−cb + Ti4+OH → Ti3+OH | (6) |
| Ti3+OH + O2 → Ti4+OH +˙O−2 | (7) |
| ˙O−2 + H+ → HO2˙ | (8) |
| HO2˙ + H+ → H2O2 | (9) |
| H2O2 + e−cb → ˙OH + OH− | (10) |
4 Conclusions
This study outlined the development of TiO2 nanoparticles via green technique. Active mesoporous anatase TiO2 NPs with small crystallite size (9 nm) was successfully synthesised using titanium tetraisopropoxide (TTIP) as the precursor, water as the solvent, and starch as the template using a low temperature precipitation method. The photocatalytic activities of prepared TiO2 photocatalyst were evaluated using methylene blue (MB) aqueous solution at 6 ppm. The results clearly indicated that the sample synthesised using 0.01 mol TTIP under basic condition has smaller particle sizes (64.19 ± 2.6 nm) and higher specific area (87.2 m2 g−1) which contributed to better photocatalytic performance. XPS analysis indicates that TiO2 NPs is active at near to visible range than the UV range is highly attributed to self-doped (Ti3+) of TiO2 than the carbon-doped from starch employed in this green method. It was found that degradation kinetics of MB fitted the Langmuir–Hinselwood first order kinetics. The rate of photodegradation of MB solution decreased when the concentration of precursor increased and the initial pH of solution decreased. The optimum condition for photodegradation of MB solution at 6 or 10 ppm MB solution is by using 0.1 g TiO2 NPs synthesised using 0.01 mol TTIP under basic condition. Besides, synthesised TiO2 NPs revealed high stability against photodegradation process as it can be recycled up to 10 cycles. The method developed in this work is fast and environmentally friendly for the preparation of mesoporous TiO2 NPs powders with good photocatalytic activities.Conflicts of interest
There are no conflicts to declare.Acknowledgements
This work was financially supported by the USM Research University Individual Grant (RUI: 1001/PKimia/811265).Notes and references
- Y. Ju, M. Wang, Y. Wang, S. Wang and C. Fu, Electrical properties of amorphous titanium oxide thin films for bolometric Application, Adv. Condens. Matter Phys., 2013, 100 Search PubMed
.
- S. Qiu and S. J. Kalita, Synthesis, processing and characterization of nanocrystalline titanium dioxide, Mater. Sci. Eng., A, 2006, 327, 435–436 Search PubMed
.
- W. A. Daoud and W. S. Tung, Self-cleaning fibers via nanotechnology – a virtual reality, J. Mater. Chem., 2011, 21, 7858–7869 RSC
.
- D. Tang and G. Zhang, Ultrasonic-assistant fabrication of cocoon-like Ag/AgFeO2 nanocatalyst with excellent plasmon enhanced visible-light photocatalytic activity, Ultrason. Sonochem., 2017, 37, 208–215 CrossRef CAS PubMed
.
- Z. Wan, G. Zhang, X. Wu and S. Yin, Novel visible-light-driven Z-scheme Bi12GeO20/g-C3N4 photocatalyst: oxygen-induced pathway of organic pollutants degradation and proton assisted electron transfer mechanism of Cr(VI) reduction, Appl. Catal., B, 2017, 207, 17–26 CrossRef CAS
.
- M. Pelaez, N. T. Nolan, S. C. Pillai, M. K. Seery, P. Falaras and A. G. Kontos, et al., A review on the visible light active titanium dioxide photocatalysts for environmental applications, Appl. Catal., B, 2012, 125, 3331–3349 CrossRef
.
- D. Wu, M. Long, J. Zhou, W. Cai, X. Zhu and C. Chen, et al., Synthesis and characterization of self-cleaning cotton fabrics modified by TiO2 through a facile approach, Surf. Coat. Technol., 2009, 203, 3728–3733 CrossRef CAS
.
- M. Montazer and E. Pakdel, Functionality of nano titanium dioxide on textiles with future aspects: focus on wool, J. Photochem. Photobiol., C, 2011, 12, 293–303 CrossRef CAS
.
- C. Colleoni, M. R. Massafra and G. Rosace, Photocatalytic properties and optical characterization of cotton fabric coated via sol–gel with non-crystalline TiO2 modified with poly(ethylene glycol), Surf. Coat. Technol., 2012, 207, 79–88 CrossRef CAS
.
- K. Kądzioła, I. Piwoński, A. Kisielewska, D. Szczukocki, B. Krawczyk and J. Sielski, The photoactivity of titanium dioxide coatings with silver nanoparticles prepared by sol–gel and reactive magnetron sputtering methods – comparative studies, Appl. Surf. Sci., 2014, 288, 503–512 CrossRef
.
- Z. Tan, K. Sato and S. Ohara, Synthesis of layered nanostructured TiO2 by hydrothermal method, Adv. Powder Technol., 2014, 26, 296–302 CrossRef
.
- S. K. Tripathy, T. Sahoo, M. Mohapatra, S. Anand and Y. T. Yu, Polyol-assisted synthesis of TiO2 nanoparticles in a semi-aqueous solvent, J. Phys. Chem. Solids, 2009, 70, 147–152 CrossRef CAS
.
- J. Morales, A. Maldonado and M. D. L. Olvera, Synthesis and characterization of nanostructured TiO2 anatase-phase powders obtained by the homogeneous precipitation method, 10th International Conference on Electrical Engineering, Computing Science and Automatic Control (CCE), Mexico City, 30 September–4 October 2013, pp. 391–394 Search PubMed
.
- M. N. Nadagouda, Green synthesis of nanocrystals and nanocomposites, Mod. Aspects Bulk Cryst. Thin Film Prep., 2012, 395–412 CAS
.
- A. K. Maratha, Green technique-solvent free synthesis and its advantages, Int. J. Res. Ayurveda Pharm., 2011, 2, 1079–1086 Search PubMed
.
- G. Zhang, X. Shen and Y. Yang, Facile synthesis of monodisperse porous ZnO spheres by a soluble starch-assisted method and their photocatalytic activity, J. Phys. Chem. C, 2011, 115, 7145–7152 CAS
.
- M. Gharagozlou, Influence of calcination temperature on structural and magnetic properties of nanocomposites formed by Co-ferrite dispersed in sol–gel silica matrix using tetrakis (2-hydroxyethyl) orthosilicate as precursor, Chem. Cent. J., 2011, 5, 19 CrossRef CAS PubMed
.
- D. Zhang and G. Li, Al2O3-enhanced Macro/Mesoporous Fe/TiO2 for Breaking Down Nitric Oxide, Chem., Emiss. Control, Radioact. Pollut. Indoor Air Qual., 2014, 2011, 2–14 Search PubMed
.
- E. Y. Kim, D. S. Kim and B. T. Ahn, Synthesis of mesoporous TiO2 and Its application to photocatalytic activation of Methylene Blue and E. coli, Bull. Korean Chem. Soc., 2009, 30, 193–196 CrossRef CAS
.
- X. Wang, J. C. Yu, C. Ho, Y. Hou and X. Fu, Photocatalytic activity of a hierarchically macro/mesoporous titania, Langmuir, 2005, 21, 2552–2559 CrossRef CAS PubMed
.
- C. S. Kim, K. Nakaso, B. Xia, K. Okuyama and M. Shimada, A new observation on the phase transformation of TiO2 nanoparticles produced by a CVD method, Aerosol Sci. Technol., 2005, 39, 104–112 CrossRef CAS
.
- L. Q. Tang, W. Ni, H. Y. Zhao, Q. Xu and J. X. Jiao, Preparation of macroporous TiO2 by starch microspheres template with assistance of supercritical CO2, BioResources, 2009, 4, 38–48 CAS
.
- S. Mahshid, Synthesis of TiO2 nanoparticles by hydrolysis and peptization of titanium isopropoxide solution, J. Mater. Process. Technol., 2007, 189, 296–300 CrossRef CAS
.
- B. Bharti, S. Kumar, H.-N. Lee and R. Kumar, Formation of oxygen vacancies and Ti3+ state in TiO2 thin film and enhanced optical properties by air plasma treatment, Sci. Rep., 2016, 6, 1–12 CrossRef PubMed
.
- Y. Zhou, C. Chen, N. Wang, Y. Li and H. Ding, Stable Ti3+ self-doped Anatase-Rutile mixed TiO2 with enhanced visible light utilization and durability, J. Phys. Chem. C, 2016, 11, 6116–6124 Search PubMed
.
- W. Mai, F. Wen, D. Xie, Y. Leng and Z. Mu, Structure and composition study of carbon-doped titanium oxide film combined with first principles, J. Adv. Ceram., 2014, 1, 49–55 CrossRef
.
- L. XiongBin, J. L. Li, B. Yang and Y. Yu, Ti3+ in the surface of titanium dioxide: Generation, properties and photocatalytic application, J. Nanomater., 2012, 1–12 Search PubMed
.
- K. Li, Z. Huang, X. Zeng, B. Huang, S. Gao and J. Lu, Synergetic Effect of Ti3+ and Oxygen Doping on Enhancing Photoelectrochemical and Photocatalytic Properties of TiO2/g-C3N4 Heterojunctions, ACS Appl. Mater. Interfaces, 2017, 9(13), 11577–11586 CAS
.
- M. D. G. de Luna, J. C. Lin Te, M. J. N. Gotostos and M. C. Lu, Photocatalytic oxidation of acetaminophen using carbon self-doped titanium dioxide, Sustainable Environ. Res., 2016, 4, 161–167 CrossRef
.
- A. Zyoud, A. Zu'bi, M. H. S. Helal, D. Park, G. Campet and H. S. Hilal, Optimizing photo-mineralization of aqueous methyl orange by nano-ZnO catalyst under simulated natural conditions, J. Environ. Health Sci. Eng., 2015, 13, 46 CrossRef PubMed
.
- S. K. Kavitha and P. N. Palanisamy, Photocatalytic and Sonophotocatalytic Degradation of Reactive Red 120 using Dye Sensitized TiO2 under Visible Light, J. Eng. Technol., 2011, 1–6 Search PubMed
.
- R. J. Tayade, T. S. Natarajan and H. C. Bajaj, Photocatalytic degradation of Methylene Blue dye using ultraviolet light emitting diodes, Ind. Eng. Chem. Res., 2009, 48, 10262–10267 CrossRef CAS
.
- U. G. Akpan and B. H. Hameed, Parameters affecting the photocatalytic degradation of dyes using TiO2-based photocatalysts: A review, J. Hazard. Mater., 2009, 170, 520–529 CrossRef CAS PubMed
.
- M. A. M. Salleh, D. K. Mahmoud, W. A. W. A. Karim and A. Idris, Cationic and anionic dye adsorption by agricultural solid wastes: A comprehensive review, Desalination, 2011, 280, 1–13 CrossRef CAS
.
- C. Randorn, J. T. S. Irvine and P. Robertson, Synthesis of visible-light-activated yellow amorphous TiO2 photocatalyst, Int. J. Photoenergy, 2008, 1–6 CrossRef
.
- S. M. Lam, J. C. Sin and A. R. Mohamed, Parameter effect on photocatalytic degradation of phenol using TiO2-P25/activated carbon (AC), Korean J. Chem. Eng., 2010, 27, 1109–1116 CrossRef CAS
.
- Y. Chen and D. D. Dionysiou, Effect of calcination temperature on the photocatalytic activity and adhesion of TiO2 films prepared by the P-25 powder-modified sol–gel method, J. Mol. Catal. A: Chem., 2006, 244, 73–82 CrossRef CAS
.
- M. M. Khan, S. A. Ansari, D. Pradhan, M. O. Ansari, D. H. Han and J. Lee, et al., Band gap engineered TiO2 nanoparticles for visible light induced photoelectrochemical and photocatalytic studies, J. Mater. Chem. A, 2014, 2, 637–644 CAS
.
- H. Lin, C. P. Huang, W. Li, C. Ni, S. I. Shah and Y. H. Tseng, Size dependency of nanocrystalline TiO2 on its optical property and photocatalytic reactivity exemplified by 2-chlorophenol, Appl. Catal., B, 2006, 68, 1–11 CrossRef CAS
.
- L. B. Xiong, J. L. Li, B. Yang and Y. Yu, Ti3+ in the surface of titanium dioxide: Generation, properties and photocatalytic application, J. Nanomater., 2012, 1–13 CAS
.
- L. Ma, I. Jia, X. Guo and L. Xiang, Current status and perspective of rare earth catalytic materials and catalysis, Chin. J. Catal., 2014, 35, 108–119 CrossRef CAS
.
| This journal is © The Royal Society of Chemistry 2017 |

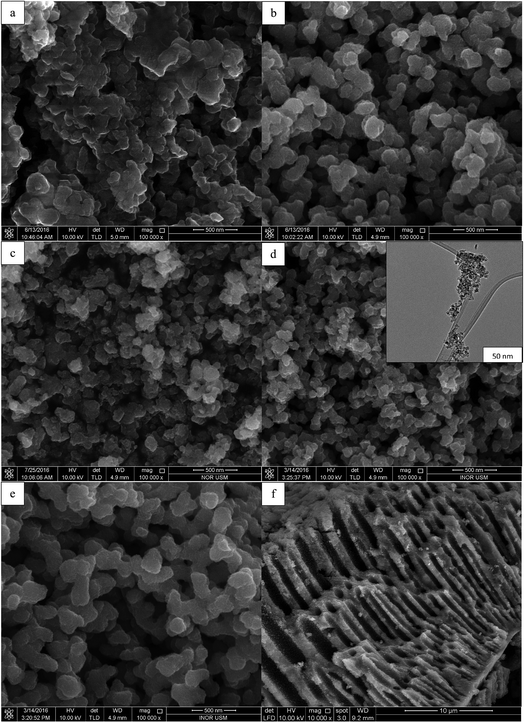
![[thin space (1/6-em)]](https://www.rsc.org/images/entities/char_2009.gif) 000×) of the TiO2 NPs synthesised using (a) uncalcined TiO2, (b) 0.01 mol TTIP, pH 5, (c) 0.01 mol TTIP, pH 7, (d) 0.01 mol TTIP, pH 9, insert: HRTEM image, (e) 0.07 mol TTIP pH 9, (f) pore channels of TiO2 NPs (10
000×) of the TiO2 NPs synthesised using (a) uncalcined TiO2, (b) 0.01 mol TTIP, pH 5, (c) 0.01 mol TTIP, pH 7, (d) 0.01 mol TTIP, pH 9, insert: HRTEM image, (e) 0.07 mol TTIP pH 9, (f) pore channels of TiO2 NPs (10
