
 Open Access Article
 This Open Access Article is licensed under a
 Creative Commons Attribution 3.0 Unported Licence
The effect of size and concentration of nanoparticles on the glass transition temperature of polymer nanocomposites†
Olga A. Serenko*a,
Vyacheslav I. Roldughinb,
Andrey А. Askadskiia,
Elena S. Serkovaa,
Pavel V. Strashnov a and
Zinaida B. Shifrinaa
a and
Zinaida B. Shifrinaa
aRussian Academy of Sciences, A. N. Nesmeyanov Institute of Organoelement Compounds, Moscow, 119991, Russia. E-mail: strashnov@ineos.ac.ru
bRussian Academy of Sciences, A. N. Frumkin Institute of Physical Chemistry and Electrochemistry, Moscow, 119071, Russia
First published on 27th October 2017
Abstract
Numerous studies have reported a possibility of alteration of the polymer glass transition temperature (Tg) by the introduction of nanoscale particles. Here we use model nanocomposites based on polystyrene and polyphenylene dendrimers to show both theoretically and experimentally that inclusion of rigid nanoparticles of 2.3–5 nm size into the polymer leads to a negligible Tg increase, not exceeding the experimental measurement error. Furthermore, we establish a strategy for preparation of the polymer nanocomposites with Tg modified significantly from a practical point of view. We find that to form a uniform distribution in the polymer matrix the size of thermodynamically compatible nanoparticles should not exceed 2.3 nm. An increase of the particle diameter by 2 nm inevitably leads to the formation of filler aggregates.
The possible influence of nanoparticle size and concentration on the glass transition temperature of polymeric nanocomposites (Tg) is actively investigated and discussed in the scientific literature. To date, several theoretical approaches have been developed that determine the contribution of nanoparticles to segmental dynamics of macromolecules.1–7 In most cases, these approaches are based on concepts that can be described in a simplified way as follows:
- The polymer wets the surface of the nanoparticle, which suggests an increase in Tg with an increase in the content of the nanosized filler;
- The polymer does not wet the surface of the filler and, therefore, Tg decreases with increasing content of nanoparticles;
- Immobilization of macromolecules on the surface of the filler takes place, which leads to an increase in Tg.
Experimental studies, where increase, permanence, or decrease of the glass transition temperature of polymers with SiO2 nanoparticles, were discussed in a critical review.8 It was noted that in the absence of clear understanding of the role of nanoparticles to explain the experimental results of a particular Tg study, authors pick one of the above options, which is the most acceptable for their system. This situation does not bring us closer to the understanding of the role of nanosized filler in the polymer and, ultimately, to determining the advantages of using nanoparticles in the composition.
The current state in the field of polymer nanocomposites is complicated in many respects by the aggregation of nanoparticles in the polymer matrix9 and the necessity to develop methods for preventing the formation of dispersed phase aggregates as well as preserving their initial (or individual) dimensions and uniform distribution of nanoparticles in the polymer. One of the solutions to the problem is to modify the surface of the nanosized filler by grafting functional groups that should ensure compatibility with the polymer matrix or form chemical bonds with the functional groups of the polymer.10–12
However, the surface layer of the nanoparticle can act as a plasticizer for the matrix.13–15 This effect disguises the effect of the nanoparticle itself on the composition properties. Thus, based on the results of thermodynamic analysis of polymer/hybrid nanoparticles systems with a core–shell structure, it was shown that the increase or decrease in Tg depends on the competition of two main factors:16
- An increase in the number of degrees of freedom and the system entropy because of the presence of an organic layer on the surfaces of nanoparticles;
- A decrease of the system entropy and the number of configuration states of the macromolecules in the presence of nanoinclusions.
The first of them leads to a drop in the glass transition temperature of the composition, while the second one leads to its rise since the contribution of the plasticizing effect of the nanoparticle surface layer to the nanocomposite properties decreases with an increase of its size.
Another approach to the preparation of nanocomposites is based on the use of a filler with a particle radius comparable to or smaller than the gyration radius of the macromolecule Rg,17,18 in another version with a particle diameter comparable or smaller than the monomeric unit of the polymer chain.7,19,20 For a wide range of polymers, the particles with a size of 2 to 5 nm meet these criteria. It is assumed that in this case, it is possible to obtain composites without filler aggregation avoiding a surface modification. According to M. E. Mackay et al., the introduction of particles with similar dimensions into the polymer can change the radius of gyration of the macromolecule as well as its conformational mobility, relaxation, and rheological characteristics, e.g., Tg. The polymer glass transition temperature depends on the segmental mobility of the macromolecular chain.21,22 Numerous studies23,24 discuss these dependencies and either confirm or refute the expected changes.
To study the effects of such small sized particles (2–5 nm) on the nanocomposite properties, it is convenient to use model nanoobjects, for example, dendrimers – regularly branched macromolecular particles. In this case, the monodispersity and similarity of the nanoparticle shape are predetermined by their structure formed as a result of controlled synthesis.25–27 However, to the best of our knowledge, the studies on polymer/dendrimers blends are not numerous.27–32 S. K. Emran studied 12-tert-butyl ester dendrimer/poly(methyl methacrylate) blends.29 It was found that dendrimers of the 2nd generation are plasticizers of poly(methyl methacrylate), and their introduction into the polymer leads to a decrease in the glass transition temperature of the blends. The plasticizing effect of dendrimers was also noted by B. M. Tande et al.30 In this case, blends of polyvinyl chloride and poly(propylene imine) dendrimers of the 4th and 5th generations were studied. The study of blends of polystyrene (PS) and carbosilane dendrimers with [dimethyl(2-phenylethyl)silyl]propyl groups in the external layer demonstrated that with an increase in the content of dendrimers of the first, second, and sixth generation, the Tg of the systems have decreased, unchanged and increased, correspondingly.31
It should be noted that the used dendrimers27–31 are “soft” (flexible-chain) organic nanoparticles characterized by an intrinsic glass transition temperature that is lower than the glass transition temperature of the matrix. When rigid aryl ether dendrimers of the 1st and 2nd generations, whose melting points were 190 and 152 °C, respectively, were introduced into polyethylene terephthalate,32 no significant effect on the Tg was observed. Thus, at a concentration of 1st generation dendrimers of 5 and 10 wt%, Tg decreased by 1 and 2 degrees, respectively; while a 3rd generation dendrimer was used, Tg remained unchanged.
In this work, rigid polyphenylene dendrimers of the 1st and 3rd generations were used as nanoparticles. The absence of functional groups on the surface of these particles allows, first, to exclude from consideration the possible plasticizing effect of the outer functional layer and, second, to determine the effect of the concentration and size of small rigid particles on the glass transition temperature of the matrix. Based on the thermodynamic approach to the evaluation of glass transition temperature of composites with rigid model nanoparticles, we theoretically assessed and experimentally proved that the high hopes associated with small size nanoparticles were not justified. Small rigid nanoparticles do not show a significant effect on the glass transition temperature of a nanocomposite, that can be reliably determined by experimental methods and whose variation would have an impact on the temperature range of the material usage.
Results and discussion
Determination of compatibility of the composition components
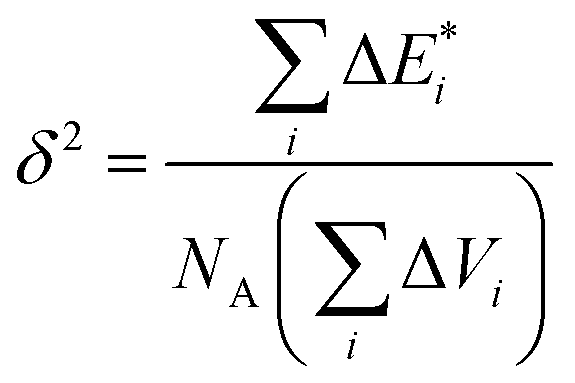
It is known that the components of the mixture are thermodynamically compatible in case of the following inequality:33,34
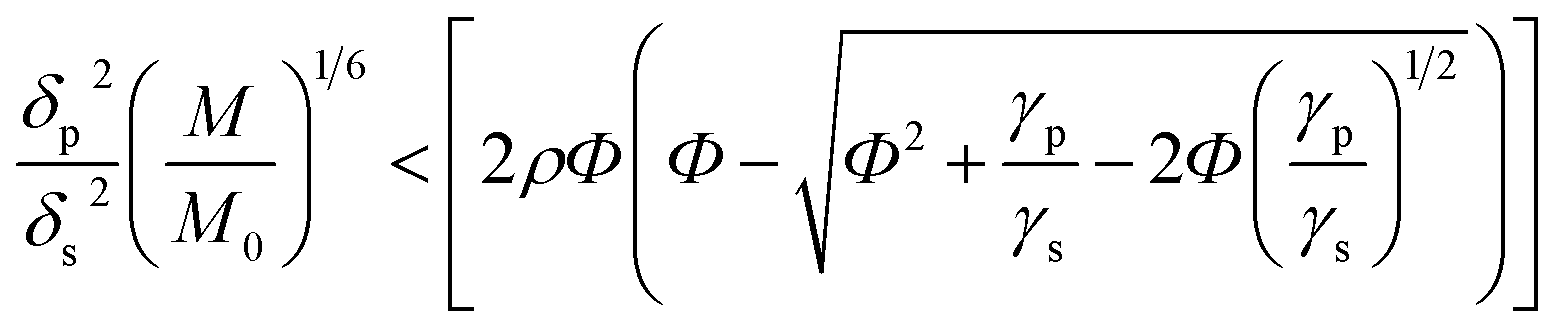 | (1) |
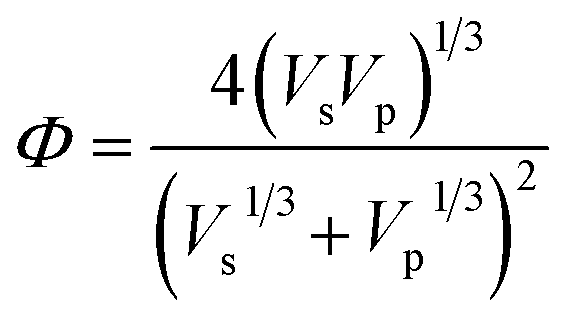 , M0 = 200000 – molecular weight of the polymer with polymerization degree N0 = 1920 for PS; M – molecular weight of the polymer; δp, Vp, γp, and δs, Vs, γs – are solubility parameter, molar volume, surface tension of the polymer and solvent, respectively, ρ is the universal constant equaled to 0.687.33,34
The required for assessment of the components compatibility values of the solubility parameters, surface tension and molar volumes of PS, F1, and F3 are given in Table 1. If the following abbreviations are accepted:
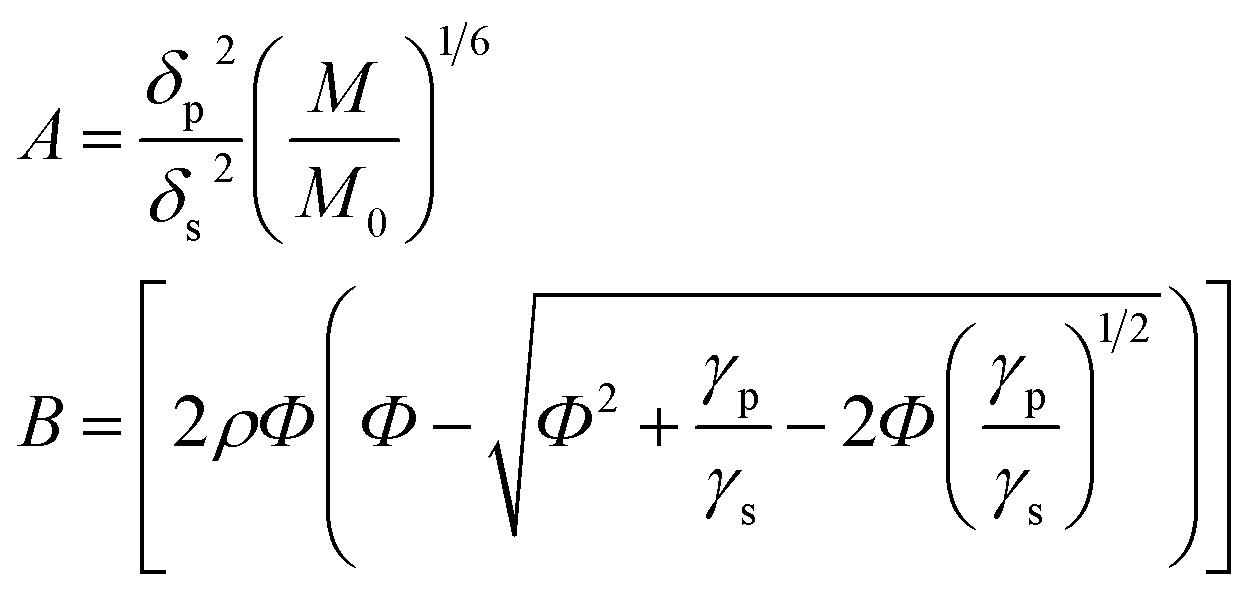 | (2) |
| Components | Molar volume, V, (cm3 mol−1) | Solubility parameter, δ, (J cm−3)0.5 | Surface tension, γ, (mN m−1) |
|---|---|---|---|
| PS | 97.1 | 18.7 | 40.4 |
| F1 | 1240 | 19.6 | 70.7 |
| Terminal groups of the F3 dendrimer | 1160 | 19.6 | 69.2 |
| Mn PS, kDa | A | B | Compatibility |
|---|---|---|---|
| PS/F1 | |||
| 140 | 0.858 | 0.871 | + |
| 150 | 0.868 | 0.871 | + |
| 160 | 0.877 | 0.871 | — |
![[thin space (1/6-em)]](https://www.rsc.org/images/entities/char_2009.gif) |
|||
| PS/terminal groups of the F3 | |||
| 300 | 0.984 | 0.998 | + |
| 400 | 1.032 | 0.998 | — |
For the mixture of PS with F3, compatibility of the matrix polymer with the terminal groups of the dendrimer was estimated. The fragment of the structure of the dendrimer terminal groups is given below:
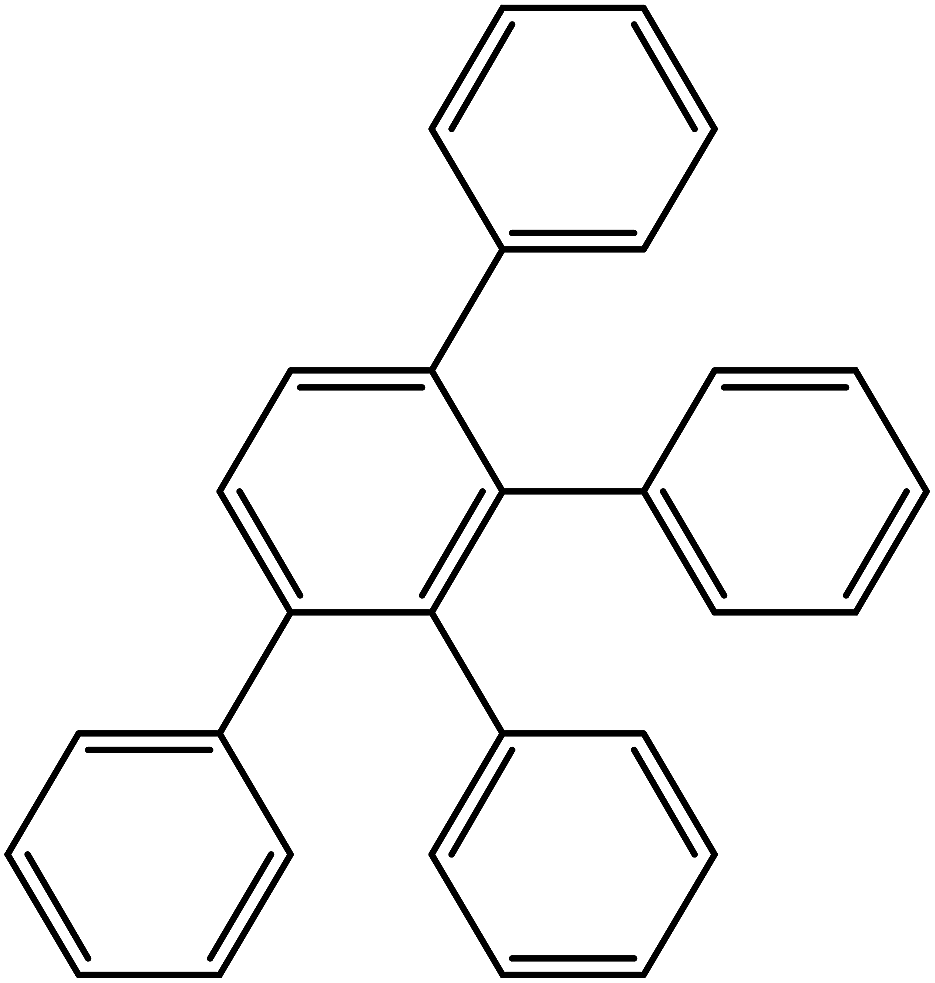
The values of the required parameters are given in Table 1, and the results of the calculation are presented in Table 2. According to the data obtained, the surface groups of the third-generation dendrimer are well compatible with PS. Considering the fact that the size of F3 meets the requirements for avoiding its aggregation in polymer matrix, namely, the radius of these nanoparticles (2.5 nm) is less than Rg of the polymer,17 which is equal to 12.5 nm,35 a uniform distribution of F3 dendrimers in PS can be expected (dendrimers do not form aggregates).
Morphology of PS/dendrimer compositions
The obtained PS/F1 films in the studied range of nanoparticle concentrations are transparent, indicating a good compatibility of the dendrimer with the matrix polymer, which agrees with the results of the evaluation of thermodynamic compatibility. The absence of dendrimer aggregates in PS is also confirmed by the results of electron microscopy. Fig. 1(a and b) shows TEM images of a sample containing 3 wt% of F1. The film is homogeneous.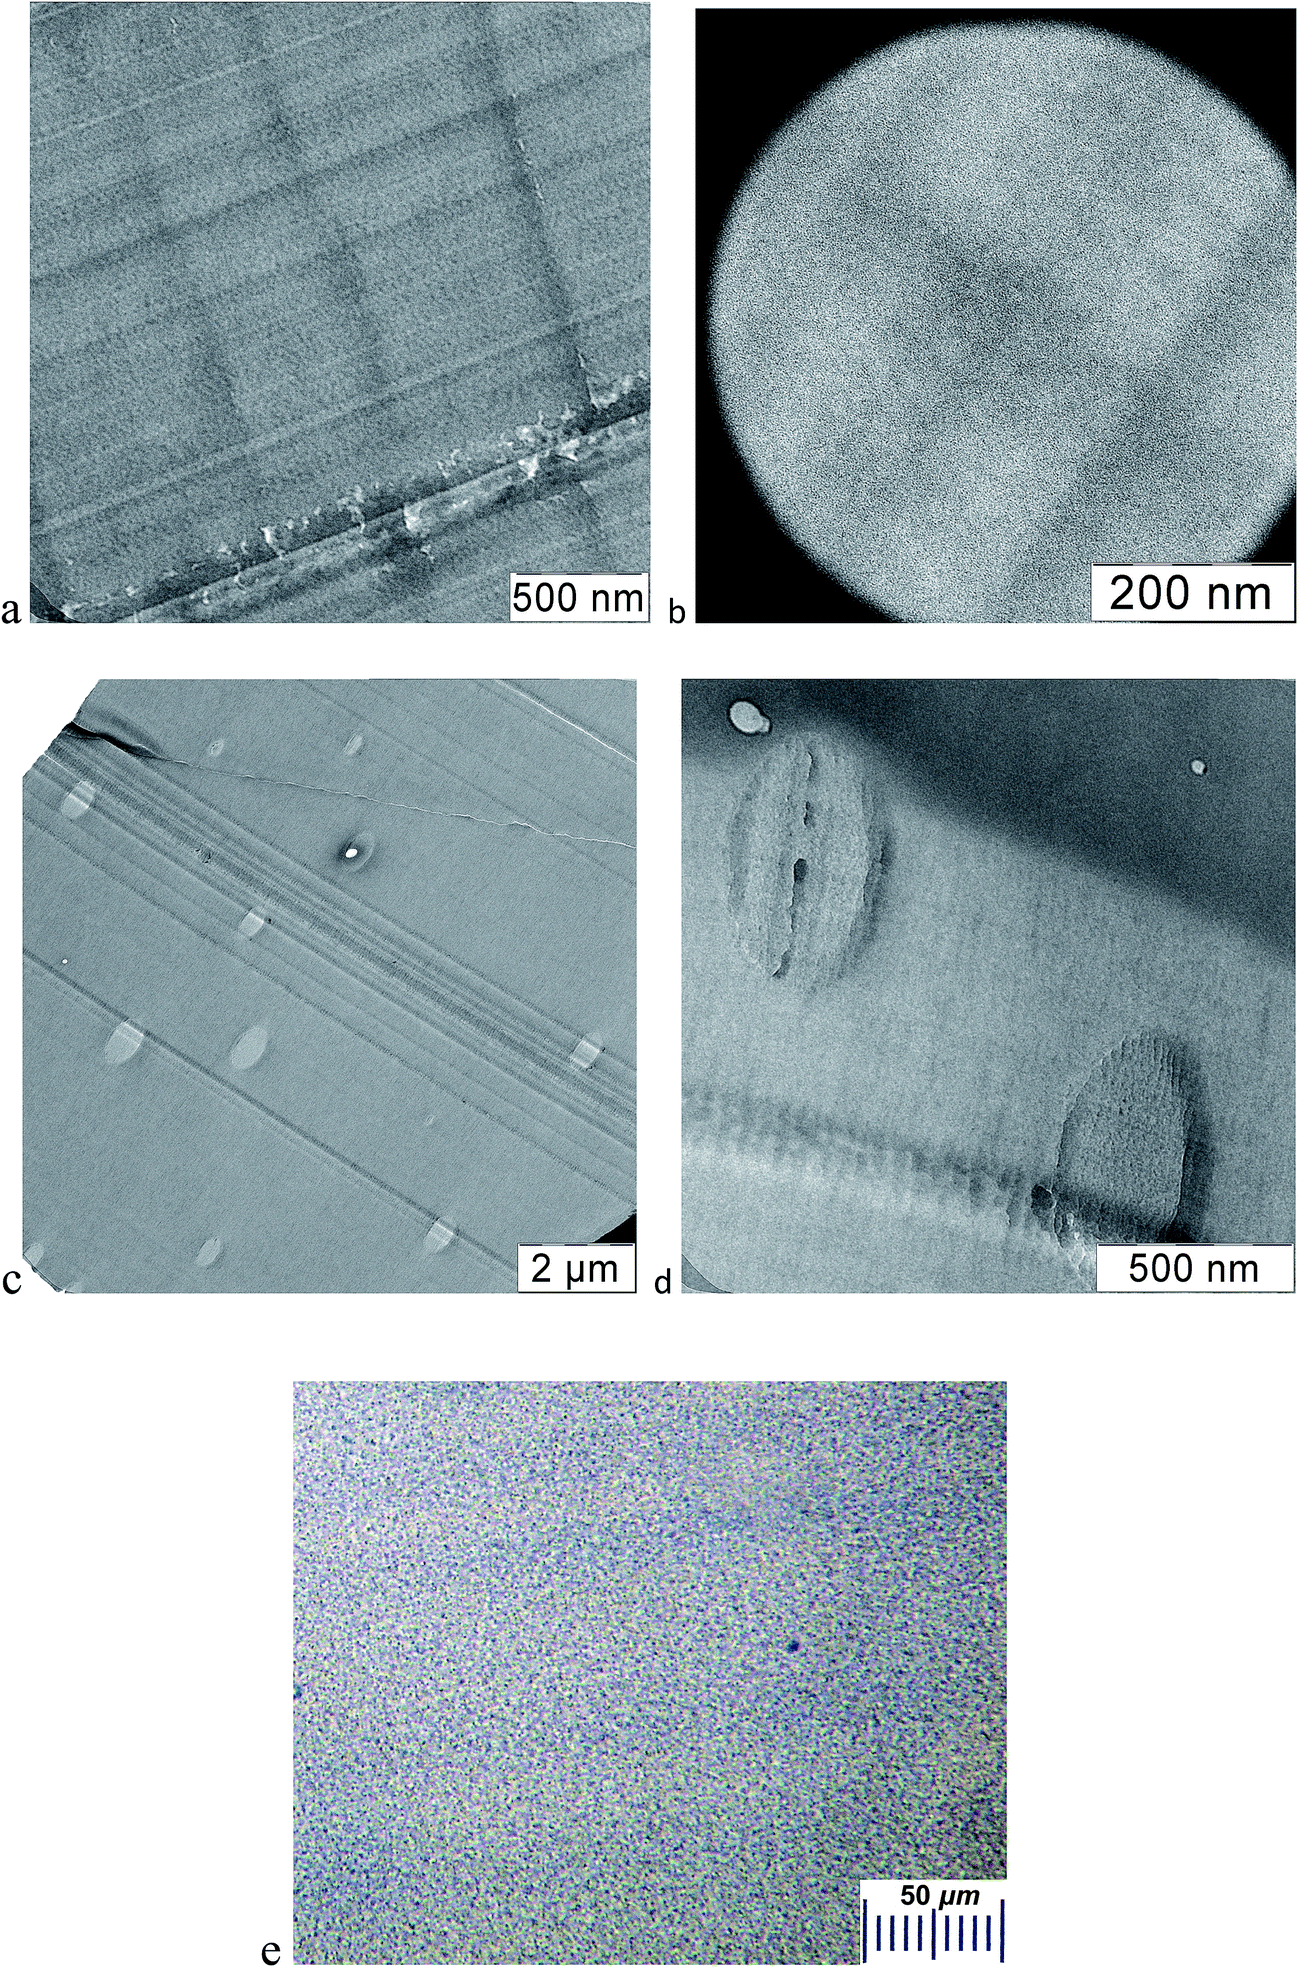 | ||
| Fig. 1 TEM images (a–d) and an optical photograph (e) of PS-based samples containing 3 wt% dendrimers of the first F1 (a, b) and the third F3 generation (c–e). TEM images at different magnifications were taken. TEM images show the homogeneous distribution of F1 in PS. F3 dendrimers form aggregates in the polymer. Black dots in optical microscope photograph (e) correspond to the dendrimer aggregates. | ||
Unlike PS/F1 blends, PS/F3 films are transparent if the amount of the dendrimers does not exceed 1 wt%. The film is characterized with a slight opalescence at an F3 concentration of 2 wt%, while at 3 wt% of F3 the compositions become turbid. Fig. 1(c and d) shows TEM images of a PS-based sample containing 3 wt% of F3. Aggregates up to 650 nm in size are observed in the polymer. They can also be detected with the use of an optical microscope (Fig. 1e). The result obtained is somewhat unexpected. As it was mentioned above, the surface groups of an F3 nanoparticle are compatible with PS, and the F3 radius is less than Rg of the matrix polymer. It is evident that the formation of aggregates and, consequently, the mixture microphase separation is depended on the nanoparticle size. A similar behavior was observed in work,36 where particles with a radius of 2 nm containing the surface groups which are thermodynamically compatible with the polymer (PS), formed aggregates in its bulk. The similarity of the results indicates the dependence of compatibility of nanoparticles with the matrix polymer on their size. Consequently, the fulfillment of the requirements17,18 which assume the absence of aggregation if the radius of nanoparticles is smaller than the gyration radius of the macromolecule, is not a guarantee of preventing aggregation of a nanosized filler.
Glass transition temperature of PS/dendrimer blends
Polyphenylene dendrimers are rigid-chain polymers, and their glass transition temperature exceeds the decomposition temperature. Fig. 2 shows the dendrimer concentration dependence of the glass transition temperature of the composites. It is worth noting that according to the results of thermogravimetric analysis the mixture does not contain residual solvent. The results presented in the figure indicate the similarity of Tg of the studied systems with that of PS as differences do not exceed 0.5–0.6 °C. Consequently, rigid, structurally uniform nanoparticles (not containing a surface plasticizing layer) with a size of 2.3 and 5.0 nm do not have a significant effect on the glass transition temperature of the matrix polymer at the concentration of nanoparticles lesser than 3 vol%. Y. Tai et al.11,12 and some authors as analyzed in the review8 have obtained similar results.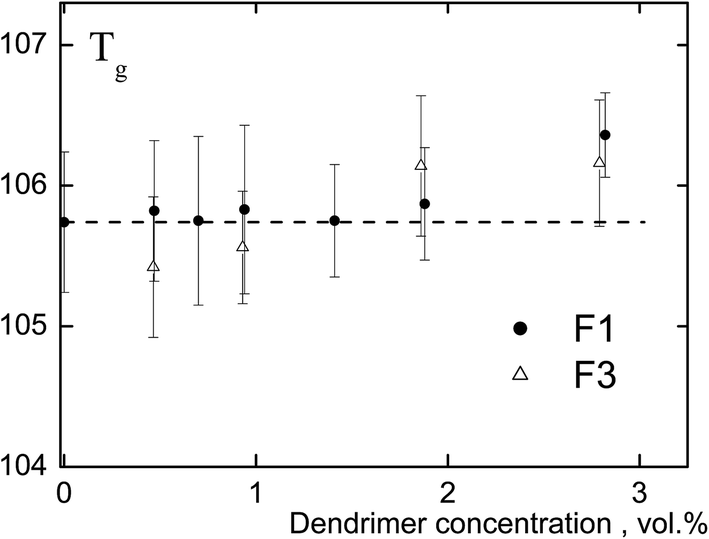 | ||
| Fig. 2 The dependence of Tg of the PS-composite on polyphenylene dendrimer concentration. F1 is the 1st and F3 is 3rd dendrimer generation. The particle size: 2.3 nm (F1) and 5.0 nm (F3). The dashed line indicates the glass transition temperature of PS. The difference between Tg of composites and pure PS is 0.5–0.6 °C and can be regarded as an experimental error. | ||
Thermodynamic analysis of the glass transition temperature of amorphous polymer/nanoparticle composites
A thermodynamic approach to the analysis of concentration-dependent changes in Tg of nanocomposites based on amorphous polymer and nanoparticles with a core–shell structure, which includes the internal configuration entropy of the hybrid nano-inclusions was developed earlier.16To describe the concentration-dependent change in the glass transition temperature of a polymer filled with polyphenylene dendrimers, we use the approaches proposed earlier16 assuming the structural uniformity and monodispersity of the particles. In this case, the equation describing the glass transition temperature of the composite takes the form:
 | (3) |
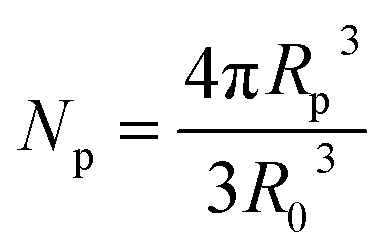 , R is the gas constant; Mp is the molar mass of the monomer unit; ΔCp, J (g K)−1, is change in heat capacity of the polymer upon vitrification; RK is the Kuhn segment size of polymer matrix; R0 is the unit cell size, and Rp is the particle radius including the modified surface layer; N – degree of polymerization; Np is number of unit cells, occupied by particles; Rδ = Rp − δ; δ – thickness of the surface layer, which elements might have different orientation in the dendrimer, Z is the coordination number of macromolecules; φ – volumetric fraction of particles, ν – number of degrees of freedom associated with the different orientation of the elements of the surface layer.
The summands in the braces of eqn (3) have the following physical meaning. The first four are related to the entropy of mixing, considering the different configurations of polymer molecules in the presence of particles. The multiplier tanh(Rp/RK) excludes the influence of particles on the configuration of the polymer molecule when their size is smaller than the length of the Kuhn segment. The fifth summand considers the steric interaction of dendrimers with each other. Finally, the last three summands are related to the contribution of different orientations of the particles to the entropy as a whole and segments in the δ thick surface layer.
Upon the calculation of the glass transition temperature of PS/dendrimer composites, the value of parameter Z, which characterizes the coordination number of segments of the PS macromolecule, was taken equal to 9.16,31 Fig. 3 shows the obtained dependences of the Tg changes on the content of rigid dendrimers. The thickness of the surface layer δ, whose values were 0 and 0.42 nm, was used as the variation parameter. The first option (δ = 0 nm) assumes an absolute rigidity of the polyphenylene dendrimers (Fig. 3, curves 1 and 2), i.e., their units have a strictly fixed conformation. It should be noted that for a zero value of the surface layer, Rδ = Rp, the last summand in eqn (3), which includes parameter ν, also becomes zero. It can be seen from the figure, that for the PS/F1 system this approximation leads to an increase of the glass transition temperature, however, the values of the positive Tg shift in the investigated concentration range of F1 do not exceed 1 °C and correspond to the experimental data. For dendrimers of the third generation F3, the shift in the glass transition temperature (ΔTg) reaches 2.8 °C and slightly exceeds the mean error of the experimental values. The obtained result indicates the absence of absolute rigidity in dendrimers of the third generation, and for the PS/F3 system, the value of δ is probably different from zero.
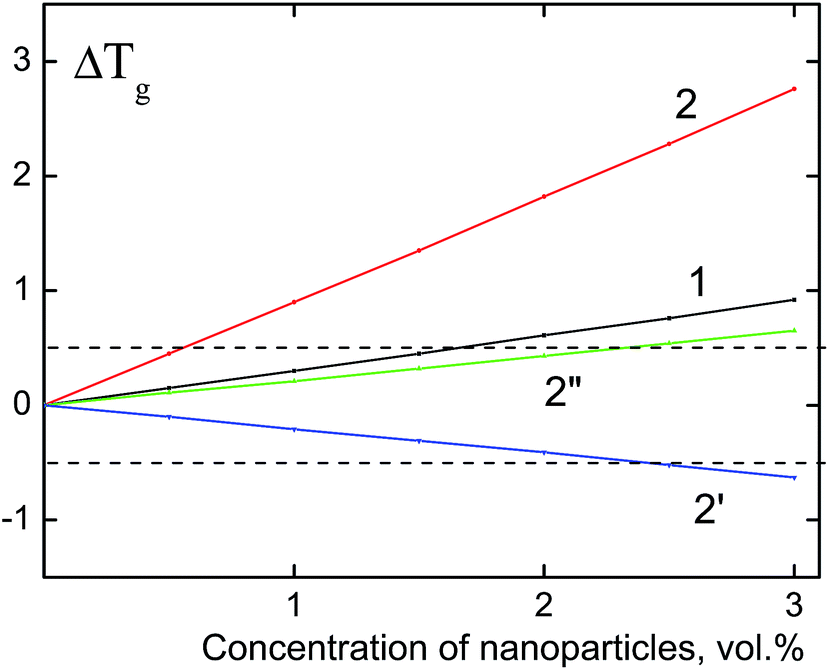 | ||
| Fig. 3 The theoretical dependences of the composite glass transition temperature (ΔTg) on the concentration of nanoparticles. Particle size: 2.3 nm (1) and 5.0 nm (2, 2′, 2′′). The calculation is performed using eqn (3) with the following parameter values: δ = 0, Z = 9 (1, 2); δ = 0, 42, ν = 7, Z = 9 (2′); δ = 0, 42, ν = 3, Z = 9 (2′′). The dashed lines indicate the experimental range of the glass transition temperature of nanocomposites (±0.5 °C). | ||
In the second version of calculation, the thickness of the surface layer is equal to the size of the phenyl ring of the terminal group of the dendrimer (δ = 0.42 nm) assuming a “defrosting” of the surface layer of nanoparticles to the “depth”. “Defrosting” implies the appearance of different degrees of freedom of the segments, in particular, their rotations. Similar to the mixture “PS/flexible-chain carbosilane dendrimer”16,31 the parameter ν was assumed to be equal 7 upon the calculation of the glass transition temperature. Fig. 3 (curve 2′) shows the decrease of the glass transition temperature of PS/F3 with an increase of nanoparticle content, however, the value of ΔTg does not exceed 0.6 °C in the analyzed concentration range. Since polyphenylene dendrimers are rigid-chain nanoparticles, Tg was calculated at ν = 3 (Fig. 3, curve 2′′). In this case, a better agreement with the experimental data is achieved, and the glass transition temperature of the PS/F3 system increases with the increase of the dendrimer concentration, but the value of the positive shift of Tg does not exceed 0.65 °C.
Taking into account the performed thermodynamic analysis of the changes in the glass transition temperature of the nanocomposites, it can be concluded that incorporation of rigid nanosized particles with a size of 2.3–5.0 nm into the polymer should result in increase of Tg of the system, however the value of this increase at a concentration of nanoparticles lesser than 3 vol% does not exceed the experimental error. In practice, the introduction of nanoparticles does not affect significantly on Tg of the material.
Thus, to obtain a material with a uniform distribution of nanoparticles at their content of 3 vol%, the latter should be thermodynamically compatible with the matrix polymer and have a size of 2.3 nm. An increase of the particle size inevitably leads to aggregation of the filler, despite its compatibility with the matrix. It has been theoretically and experimentally shown that nanoparticles of this size are not capable significantly change the Tg of the material. An increase in the concentration of nanoparticles (more than 3–5 vol%) with a size of 2–3 nm promotes the formation of aggregates16,36–39 and, as a consequence, prevents the expected effect of the nanosized filler on the glass transition temperature.
The use of particles bigger than 2–2.3 nm leads to their unavoidable aggregation.37,40 Thermodynamic analysis of these systems, which does not take into account the existence of aggregates in the volume of the polymer, predicts an increase in Tg of the composites. However, the positive shift of this characteristic of the sample does not exceed the usual statistical (or arithmetic mean) spread of the obtained values of Tg. Consequently, in this case, the expected effects of nanosized particles on this important characteristic of polymer nanocomposites are not justified either. We particularly emphasize that this conclusion refers to nanocomposites in which there are no interactions between the nanoparticles and the polymer matrix.
Conclusions
The thermodynamic analysis of systems with nanosized particles shows that the high hopes associated with small size nanoparticles were not justified. The introduction of rigid nanoparticles of 2.3–5 nm size into the polymer leads to a negligible increase in the glass transition temperature of the system, but this increase does not exceed the experimental measurement error at the nanoparticle concentration less or equal to 3 vol%. It is necessary to change the general strategy for polymer nanocomposite preparation in which nanoparticles would contribute to a significant increase in their glass transition temperature. One of the factors of “control” over properties of the future material with nano-sized particles can be the directed formation of the nanoparticle/polymer surface layer, composed of the polymer near the nanoparticle and the surface layer of the particle itself.8 Possibly, finding of the conditions for its formation, understanding the function of this layer, its contribution to the properties of the future material, will disclose the “mystery” of nanoparticles in the polymer.Materials and methods
PS (PSM-115, Mw = 1.9 × 10⁵, Mw/Mn = 2.22, density 1.045 g cm−3) was used. Polyphenylene dendrimers of the 1st and 3rd generation (from now on referred to as F1 and F3, respectively) were used as nanosized fillers. Their structural formulae are given below:
Synthesis of dendrimers was carried out according to a procedure published elsewhere.41 The particle size, assessed using molecular mechanics simulations, was shown to be 2.3 nm for F1 and 5.0 nm for F3.42
The density of the dendrimers was determined by gel pycnometry using an automatic helium pycnometer AccuPyc 1340 (Micromeritics Instrument Corp., USA). The values obtained are 1.114 ± 0.002 and 1.123 ± 0.003 g cm−3 for F1 and F3, respectively.
To obtain PS/dendrimer compositions we prepared solutions of PS and dendrimers (F1 or F3) in benzene. Then, a solution of the dendrimer in 5 ml of benzene was added dropwise to a solution of polymer (0.785 g of PS in 10 ml of benzene) while stirring with a magnetic stirrer. After the total amount of dendrimer was introduced, the resulting solution was aged with stirring for 40 minutes, after which it was precipitated in 400 ml of ethyl alcohol. The white product was filtered on a Schott glass filter and dried in a vacuum oven at 110 °C until constant weight. The average drying time was 24 hours. The presence of residual solvent in the mixture was monitored by thermogravimetry analysis. The concentration of dendrimers in the PS was varied from 0 to 3 wt%. The weight concentrations and their corresponding volume concentrations of dendrimers in PS are presented in the ESI.†
The resulting blends were used for producing 200 μm thick films by hot pressure molding at 180 °C and 10 MPa. The samples were maintained under pressure for 5 min at 180 °C and for an additional 5 min when cooling. The PS/F1 films were colorless and transparent, and in the case of PS/F3, they were of a light-yellow color. When analyzing the properties of the compositions, a PS film obtained under similar conditions served as a reference sample.
The blends were studied by thermogravimetric analysis with the help of “Derivatograph-C” instrument (MOM, Hungary) at a heating rate of 10° min−1 in argon on ≈20 mg samples.
The morphology of the samples was examined by transmission electron microscopy using the LEO912 AB Omega microscope (Karl Zeiss, Germany). Preliminarily, thin slices not more than 100 nm thick were obtained using a ultramicrotome Reichert-Jung with a diamond knife.
Also, an optical microscope Eclipse 55i (Nikon, Japan) equipped with a digital imaging record system was used.
The glass transition temperature of the compositions was determined by differential scanning calorimetry on a Mettler Toledo 822E thermal analyzer at a heating rate of 10°C min−1. Tg of the sample was assumed to be the temperature corresponding to the inflection point in the devitrification stage of the material during re-scanning the temperature.
The thermodynamic compatibility of PS with dendrimers was calculated using the method described elsewhere33,34 with the CASCADE software. The known equations were used to evaluate the following characteristics:
δ solubility parameter (J cm−3)0.5:
 | (4) |
 | (5) |
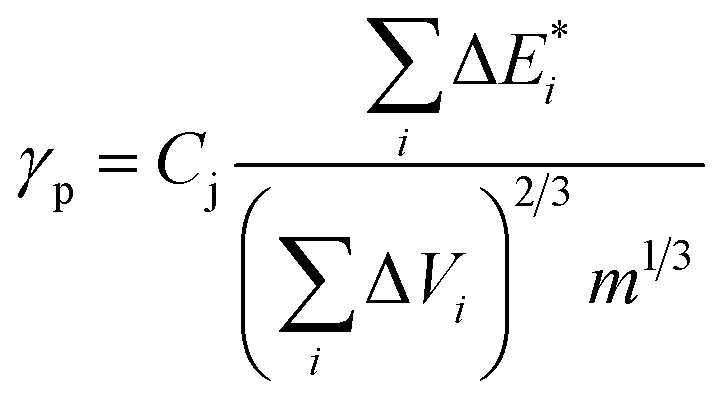 | (6) |
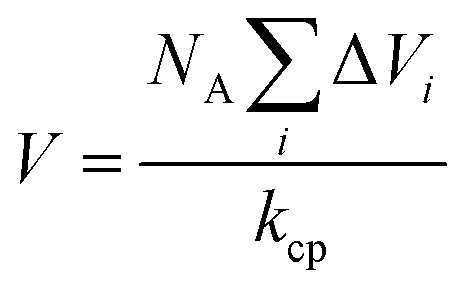 | (7) |
 is van der Waals volume of the solvent molecule or a repeating unit of the polymer; NA is Avogadro's number; Aj is a factor associated with coefficients of the molecular packing of liquid molecules in bulk and on the surface; Cj is the parameter associated with the molecular packing coefficients of polymers and is dependent on the polymer type; and m is the number of atoms in the polymer repeating unit, kcp is the average coefficient of molecular packing equaled to 0.681 (for amorphous bulk polymers33,34).
Author contributions
The manuscript was written through contributions of all authors. All authors have approved the final version of the manuscript.Conflicts of interest
There are no conflicts to declare.Acknowledgements
Financial support from the Russian Science Foundation is gratefully acknowledged (project No. 15-13-30026).References
- L. Ruiz-Pérez, G. J. Royston, J. P. A. Fairclough and A. J. Ryan, Polymer, 2008, 49, 4475–4488 CrossRef.
- C.-C. Lin, E. Parrish and R. J. Composto, Macromolecules, 2016, 49, 5755–5772 CrossRef CAS.
- M. Alcoutlabi and G. B. McKenna, J. Phys.: Condens. Matter, 2005, 17, R461–R524 CrossRef CAS.
- F. W. Starr, J. F. Douglas, D. Meng and S. K. Kumar, ACS Nano, 2016, 10, 10960–10965 CrossRef CAS PubMed.
- T. Davris, M. R. B. Mermet-Guyennet, D. Bonn and A. V. Lyulin, Macromolecules, 2016, 49, 7077–7087 CrossRef CAS.
- L. S. Schadler, S. K. Kumar, B. C. Benicewicz, S. L. Lewis and S. E. Harton, MRS Bull., 2007, 32, 335–340 CrossRef CAS.
- L. M. Hall, A. Jayaraman and K. S. Schweizer, Curr. Opin. Solid State Mater. Sci., 2010, 14, 38–48 CrossRef CAS.
- O. A. Serenko and A. M. Muzafarov, Polym. Sci., Ser. C, 2016, 58, 93–101 CrossRef CAS.
- J. Oberdisse, G. Carrot, J. Oberdisse, J. Jestin, F. Boué, E. Geissler, C. Gauthier and A. Zaoui, Soft Matter, 2006, 2, 29–36 RSC.
- S. Kango, S. Kalia, A. Celli, J. Njuguna, Y. Habibi and R. Kumar, Prog. Polym. Sci., 2013, 38, 1232–1261 CrossRef CAS.
- Y. Tai, J. Qian, Y. Zhang and J. Huang, Chem. Eng. J., 2008, 141, 354–361 CrossRef CAS.
- Y. Tai, J. Qian, J. Miao, R. Xia, Y. Zhang and Z. Yang, Mater. Des., 2012, 34, 522–527 CrossRef CAS.
- O. A. Serenko, M. V. Mironova, N. A. Novozhilova, P. V. Strashnov, E. V. Getmanova, A. A. Askadskii, V. G. Shevchenko, V. G. Kulichikhin and A. M. Muzafarov, Mater. Chem. Phys., 2015, 156, 16–28 CrossRef CAS.
- A. Zhiltsov, O. Gritsenko, V. Kazakova, O. Gorbatsevitch, N. Bessonova, A. Askadskii, O. Serenko and A. Muzafarov, J. Appl. Polym. Sci., 2015, 132, 41894 CrossRef.
- S.-K. Kim, N. A. Nguyen, J. J. Wie, H. S. Park, C. Schick, M. E. Seitz, K. I. Winey, N. Clarke and R. J. Composto, Nanoscale, 2015, 7, 8864–8872 RSC.
- V. I. Roldughin, O. A. Serenko, E. V. Getmanova, N. A. Novozhilova, G. G. Nikifirova, M. I. Buzin, S. N. Chvalun, A. N. Ozerin and A. M. Muzafarov, Polym. Compos., 2016, 37, 1978–1990 CrossRef CAS.
- M. E. Mackay, A. Tuteja, P. M. Duxbury, C. J. Hawker, B. Van Horn, Z. Guan, G. Chen and R. S. Krishnan, Science, 2006, 311, 1740–1743 CrossRef CAS PubMed.
- A. R. de Luzuriaga, A. Etxeberria, J. Rodríguez and J. A. Pomposo, Polym. Adv. Technol., 2008, 19, 756–761 CrossRef.
- J. B. Hooper and K. S. Schweizer, Macromolecules, 2005, 38, 8858–8869 CrossRef CAS.
- Y. Rao, Particuology, 2010, 8, 549–555 CrossRef CAS.
- A. Tuteja, P. M. Duxbury and M. E. Mackay, Phys. Rev. Lett., 2008, 100, 77801 CrossRef PubMed.
- A. L. Frischknecht, E. S. McGarrity and M. E. Mackay, J. Chem. Phys., 2010, 132, 204901 CrossRef PubMed.
- M. K. Crawford, R. J. Smalley, G. Cohen, B. Hogan, B. Wood, S. K. Kumar, Y. B. Melnichenko, L. He, W. Guise and B. Hammouda, Phys. Rev. Lett., 2013, 110, 196001 CrossRef CAS PubMed.
- T. Chen, H.-J. Qian, Y.-L. Zhu and Z.-Y. Lu, Macromolecules, 2015, 48, 2751–2760 CrossRef CAS.
- M. Seiler, Chem. Eng. Technol., 2002, 25, 237–253 CrossRef CAS.
- R. Hourani and A. Kakkar, Macromol. Rapid Commun., 2010, 31, 947–974 CrossRef CAS PubMed.
- D. Astruc, E. Boisselier and C. Ornelas, Chem. Rev., 2010, 110, 1857–1959 CrossRef CAS PubMed.
- S. Ristić and J. Mijović, Polymer, 2008, 49, 4695–4702 CrossRef.
- S. K. Emran, Y. Liu, G. R. Newkome and J. P. Harmon, J. Polym. Sci., Part B: Polym. Phys., 2001, 39, 1381–1393 CrossRef CAS.
- B. M. Tande, N. J. Wagner and Y. H. Kim, J. Polym. Sci., Part B: Polym. Phys., 2007, 45, 1970–1975 CrossRef CAS.
- N. A. Novozhilova, O. A. Serenko, V. I. Roldughin, A. A. Askadskii and A. M. Muzafarov, Silicon, 2015, 7, 155–164 CrossRef CAS.
- P. L. Carr, G. R. Davies, W. J. Feast, N. M. Stainton and I. M. Ward, Polymer, 1996, 37, 2395–2401 CrossRef CAS.
- A. A. Askadskii, Physical Properties of Polymers: Prediction and Control, Gordon and Breach Publishers, Amsterdam, 1996, vol. 2 Search PubMed.
- A. A. Andrei and A. Askadskii, Computational materials science of polymers, Cambridge International Science Publishing, 2003 Search PubMed.
- A. Takano, Y. Ohta, K. Masuoka, K. Matsubara, T. Nakano, A. Hieno, M. Itakura, K. Takahashi, S. Kinugasa, D. Kawaguchi, Y. Takahashi and Y. Matsushita, Macromolecules, 2012, 45, 369–373 CrossRef CAS.
- O. A. Serenko, V. I. Roldugin, N. A. Novozhilova, M. A. Soldatov, G. G. Nikiforova, M. V. Mironova, S. O. Ilyin, V. G. Kulichikhin and A. M. Muzafarov, Polym. Sci., Ser. A, 2015, 57, 586–595 CrossRef CAS.
- J. Jancar, J. F. Douglas, F. W. Starr, S. K. Kumar, P. Cassagnau, A. J. Lesser, S. S. Sternstein and M. J. Buehler, Polymer, 2010, 51, 3321–3343 CrossRef CAS.
- M. Wong, R. Tsuji, S. Nutt and H.-J. Sue, Soft Matter, 2010, 6, 4482 RSC.
- J. M. Kropka, K. W. Putz, V. Pryamitsyn, V. Ganesan and P. F. Green, Macromolecules, 2007, 40, 5424–5432 CrossRef CAS.
- L. M. Hall and K. S. Schweizer, J. Chem. Phys., 2008, 128, 234901 CrossRef PubMed.
- F. Morgenroth, C. Kübel and K. Müllen, J. Mater. Chem., 1997, 7, 1207–1211 RSC.
- U.-M. Wiesler, Charakterisierung und Funktionalisierung von Polyphenylen-Dendrimeren, PhD thesis, Johannes Gutenberg University, 2000.
Footnote |
| † Electronic supplementary information (ESI) available. See DOI: 10.1039/c7ra08152a |
| This journal is © The Royal Society of Chemistry 2017 |