
 Open Access Article
 This Open Access Article is licensed under a
 Creative Commons Attribution 3.0 Unported Licence
A helium nanodroplet setup for mid and far-infrared spectroscopy using pulsed-free-electron lasers: vibrational spectra of propargyl alcohol†
Devendra Mania,
Theo Fischera,
Raffael Schwana,
Arghya Deyab,
Britta Redlichb,
A. F. G. Van der Meerb,
Gerhard Schwaab a and
Martina Havenith*a
a and
Martina Havenith*a
aLehrstuhl für Physikalische Chemie II, Ruhr Universität Bochum, 44801 Bochum, Germany. E-mail: martina.havenith@rub.de
bRadboud University, Institute for Molecules and Materials, FELIX Laboratory, 6525 ED Nijmegen, The Netherlands
First published on 27th November 2017
Abstract
Our microscopic understanding of intermolecular interactions has increased considerably from the studies on isolated molecular clusters. The intermolecular modes for these clusters are located in far-infrared and terahertz regions and provide a sensitive test of the potential energy surface. Here we report a helium droplet setup (BoHeNDI@FELIX), which is coupled with free electron lasers, FEL-I and FEL-II, at the FELIX laboratory in Nijmegen. These lasers provide tunable radiation in the range of 66–3600 cm−1, covering the intermolecular modes, with average output power of 0.1–0.8 W and spectral bandwidth of 0.2–5% of the central frequency. Mass-selective infrared spectra of propargyl alcohol were recorded in the frequency range of 560–1600 cm−1, which demonstrate the performance of the new setup. The observed vibrational bands could be assigned to the gauche conformer of propargyl alcohol. The high power and micropulse structure of the FELIX radiation allow multiple excitations of the embedded molecules allowing spectral detection with a signal to noise of 10, even in the low-frequency region.
I. Introduction
The properties of bulk matter are a manifestation of the interplay among the constituting atoms and molecules. To understand the origin of these properties and to be able to tweak them, it is important to study the structure and dynamics of small to medium-sized molecular building blocks of the matter.1–3 Formation of isolated molecular clusters is the first step for such studies. Different techniques, such as molecular beam,1–4 rare gas/parahydrogen matrix5–8 and helium nanodroplet9–12 isolation, have successfully been employed for this purpose. Spectroscopic studies on such molecular clusters have provided a great deal of information at the microscopic level.13–16 Moreover, high-resolution gas phase spectra in the far-infrared range have allowed deducing intermolecular potential with the highest precision.17,18Helium nanodroplets provide an ideal environment to study molecules and molecular clusters in isolation.9–12 In combination with high-power laser sources and mass-selective detection, spectroscopy in helium nanodroplets has developed into a powerful method for the study of molecular structure and ultracold reactions.12,19–22 The droplets are superfluid at their equilibrium temperature, 0.37 K,23 allowing the embedded molecules to rotate nearly freely, as demonstrated by the rovibrational population of the molecules. Low vapour pressure dopants, such as metals, ionic liquids, salts etc., can easily be embedded due to the large pickup cross-section of the droplets.12,24 The size of the molecular clusters is controllable by varying the partial pressures of the dopants. Due to the fact that energy and momentum conservation can be achieved by evaporation of helium atoms, large molecular clusters can be easily formed and investigated in these droplets.
Detection of the absorption bands of the molecules, embedded in helium nanodroplets, is based on the fact that the relaxation of the vibrationally excited molecules takes place by dissipation of the molecular excitation energy into the droplets, followed by evaporative cooling of the droplets back to 0.37 K. The evaporation of the helium results in a reduction of the ionisation cross-section for electron impact ionisation, eventually leading to a decrease in the net ion current, at the resonant frequencies, while using a mass spectrometer as a detector. The ion current is recorded as a function of radiation frequency, eventually yielding depletion spectra.9–12,23
Other than the dependence on the inherent molecular properties, such as oscillator strength, the intensities of the vibrational bands in helium nanodroplets, also depend on the resonant frequency and the output power of the probe laser. 5 cm−1 of energy is required to evaporate a single helium atom from the droplet, which means greater the resonant frequency, larger the evaporation of helium atoms, resulting in a better signal to noise.25 Therefore, this restricts the signal to noise ratio in the low-frequency range and necessitates the use of brilliant laser sources to evaporate a sufficient fraction of helium atoms from the droplets and to allow sensitive detection in the low-frequency, far-IR/THz, ranges.
However, in general, there is a scarcity of high resolution, powerful laser sources, which can cover a wide range of the spectrum in the far-IR/THz region. This restricts the study of clusters in this highly sensitive region. Quantum cascade lasers (QCLs) are available commercially, with peak powers up to 150 mW and cover a significant part of the mid-IR region (600–2600 cm−1)26–31 as well as parts of the THz region.32,33 The QCLs have been employed for spectroscopic studies in helium droplets.29–31 However, each QCL shows a strong power variation across its emission band, which typically covers only a frequency range of 50–200 cm−1. Thus, a full coverage of the frequency range with uniform power is still a challenge.
A setup where the broad spectral frequency coverage of a free electron lasers is combined with a helium nanodroplets machine, with a pulsed nozzle source, is operative at the Fritz-Haber-Institute, Berlin.34,35
The free electron laser at the FELIX laboratory at Radboud University is an ultrabright radiation source in the frequency range from 66 to 3600 cm−1, that have been used for the spectroscopy of molecular entities in helium nanodroplets.34–36
In this paper, we discuss our recent efforts to combine the free electron lasers, FEL-I and FEL-II at the FELIX laboratory, with a continuous nozzle helium nanodroplets setup. We have constructed a new helium nanodroplets machine, which is located at the FELIX laboratory (Bochum Helium NanoDroplets Isolation machine, BoHeNDI@FELIX) and is fully functional now. The radiation from the free electron lasers consists of a train of pulses of microsecond time duration. Each of these microsecond pulses further consists of several thousand pulses of picosecond duration. For the work described here the 1 GHz mode, with a temporal spacing of 1 nanosecond between these pulses, is applied. We will show below that our detection technique involves multiple excitations of the embedded molecule by the picosecond infrared pulses. In a proof of principle set of experiments at FELIX, we recorded the IR spectra of propargyl alcohol (C3H4O) in the frequency range 560–1600 cm−1. This molecule was selected particularly because it shows strong resonances in the mid and far-IR range. Moreover, propargyl alcohol is a molecule of great astrophysical interest. Its structural isomer propenal (C3H4O) has already been found in the interstellar medium37 and it has been speculated that propargyl alcohol might also be present in the interstellar medium.
Propargyl alcohol molecule has been studied earlier by various groups, mostly using microwave spectroscopy. The rotational spectra of this molecule were first reported by Hirota38 and were later revisited by Pearson and Drouin.39 The rotational spectra of its weakly bound complexes, Ar⋯propargyl alcohol40 and propargyl alcohol-dimer,41 have been reported by Mani and Arunan. The molecule and its complexes with water42 and acetylene43 have also been studied recently, using the matrix isolation technique. Propargyl alcohol has two stable conformers: the gauche conformer and the trans conformer which differ in the orientation of their OH moiety, with respect to the carbon chain. In agreement with the results presented here, in all the studies mentioned above, only the gauche conformer has been observed experimentally.
II. Helium nanodroplets machine at FELIX laboratory
The design of the helium nanodroplets machine at the FELIX laboratory is based on our previous setup,44,45 but incorporates some important changes, see Fig. 1. The machine consists of four vacuum chambers, which are differentially pumped and are interconnected using conflat flanges. Since many review articles, describing the experimental aspects of performing spectroscopy in helium nanodroplet, have already been published,11,12,19,20 we give only a brief summary with special attention to the specifications of the setup at the endstation in Nijmegen.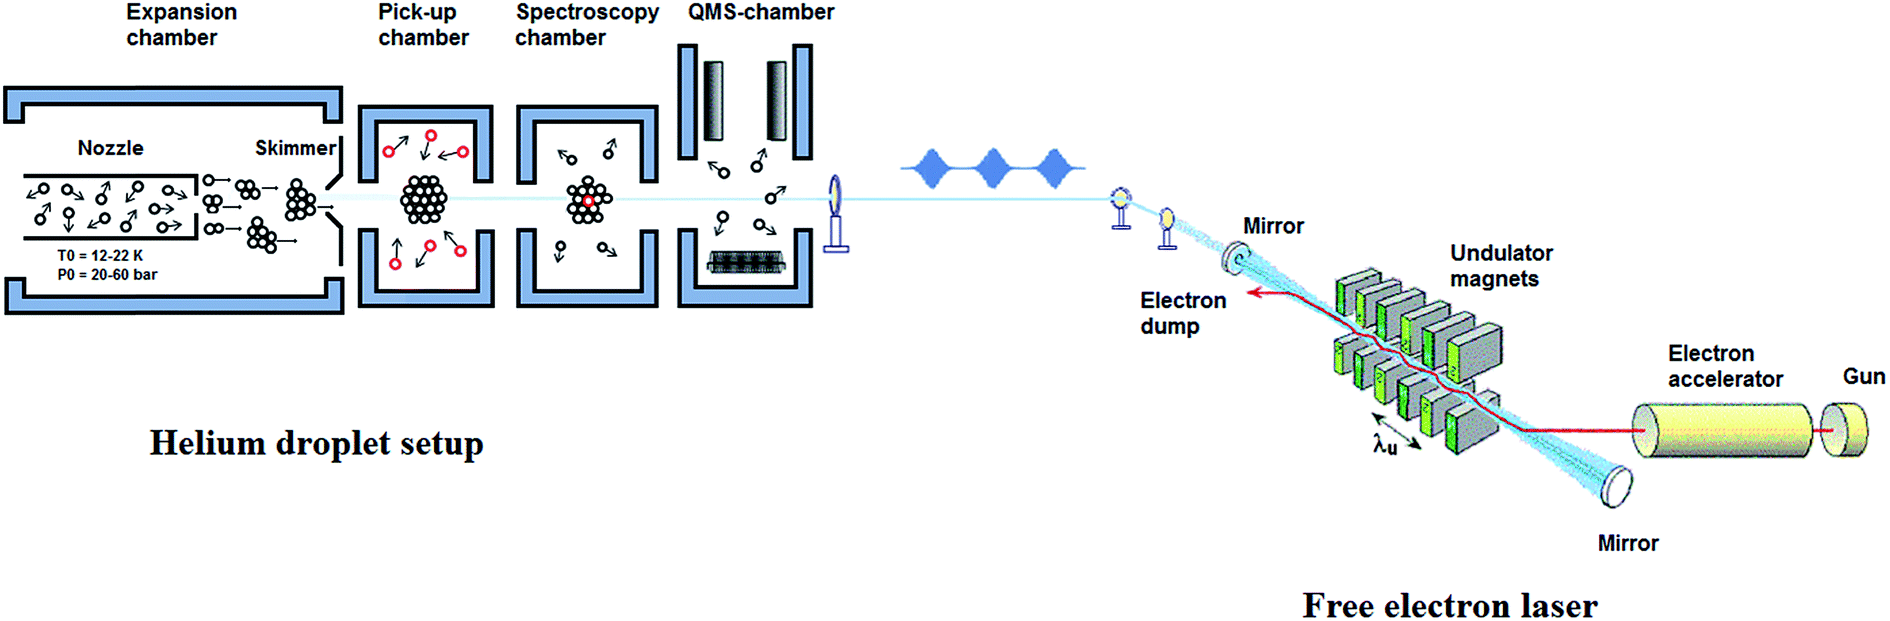 | ||
| Fig. 1 Schematics of the Bochum helium nanodroplet isolation machine at the FELIX laboratory (BoHeNDI@FELIX). The schematic of the free electron laser is shown in the right part of the figure (not to the scale). | ||
A. Generation of the helium nanodroplets
The helium droplets are generated by a continuous expansion of precooled (12–22 K), highly pressurized (20–60 bars), ultra-pure helium gas (99.9999% purity) through a nozzle of 5 μm diameter into the vacuum. The nozzle, which is hosted by the first chamber, Fig. 1, is cooled down using a combination of closed cycle helium compressor unit (Leybold Coolpak UCC 110S) and a coldhead (Leybold coolpower-130). The nozzle is maintained at 12–20 K using a temperature controller (Leybold, model 331). The nozzle holder is thermally separated from the cold plate by stainless steel spacers of 5 mm thickness to suppress fast thermal changes within each cooling cycle. Expansion of the pressurized helium gas through the precooled nozzle leads to the formation of the droplets. The droplet formation takes place in the initial stages of expansion, within a few diameters of the nozzle, as a result of collisional cooling. These droplets are highly directional in nature and are further collimated using a skimmer of 0.5 mm diameter, situated at a distance of ∼3 cm from the nozzle orifice. The collimated droplet beams then enter the pickup chamber, which is maintained at a lower pressure than the expansion chamber (typically 10−7 mbar). In this chamber, the helium droplets further cool down through evaporative cooling, until they attain their equilibrium temperature, 0.37 K for He-4. The droplets are superfluid in nature and act as nanoreactor that can readily solvate any molecule that comes into contact. The high sensitivity of the droplets towards picking up almost any substance makes it utmost important to have the beam path free of impurities. After passing through the spectroscopy chamber, the clusters reach the last vacuum chamber, which hosts a quadrupole mass spectrometer as a detector. Routinely, we obtain a background pressure of 8.0 × 10⁻¹¹ mbar in this chamber.B. Doping of the droplets
In the pickup chamber, dopant molecules are added. The pressure of the pickup chamber with helium beam, is typically 5.0 × 10⁻⁷ mbar, so dopants with a vapour pressure higher than this value are easily embedded into the droplets. After pickup, energy and momentum conservation is achieved via evaporative cooling. The cross section for the pickup is determined by the droplet size. The thermal energy of the dopant molecules rapidly dissipates by evaporation of helium atoms from the droplet and they quickly equilibrate to the droplet temperature of 0.37 K, with a typical cooling rate of 1010 K s−1.46 Thus, by tailoring the droplet size to the number of dopants, using optimized expansion conditions, small to medium-sized molecular clusters can easily be produced from the step-wise aggregation on such pre-cooled moieties. For gaseous or liquid samples, with vapour pressure significantly higher than the pickup chamber pressure, doping is achieved using a dosing valve which connects the sample line to the pickup chamber. In the case of solid samples, with very low vapour pressure, an oven is used to bring the samples into gas phase via heating.24,47For spatially confined pickup regions, it is well established that the pick-up of molecules by the droplets follows a Poisson statistics, provided the pickup process does not lead to a significant reduction in the droplet size. The probability of a pickup of ‘k’ atom per molecules by a droplet is given by:
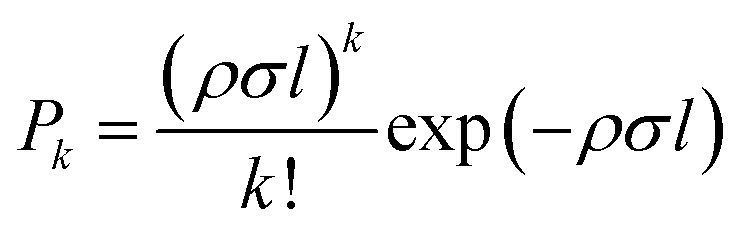 | (1) |
III. The radiation source, excitation of the molecules and detection of the vibrational features
The radiation, in the range of 66–3600 cm−1, is produced by the free electron lasers (FELs), FEL-I and FEL-II, at the FELIX laboratory. The operating principle and technical details of these lasers are summarized elsewhere.48 Some specific features of the FELIX radiation are discussed below.The FELIX radiation consists of macropulses of ∼5–8 μs duration, with a repetition rate of 10 Hz. The FELIX pulse structure is shown in Fig. 2. Each macropulse consists of a train of several thousand bandwidth-limited micropulses of a few ps duration, spaced by ∼1 ns. The energy for each micropulse is up to 20 μJ and for each macropulse up to 80 mJ. The spectral bandwidth of each macropulse can be selected in the range of 0.2–5% of the central frequency (FWMH). For the frequency range 560–1600 cm−1, covered in this work, the spectral bandwidth was optimised to 0.2–0.5% of the central frequency.
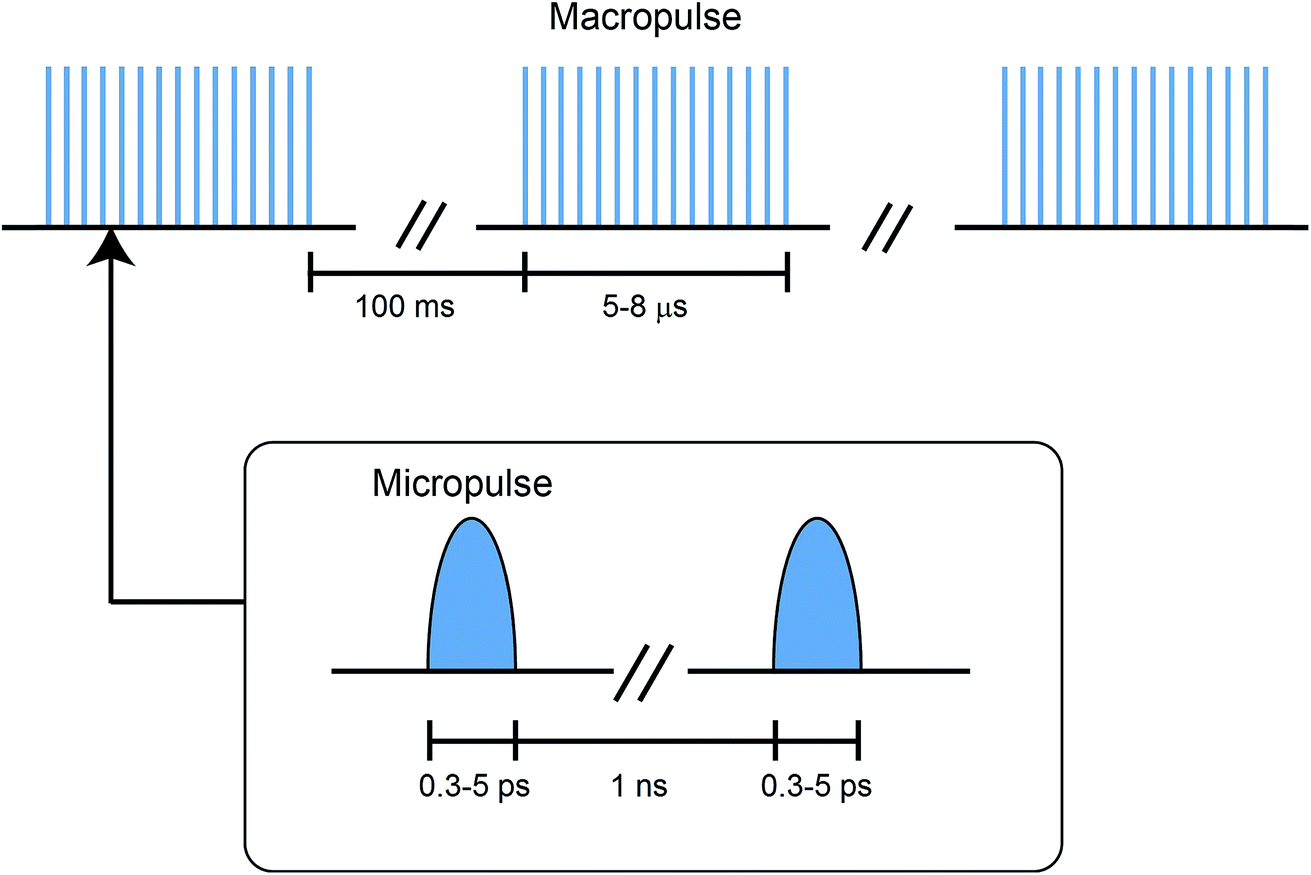 | ||
| Fig. 2 Pulse structure of the FELIX free electron laser radiation. | ||
The FELIX beam is aligned antiparallel and collinear to the droplet beam, as shown in Fig. 1. Undoped helium droplet beams are transparent to the IR radiation. However, in the case of the droplet beams doped with molecular entities, the embedded molecule can absorb IR radiation. If the laser frequency is in resonance with a molecular vibrational transition, the molecule is vibrationally excited. During the subsequent vibrational relaxation, the vibrational energy is transferred to the helium nanodroplets, which results in the evaporation of the helium atoms. As mentioned earlier, evaporation of one helium atom from the droplets requires about 5 cm−1 of energy, i.e. ∼200 helium atoms will be evaporated as a result of the absorption of a photon of 1000 cm−1, and subsequent relaxation of this energy to the droplets. The vibrational relaxation takes place at a nanosecond timescale in helium droplets.12 Hence, vibrational modes will relax between the micropulses, and therefore, can be excited multiple times by subsequent micropulses, within the duration of a single macropulse. This results in an increase in the number of evaporating helium atoms and consequently, in an improved signal to noise ratio that is proportional to the total pulse energy within a macropulse. Any evaporation of the helium atoms reduces the ionization cross section of the helium droplet and thus decreases the ion current of each of the fragments corresponding to the droplet that is monitored using a quadrupole mass spectrometer (Extrel QMS MAX-1000).
IV. Experimental details
Propargyl alcohol (99%) was purchased from Sigma-Aldrich and was used without further purification. Helium 6.0 was expanded from a pressure of 50 bars and was cooled to 15 K before the expansion. A quadrupole mass spectrometer, which is connected to the last vacuum chamber, Fig. 1, was used for the detection of the helium droplets. The mass spectrometer can be operated in two different modes: (a) the high-pass mode, where masses above a certain mass (m/z ≥ 8) can be detected and (b) the mass-selective mode, where ion current for a specific m/z value is detected. In this work, we used the mass-selective mode to record the IR spectra.V. Computational details
As mentioned before, propargyl alcohol can exist in the form of two conformers: as gauche- and as trans-conformer. Both the conformers were optimized at MP2/6-311+G(3df,2p) level of theory using the Gaussian software suite.49 The optimized structures are shown in Fig. 3. The two conformers differ in the orientation of their O–H moiety with respect to the carbon chain. The H–O–C–C dihedral angle is ∼57° for gauche-propargyl alcohol and ∼180° for trans-propargyl alcohol. The gauche-conformer is more stable than the trans conformer by 6.61 kJ mol−1. Also, the gauche conformer has two equivalent forms, gauche(+) and gauche(−) at H–O–C–C dihedral angle of ±57°. Accordingly, the predicted population ratio is ∼96![[thin space (1/6-em)]](https://www.rsc.org/images/entities/char_2009.gif) :4 for gauche:trans forms, at room temperature. For both the conformers, anharmonic frequencies were calculated using the VPT2 method,50 Table 1. The population normalised predicted spectra are shown in Fig. 7b and c.
:4 for gauche:trans forms, at room temperature. For both the conformers, anharmonic frequencies were calculated using the VPT2 method,50 Table 1. The population normalised predicted spectra are shown in Fig. 7b and c.
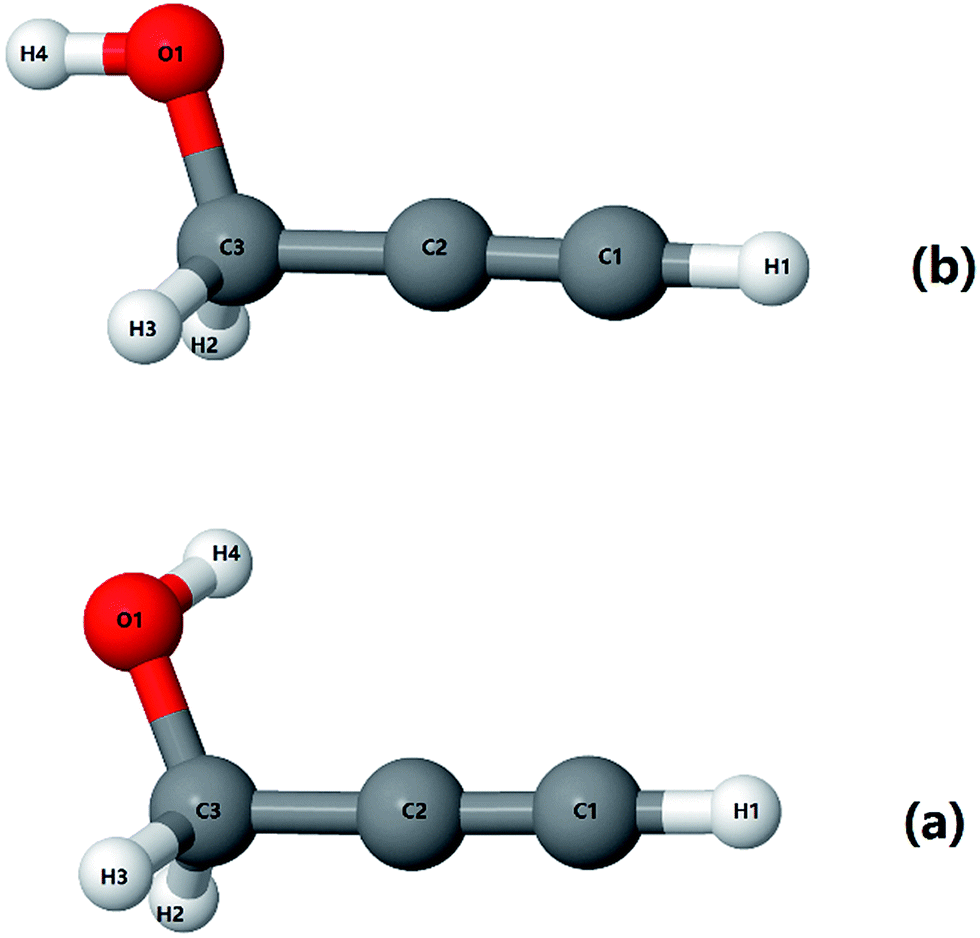 | ||
| Fig. 3 Optimized structures for (a) gauche-propargyl alcohol and (b) trans-propargyl alcohol at MP2/6-311+G(3df,2p) level. The C2C3O1H4 dihedral angle is 57° for the gauche conformer and ∼180° for the trans conformer. | ||
| Assignments | Observed transitions (cm−1) | Calculated anharmonic frequencies (cm−1) | ||
|---|---|---|---|---|
| He droplets | N2-Matrixa | gauche-PA | trans-PA | |
| a From ref. 24 and 25. | ||||
C2![[triple bond, length as m-dash]](https://www.rsc.org/images/entities/char_e002.gif) C1–H1 bend perpendicular to C–C–O plane C1–H1 bend perpendicular to C–C–O plane |
627 | 630.7 | 637.0 | 635.9 |
| C2C1–H1 bend in the C–C–O plane |
667 | 669.4 | 662.8 | 664.7 |
| C2–C3 stretch coupled with C3O1H4 bending | 900 | 905.0 | 912.5 | 912.6 |
| CH2 rocking coupled with C3O1H4 bending | 995 | 971.1 | 989.1 | 1014.8 |
| CO stretching | 1040 | 1040.8 | 1044.1 | 1044.2 |
| CH2 twist coupled with C3O1H4 bend | 1193 | 1201.5 | 1198.9 | — |
| CH2 wagging coupled with C3O1H4 bending | 1383 | 1389.8 | 1382.2 | 1410.0 |
VI. Results and discussions
A. Mass spectra
The mass spectrum of the pure helium droplets is shown in Fig. 4a. The spectrum is characterized by the appearance of peaks separated by 4 a.m.u., which correspond to the different fragments of the helium clusters, (He)n. The peak at m/z 18 corresponds to the residual water in the QMS chamber. These droplets were then doped with propargyl alcohol, by introducing propargyl alcohol vapour into the pickup chamber. The mass spectrum of the droplets embedding propargyl alcohol is shown in Fig. 4b. The peaks corresponding to propargyl alcohol fragments appear at m/z = 26, 27, 28, 29, 39, 53, 55, and 56. The most prominent peak at m/z = 39 corresponds to the C3H3+ fragment. To optimize the pickup of propargyl alcohol in helium droplets, mass spectra were recorded at different partial pressures of propargyl alcohol. Ion currents corresponding to m/z 39 and 55 are plotted as a function of propargyl alcohol partial pressure in Fig. 5a and b, respectively. We found that these ion currents have contributions from propargyl alcohol clusters of different sizes. The experimental data for both the mass channels could be best fitted with a summation of Poisson distribution (eqn (1)) for k = 1 and k = 3, Fig. 5a and b. This suggests that the contributions to these mass channels, 39 and 55, come mainly from monomer and trimer and these are not the preferred mass channels for the dimer. The optimum partial pressure for the pickup of a single propargyl alcohol molecule was estimated to be ∼1.0 × 10⁻⁶ mbar. The infrared spectra were measured at m/z = 39, which is the most prominent fragment for propargyl alcohol in helium droplets.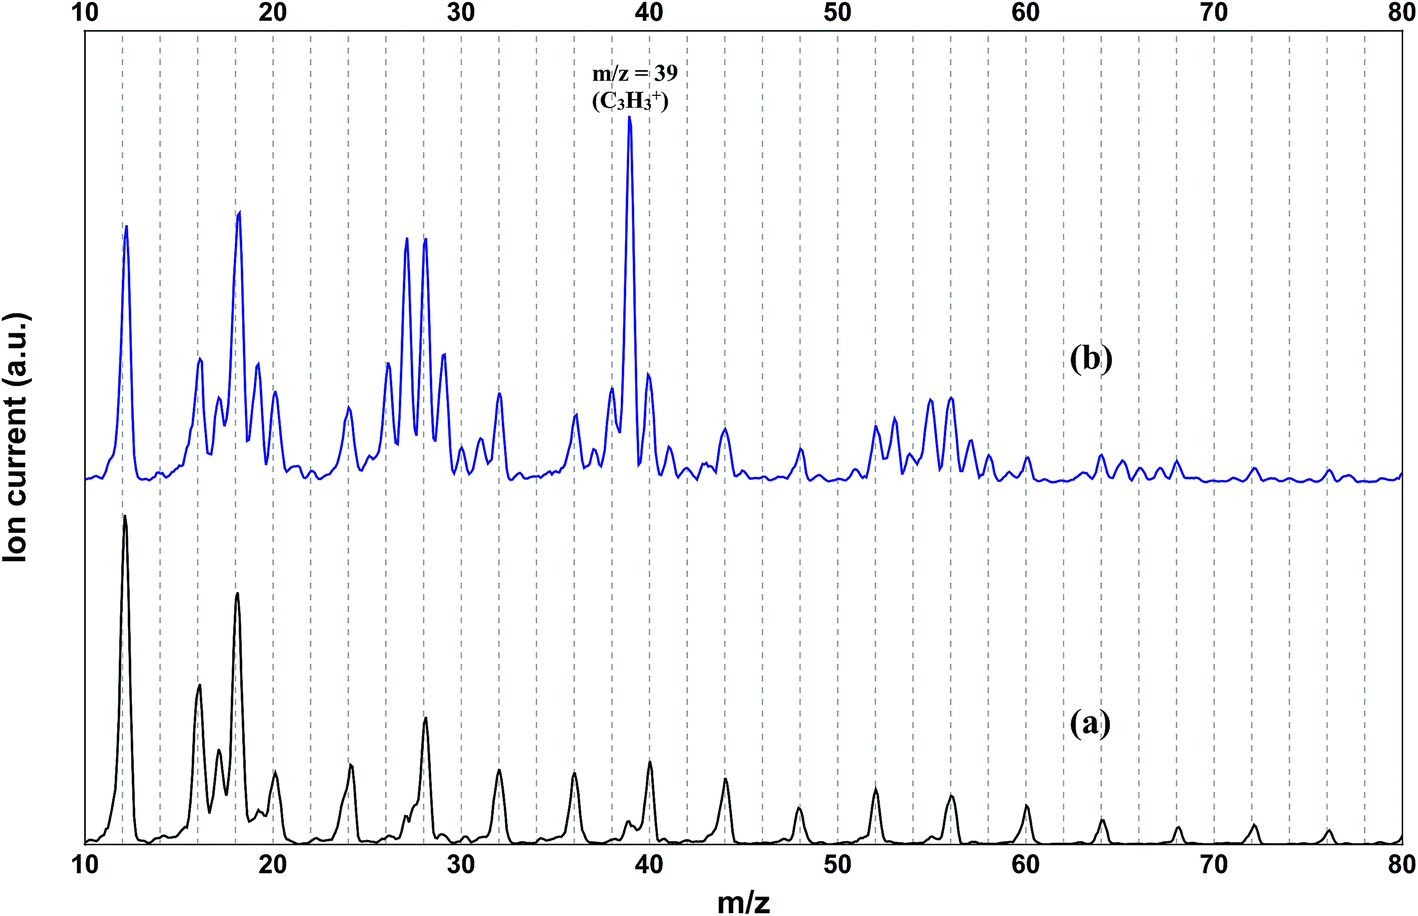 | ||
| Fig. 4 Mass spectrum of (a) undoped helium droplets and (b) helium droplets doped with propargyl alcohol (1.4 × 10⁻⁶ mbar partial pressure). | ||
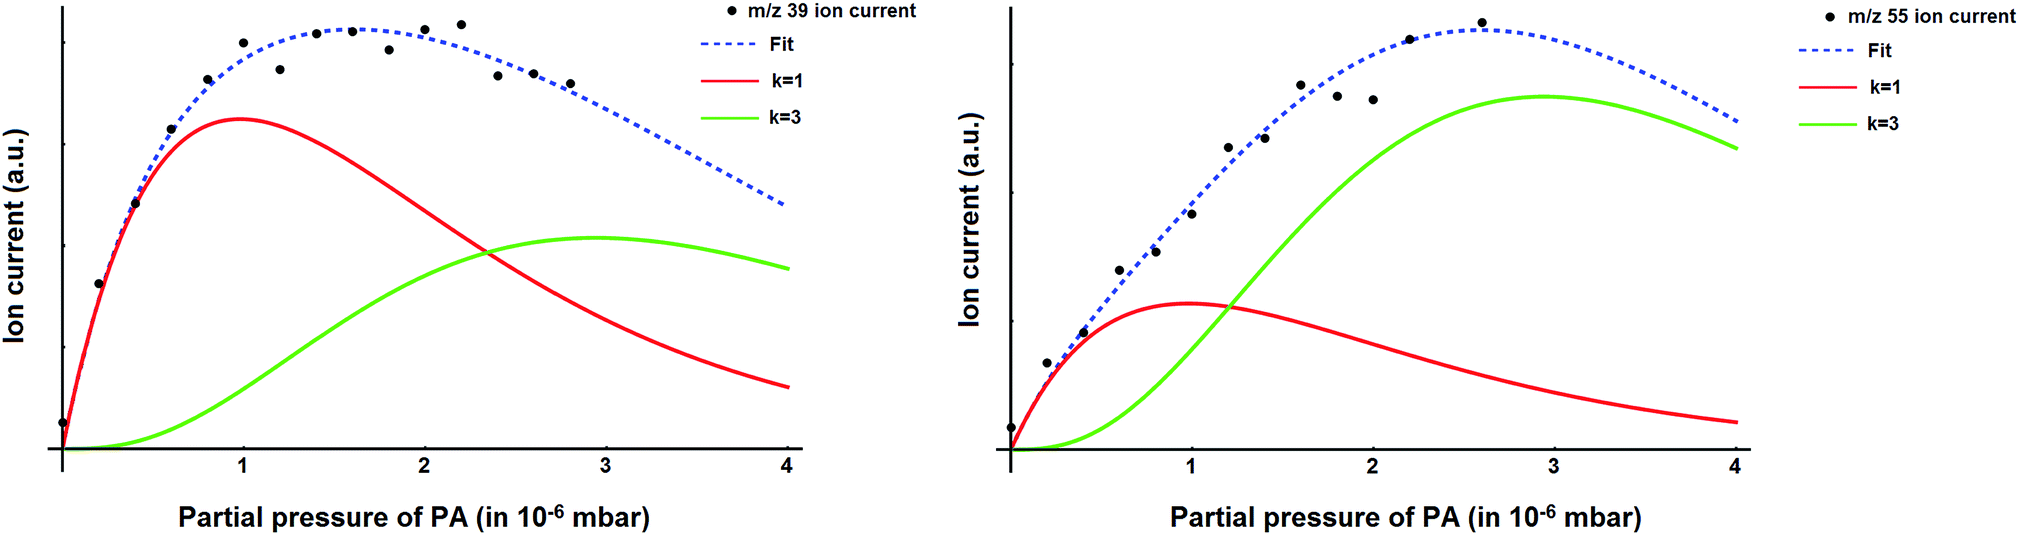 | ||
| Fig. 5 Variation of the ion current, corresponding to (a) m/z = 39 and (b) m/z = 55, with the partial pressure of propargyl alcohol. The Dashed blue curves represent a fit of the experimental ion currents to a summation of Poisson curves for k = 1 (monomer) and k = 3 (trimer). In red and green are the curves for k = 1 and k = 3, contributing to the overall fit. | ||
B. Infrared spectra of propargyl alcohol: extracting vibrational features from the ion current
The measurements were carried out in the frequency range of 560–1600 cm−1 with a step size of 2 cm−1. The ion current, corresponding to the mass channel m/z = 39, was recorded as a function of the laser frequency. The data acquisition was initiated by a trigger pulse, which was timed to arrive 10 ms before each FEL pulse. At each frequency step, the ion current was recorded as a time trace for 20 ms duration, starting 10 ms before the arrival of the FELIX laser pulse. Each time trace was digitized with 5000 points yielding one data point every 4 μs. A total of 100 such time traces were recorded at each frequency, to improve the signal to noise ratio, before proceeding further. For the integrated ion current we have summed up all the time traces. The result, for the frequency range 560–1500 cm−1, is shown in Fig. 6.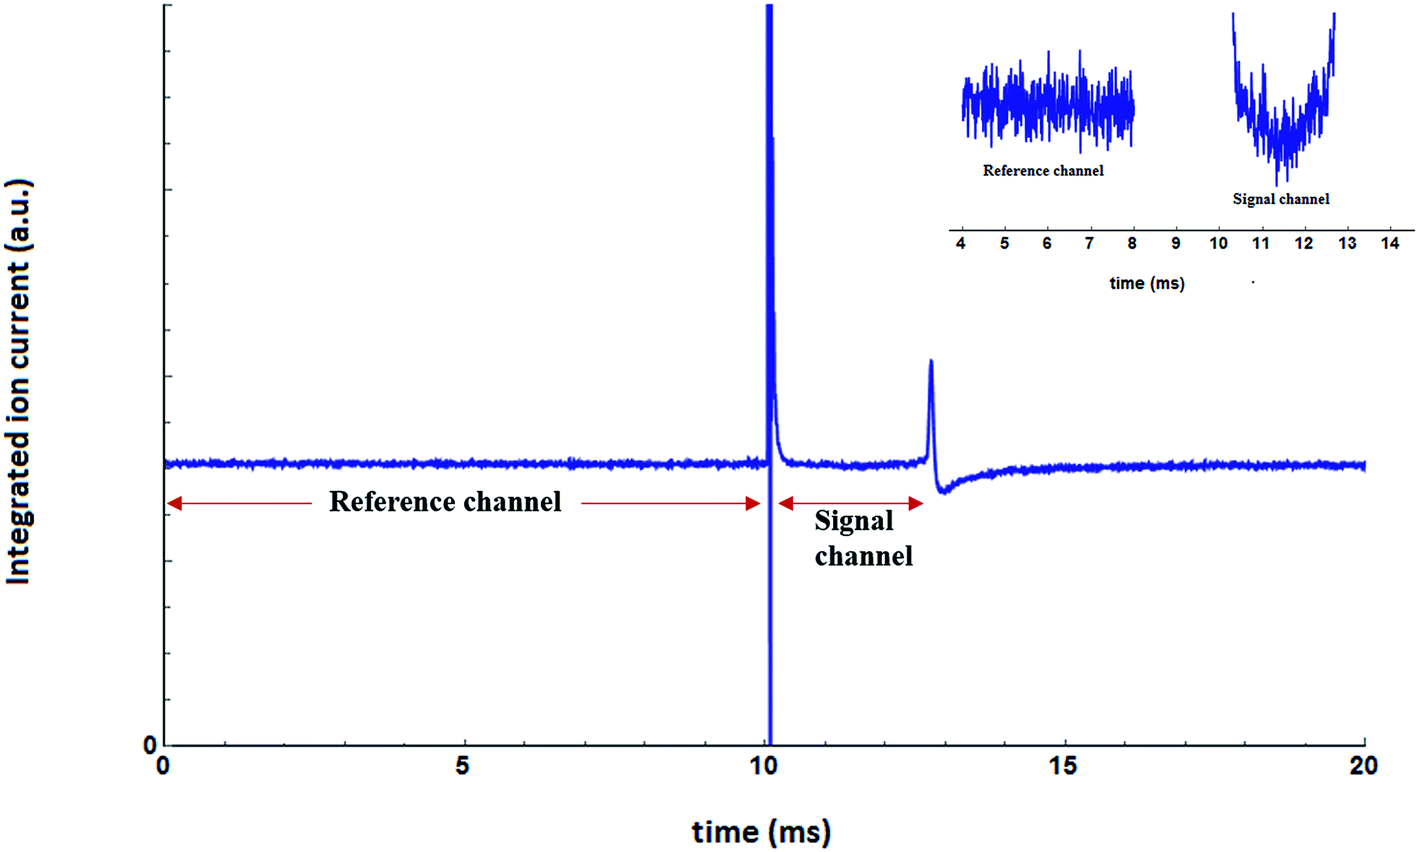 | ||
| Fig. 6 Integrated ion current as a function of time. A closer look at a part of the reference channel and the signal channel is shown in the inset. | ||
The ion current prior to the arrival of the laser pulse is used as a reference. A huge spike in ion current is observed as laser enters the QMS chamber through an optical window, as can be seen in Fig. 6 at around 10 ms. This is mostly due to the evaporation of the residual molecules from the optical window. The total flight time for the droplets is ∼3 ms, and the response of the dopant molecule to the laser radiation, if any, should be present within this time window. This is reflected in the integrated ion current shown in Fig. 6. The ion current shows a dip between ∼10.5 and 13 ms. This time window is termed as the “signal” window. At around 13 ms, there is again a sudden change in the integrated ion current. This is the manifestation of the laser pulse hitting the skimmer, which leads to a change in the ion current. Afterward, the ion current slowly reaches the value of ion current in the “reference” window. For spectroscopy, we focus on two time-windows; 0–10 ms for reference and ∼10.5–12.7 ms for the signal. For each time trace, the mean value of the ion current of the signal window is divided by the mean value of the ion current in the reference window.
The result for propargyl alcohol is shown in Fig. 7a. The prominent absorption bands are found at 627, 667, 900, 995, 1040, 1193 and 1383 cm−1. The signal to noise of the measured spectra is ∼10 for the strongest signal, even though the spectra were measured mass selectively and not integrated over all masses m/z > 8. The percentage depletion for the most intense feature (at 627 cm−1) was observed to be ∼11%. In Fig. 7, we also compare the experimentally observed spectra to the calculated spectra for the two conformers of propargyl alcohol. The calculated spectra have been normalised with respect to the predicted ratio of gauche and trans-conformers in the sample. The experimentally observed bands could be easily assigned to the different modes of gauche-propargyl alcohol on the basis of calculated spectra. It can be seen that due to the low population of the trans-conformer the vibrational bands are expected to be too weak to be detected. Furthermore, for most of the transitions, the predicted band frequencies for the two conformers are too close to allow an unambiguous assignment. However, the bands corresponding to the C–O stretch (1382.1 cm−1 for gauche-propargyl alcohol and 1410.0 cm−1 for trans-propargyl alcohol) and CH2 rocking (989.1 for gauche-propargyl alcohol and 1014.8 cm−1 for trans-propargyl alcohol) are separated by more than 20 cm−1. Also, the band at 1236 cm−1 appears to be a distinctive feature for the trans conformer. Though some weak features are present in the observed spectra, for example at 1241 cm−1, Fig. 7a, which might be due to the trans-conformer, but it is difficult to make a definitive assignment due to a very low intensity. In Table 1, the frequencies for the observed and predicted bands are summarized. We also list the observed band centres from the experiments in N2-matrix.43 When comparing the band position for propargyl alcohol in helium droplets and N2 matrix, we find that the matrix effects are small for most of the bands.
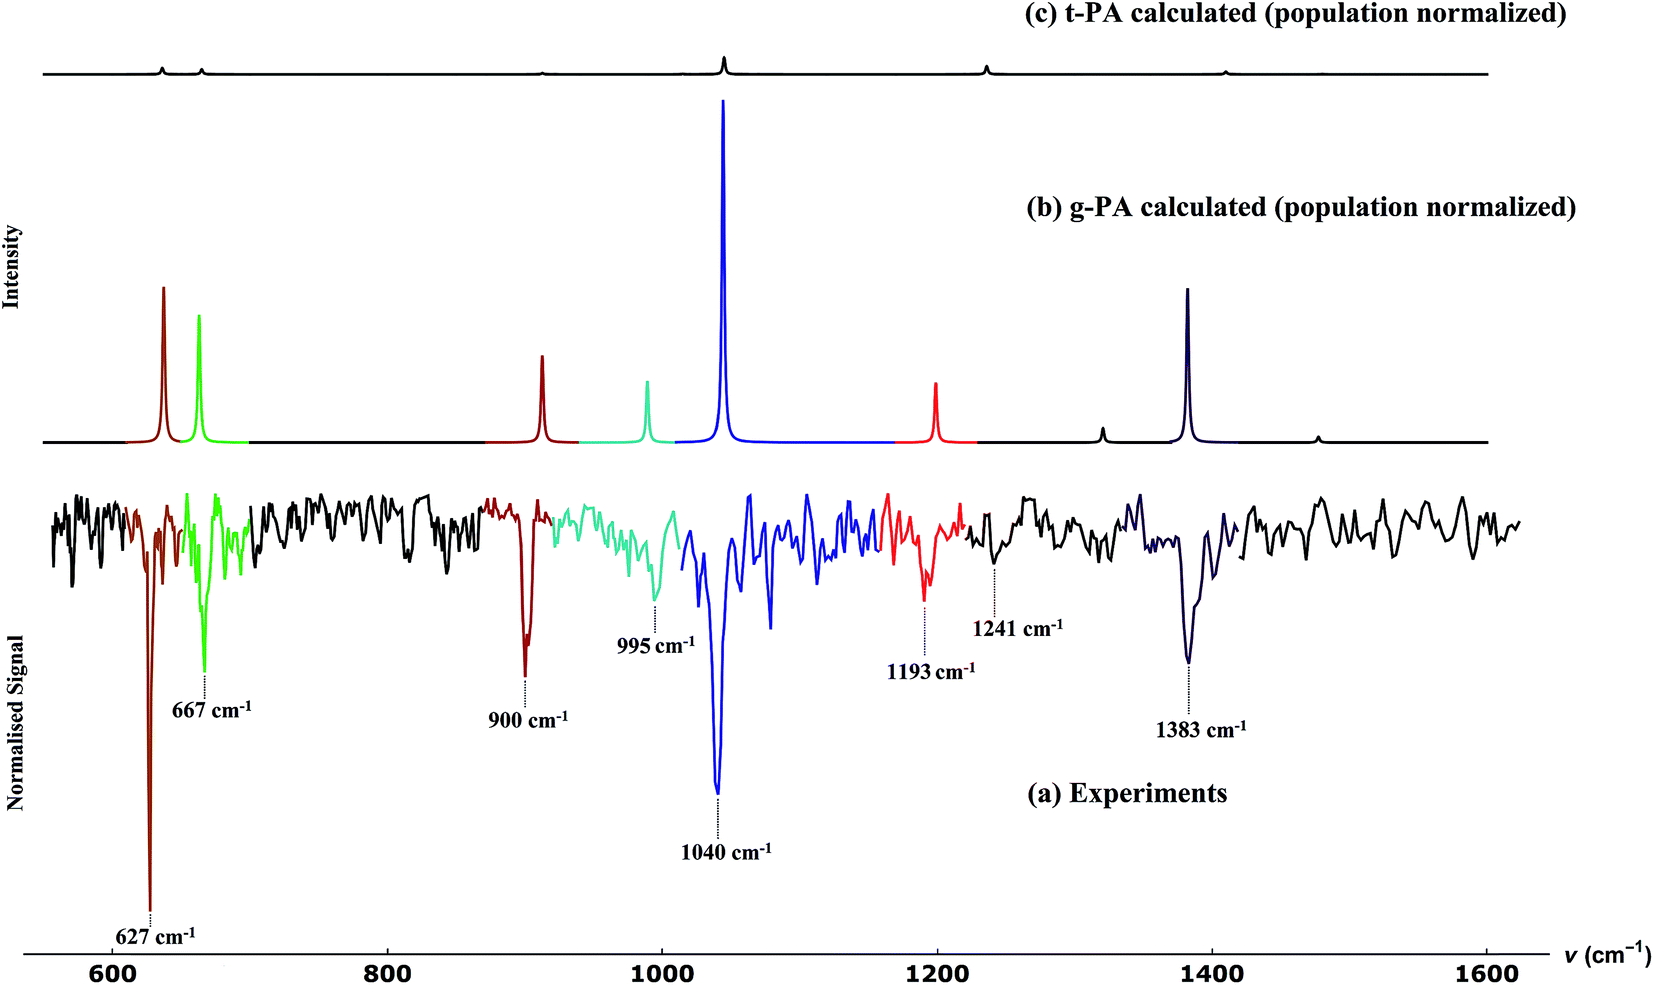 | ||
| Fig. 7 Comparison between (a) experimentally observed spectra and calculated spectra for (b) gauche- and (c) trans-propargyl alcohol. Experimental spectra were measured at m/z = 39, which corresponds to the propargyl cation C3H3+. The calculations were performed at MP2/6-311+G(3df,2p) level of theory and the spectral intensities were normalized to the Boltzmann population of the gauche and trans-structures, at room temperature. The colours represent the assignments of the experimental vibrational bands to the predictions for the gauche conformer. | ||
VII. Conclusions
In this paper, we describe the new helium nanodroplet user station at the FELIX laboratory. The mass-selective spectra of propargyl alcohol could be recorded in the frequency range of 560–1600 cm−1, using the powerful free electron lasers at the FELIX laboratory. The observed vibrational features could be assigned to different vibrational modes of the gauche conformer of propargyl alcohol molecule. We recorded IR spectra with a good signal to noise ratio (S/N ∼10 for the strongest signal in the measured range) despite the fact that the interaction of each micropulse with the embedded molecule and laser radiation is restricted to only ∼5–8 μs. Due to the brilliance of the FELIX laser pulses, this new set-up is a powerful spectroscopic tool for future measurements covering the entire frequency range from 66 cm−1 up to 3600 cm−1.Conflicts of interest
There are no conflicts to declare.Acknowledgements
We gratefully acknowledge the Stichting voor Fundamenteel Onderzoek der Materie (FOM) for the support of the FELIX Laboratory. This work received financial support from the Cluster of Excellence RESOLV (EXC 1069) funded by the Deutsche Forschungsgemeinschaft.References
- D. H. Levy, Annu. Rev. Phys. Chem., 1980, 31, 197–225 CrossRef CAS.
- J. M. Hutson, Annu. Rev. Phys. Chem., 1990, 41, 123–154 CrossRef CAS.
- A. M. Rijs and J. Oomens, Gas-phase IR spectroscopy and structure of biological molecules, Springer, 2015, vol. 364 Search PubMed.
- W. Demtröder, Laser spectroscopy in molecular beams, in Laser Spectroscopy 2, Springer, 2015, pp. 183–224 Search PubMed.
- H. Matsuura, H. Yoshida, M. Hieda, S. Y. Yamanaka, T. Harada, K. Shin-Ya and K. Ohno, J. Am. Chem. Soc., 2003, 125, 13910–13911 CrossRef CAS PubMed.
- M. Halupka and W. Sander, Spectrochim. Acta, Part A, 1998, 54, 495–500 CrossRef.
- T. Momose and T. Shida, Bull. Chem. Soc. Jpn., 1998, 71, 1–15 CrossRef CAS.
- K. Yoshioka, P. L. Raston and D. T. Anderson, Int. Rev. Phys. Chem., 2006, 25, 469–496 CrossRef CAS.
- K. K. Lehmann, Science, 1998, 279, 2065–2066 CrossRef CAS.
- J. P. Toennies and A. F. Vilesov, Annu. Rev. Phys. Chem., 1998, 49, 1–41 CrossRef CAS PubMed.
- C. Callegari, K. K. Lehmann, R. Schmied and G. Scoles, J. Chem. Phys., 2001, 115, 10090–10110 CrossRef CAS.
- M. Y. Choi, G. E. Douberly, T. M. Falconer, W. K. Lewis, C. M. Lindsay, J. M. Merritt, P. L. Stiles and R. E. Miller, Int. Rev. Phys. Chem., 2006, 25, 15–75 CrossRef CAS.
- R. N. Pribble and T. S. Zwier, Science, 1994, 265, 75–79 CAS.
- K. Liu, J. D. Cruzan and R. J. Saykally, Science, 1996, 271, 929–933 CAS.
- J. O. Richardson, C. Perez, S. Lobsiger, A. A. Reid, B. Temelso, G. C. Shields, Z. Kisiel, D. J. Wales, B. H. Pate and S. C. Althorpe, Science, 2016, 351, 1310–1313 CrossRef CAS PubMed.
- J. M. Headrick, E. G. Diken, R. S. Walters, N. I. Hammer, R. A. Christie, J. Cui, E. M. Myshakin, M. A. Duncan, M. A. Johnson and K. D. Jordan, Science, 2005, 308, 1765–1769 CrossRef CAS PubMed.
- R. C. Cohen and R. J. Saykally, Annu. Rev. Phys. Chem., 1991, 42, 369–392 CrossRef CAS.
- F. N. Keutsch and R. J. Saykally, Proc. Natl. Acad. Sci. U. S. A., 2001, 98, 10533–10540 CrossRef CAS PubMed.
- J. P. Toennies and A. F. Vilesov, Angew. Chem., Int. Ed., 2004, 43, 2622–2648 CrossRef CAS PubMed.
- F. Stienkemeier and K. K. Lehmann, J. Phys. B: At., Mol. Opt. Phys., 2006, 39, R127–R166 CrossRef CAS.
- S. Müller, S. Krapf, T. Koslowski, M. Mudrich and F. Stienkemeier, Phys. Rev. Lett., 2009, 102, 183401 CrossRef PubMed.
- D. Habig, D. Leicht, M. Kaufmann, G. Schwaab and M. Havenith, J. Chem. Phys., 2014, 141, 44312 CrossRef PubMed.
- M. Hartmann, R. E. Miller, J. P. Toennies and A. Vilesov, Phys. Rev. Lett., 1995, 75, 1566–1569 CrossRef CAS PubMed.
- K. Hanke, M. Kaufmann, G. Schwaab, M. Havenith, C. T. Wolke, O. Gorlova, M. A. Johnson, B. P. Kar, W. Sander and E. Sanchez-Garcia, Phys. Chem. Chem. Phys., 2015, 17, 8518–8529 RSC.
- M. Lewerenz, B. Schilling and J. P. Toennies, J. Chem. Phys., 1995, 102, 8191 CrossRef CAS.
- J. Faist, F. Capasso, D. L. Sivco, C. Sirtori, A. L. Hutchinson and A. Y. Cho, Science, 1994, 264, 553–556 CAS.
- M. Beck, D. Hofstetter, T. Aellen, J. Faist, U. Oesterle, M. Ilegems, E. Gini and H. Melchior, Science, 2002, 295, 301–305 CrossRef CAS PubMed.
- J. Devenson, D. Barate, O. Cathabard, R. Teissier and A. N. Baranov, Appl. Phys. Lett., 2006, 89, 191115 CrossRef.
- T. Liang, S. D. Flynn, A. M. Morrison and G. E. Douberly, J. Phys. Chem. A, 2011, 115, 7437–7447 CrossRef CAS PubMed.
- R. Schwan, M. Kaufmann, D. Leicht, G. Schwaab and M. Havenith, Phys. Chem. Chem. Phys., 2016, 18, 24063–24069 RSC.
- M. Kaufmann, D. Leicht, R. Schwan, D. Mani, G. Schwaab and M. Havenith, Phys. Chem. Chem. Phys., 2016, 18, 28082–28090 RSC.
- B. S. Williams, Nat. Photonics, 2007, 1, 517–525 CrossRef CAS.
- W. T. S. Cole, N. C. Hlavacek, A. W. M. Lee, T.-Y. Kao, Q. Hu, J. L. Reno and R. J. Saykally, Chem. Phys. Lett., 2015, 638, 144–148 CrossRef CAS.
- F. Bierau, P. Kupser, G. Meijer and G. von Helden, Phys. Rev. Lett., 2010, 105, 133402 CrossRef PubMed.
- E. Mucha, A. I. González Flórez, M. Marianski, D. A. Thomas, W. Hoffmann, W. B. Struwe, H. S. Hahm, S. Gewinner, W. Schöllkopf, P. H. Seeberger, G. von Helden and K. Pagel, Angew. Chem., Int. Ed., 2017, 56, 11248–11251 CrossRef CAS PubMed.
- X. Zhang, N. B. Brauer, G. Berden, A. M. Rijs and M. Drabbels, J. Chem. Phys., 2012, 136, 44305 CrossRef PubMed.
- http://science.gsfc.nasa.gov/691/cosmicice/interstellar.html.
- E. Hirota, J. Mol. Spectrosc., 1968, 26, 335–350 CrossRef CAS.
- J. C. Pearson and B. J. Drouin, J. Mol. Spectrosc., 2005, 234, 149–156 CrossRef CAS.
- D. Mani and E. Arunan, ChemPhysChem, 2013, 14, 754–763 CrossRef CAS PubMed.
- D. Mani and E. Arunan, J. Chem. Phys., 2014, 141, 164311 CrossRef PubMed.
- J. Saini and K. S. Viswanathan, J. Mol. Struct., 2016, 1118, 147–156 CrossRef CAS.
- K. Sundararajan, R. Gopi and N. Ramanathan, J. Mol. Struct., 2016, 1121, 26–34 CrossRef CAS.
- K. Von Haeften, S. Rudolph, I. Simanovski, M. Havenith, R. E. Zillich and K. B. Whaley, Phys. Rev. B: Condens. Matter Mater. Phys., 2006, 73, 054502 CrossRef.
- M. Ortlieb, Ö. Birer, M. Letzner, G. W. Schwaab and M. Havenith, J. Phys. Chem. A, 2007, 111, 12192–12199 CrossRef CAS PubMed.
- J. P. Toennies and A. F. Vilesov, Angew. Chem., Int. Ed., 2004, 43, 2622–2648 CrossRef CAS PubMed.
- J. Reho, U. Merker, M. R. Radcliff, K. K. Lehmann and G. Scoles, J. Chem. Phys., 2000, 112, 8409 CrossRef CAS.
- D. Oepts, A. F. G. van der Meer and P. W. van Amersfoort, Infrared Phys. Technol., 1995, 36, 297–308 CAS.
- M. J. Frisch, G. W. Trucks, H. B. Schlegel, G. E. Scuseria, M. A. Robb, J. R. Cheeseman, G. Scalmani, V. Barone, B. Mennucci, G. A. Petersson, H. Nakatsuji, M. Caricato, X. Li, H. P. Hratchian, A. F. Izmaylov, J. Bloino, G. Zheng, J. L. Sonnenberg, M. Hada, M. Ehara, K. Toyota, R. Fukuda, J. Hasegawa, M. Ishida, T. Nakajima, Y. Honda, O. Kitao, H. Nakai, T. Vreven, J. A. Montgomery Jr, J. E. Peralta, F. Ogliaro, M. Bearpark, J. J. Heyd, E. Brothers, K. N. Kudin, V. N. Staroverov, T. Keith, R. Kobayashi, J. Normand, K. Raghavachari, A. Rendell, J. C. Burant, S. S. Iyengar, J. Tomasi, M. Cossi, N. Rega, J. M. Millam, M. Klene, J. E. Knox, J. B. Cross, V. Bakken, C. Adamo, J. Jaramillo, R. Gomperts, R. E. Stratmann, O. Yazyev, A. J. Austin, R. Cammi, C. Pomelli, J. W. Ochterski, R. L. Martin, K. Morokuma, V. G. Zakrzewski, G. A. Voth, P. Salvador, J. J. Dannenberg, S. Dapprich, A. D. Daniels, O. Farkas, J. B. Foresman, J. V. Ortiz, J. Cioslowski and D. J. Fox, Gaussian 09, Revision D.01, Gaussian, Inc., Wallingford CT, 2013 Search PubMed.
- V. Barone, J. Chem. Phys., 2005, 122, 014108 CrossRef PubMed.
Footnote |
| † Electronic supplementary information (ESI) available: Coordinates of the optimized geometries, calculated harmonic and anharmonic frequencies with mode description. See DOI: 10.1039/c7ra08102b |
| This journal is © The Royal Society of Chemistry 2017 |