 Open Access Article
Creative Commons Attribution 3.0 Unported Licence
Effect of soft segment molecular weight on the glass transition, crystallinity, molecular mobility and segmental dynamics of poly(ethylene oxide) based poly(urethane–urea) copolymers
Oguzhan Oguz ab,
Stefanos A. Koutsoumpisc,
Eren Simsek†
ab,
Emel Yilgord,
Iskender Yilgor*d,
Polycarpos Pissis*c and
Yusuf Z. Menceloglu
ab,
Stefanos A. Koutsoumpisc,
Eren Simsek†
ab,
Emel Yilgord,
Iskender Yilgor*d,
Polycarpos Pissis*c and
Yusuf Z. Menceloglu *ab
*ab
aFaculty of Engineering and Natural Sciences, Materials Science and Nano Engineering, Sabanci University, 34956, Orhanli, Tuzla, Istanbul, Turkey. E-mail: yusufm@sabanciuniv.edu
bSabanci University Integrated Manufacturing Technologies Research and Application Center, Composite Technologies Center of Excellence, Teknopark Istanbul, 34906 Pendik, Istanbul, Turkey
cDepartment of Physics, National Technical University of Athens, Iroon Polytechneiou 9, Zografou Campus, 157 80, Athens, Greece. E-mail: ppissis@central.ntua.gr
dKUYTAM Surface Science and Technology Center, Chemistry Department, Koc University, Sariyer, 34450, Istanbul, Turkey. E-mail: iyilgor@ku.edu.tr
First published on 18th August 2017
Abstract
The effect of poly(ethylene oxide) (PEO) soft segment molecular weight (Mn = 2000, 4600 and 8000 g mol−1) on the glass transition, crystallinity, molecular mobility and segmental dynamics of a series of aliphatic polyurethaneurea copolymers (PUU) with a constant hard segment content of 30% by weight was investigated using differential scanning calorimetry and dielectric relaxation spectroscopy. The soft segment (PEO) glass transition temperature increased with increasing molecular weight. Furthermore, five different relaxations were observed in dielectric analyses of all copolymers. These included local glassy state motions (γ) and (β), segmental motion of the soft phase (α), conductivity relaxation, and interfacial Maxwell–Wagner–Sillars (MWS) polarization. Local relaxations follow Arrhenius behavior and their time scale is not affected by the soft segment molecular weight. α-Relaxation follows Vogel–Tammann–Fulcher (VTF) behavior and is slower for the copolymer based on PEO-4600. Conductivity relaxation and the interfacial MWS polarization also follow VTF behavior and have quite similar slopes since both are related to the same phenomena. Unexpectedly, the interfacial MWS polarization is not affected by the soft segment molecular weight. Although this result suggests that the soft segment molecular weight does not affect the microphase separation in these copolymers, we believe that no safe conclusions can be extracted for this system due to the high complexity and the presence of many phases with different conductivity. However, significant differences were observed in the conductivity relaxation, which is much faster for the copolymer based on PEO-2000, due to its lower crystallinity when compared with others.
1. Introduction
Segmented polyurethaneurea copolymers (PUU) consist of alternating soft and hard segments chemically linked together along a linear macromolecular backbone. Due to their versatile chemistry and interesting combination of properties, PUUs can be utilized in a wide range of applications, such as coatings, biomaterials and textiles fibers.1–4 In general, soft segments (SS) are hydroxyl or amine terminated aliphatic polyethers, polyesters, polycarbonates, polyisobutylene and polydimethylsiloxane oligomers with glass transition temperatures (Tg) well below room temperature. Hard segments (HS) consist of strongly hydrogen bonded urethane and/or urea groups, which are obtained by the reaction of diisocyanates with diol or diamine chain extenders. They mainly serve as stiff, physically cross-linked domains with a Tg or Tm well above the service temperature range. Availability of a large selection of starting materials provides opportunities for the preparation of a wide range of PUU backbone structures with different properties. PUUs display composition dependent microphase morphologies or nanostructures and interesting combination of bulk and surface properties.1–4 However, microphase separation, crystallization, molecular mobility and segmental dynamics are quite complex due to the presence of large number of parameters which need to be controlled during PUU synthesis, processing and thermal annealing. These parameters mainly include chemical structure, size and distribution of sequence lengths and HS/SS ratio, which leads to various equilibrium morphologies ranging from mixed amorphous SS/HS phases to well microphase separated morphologies. Therefore, a good understanding of the relationships between microphase separation, segment crystallization, molecular mobility and segmental dynamics is of particular interest to tailor the final properties of PUUs.Fairly large number of studies3,4 have been, and continues to be, carried out on the investigation of the structure-morphology-property behavior of segmented PUUs. Interestingly, number of systematic studies focusing on the molecular mobility and segmental dynamics in PUUs are considerably limited in the literature.5–9 Furthermore, segmented copolymers with a relatively narrow range of soft segment molecular weights (generally, up to 2000 g mol−1) and urethane type (rather than urea) hard segments were utilized in most of these studies. More specifically, although widely used in the design and synthesis of segmented PUUs, to the best of our knowledge, the molecular mobility and segmental dynamics of poly(ethylene oxide) (PEO) based PUUs have not been investigated in detail as a function of soft segment molecular weight. From this perspective, here, we mainly focused on the molecular mobility and segmental dynamics of a series of PEO-based segmented PUU copolymers with an identical hard segment content of 30 wt%, using differential scanning calorimetry (DSC) and dielectric relaxation spectroscopy (DRS). DSC is a well-known technique to investigate the thermal properties of polymeric materials.10,11
On the other hand, DRS12 is a powerful technique to investigate the dynamics of complex polymeric systems over a very broad range of frequencies. Thus, morphology dependent dynamic processes taking place in polymers, which are on multiple length scales and different time scales can be identified in an effort to understand the structural states of these materials.13–28 To date, various polymeric materials have been, and continues to be, analyzed by DRS.13–20 In polyurethanes, this technique is mainly used to investigate the local dynamics, dynamic glass transition and indirectly, crystallinity and microphase morphology.21–28 Combination of DSC and DRS enables us to gain a complete understanding of the structural variables, such as soft segment type and molecular weight and hard segment structure and content on the molecular mobility and segmental dynamics in polyurethanes.
PEO is a convenient choice for the design of the soft segments in PUUs due to the following reasons; (i) availability of reactive PEO oligomers with a wide range of molecular weights, (ii) conformational properties of the ethylene oxide units and molecular weight dependent crystallization of PEO blocks leading to various physical states in PUUs, (iii) amphiphilic nature of PEO chains due to the presence of hydrophobic methylene groups and hydrophilic oxygen atoms that can participate in hydrogen bonding, and (iv) presence of extensive literature data on the folding and crystallization behavior of PEOs as a function of chain length.29–35 Therefore, the use of PEOs with various molecular weights allows for the preparation of PUUs with different morphologies. However, PEO based PUUs also present some challenges due to their structurally and dynamically heterogeneous building blocks. One of these challenges is the investigation of the molecular mobility and segmental dynamics of these copolymers due to high conductivity of PEO. In this study, we focus on the effect of PEO molecular weight on the glass transition, crystallinity, molecular mobility and segmental dynamics in PEO based PUU copolymers.
2. Experimental
2.1. Materials
Poly(ethylene oxide)glycol oligomers (PEO) with 〈Mn〉 values of 2000, 4600 and 8000 g mol−1 were purchased from Merck. Bis(4-isocyanatocyclohexyl)methane (HMDI) was provided by Bayer and had a purity better than 99.5%. Chain extender, 2-methyl-1,5-diaminopentane (MDAP) was supplied by DuPont. Dibutyltin dilaurate (DBTDL) was obtained from Witco and was used as catalyst by diluting to 1% by weight in tetrahydrofuran. Reagent grade 2-propanol (IPA), tetrahydrofuran (THF) and dimethylformamide (DMF) were obtained from Merck. All chemicals were used as received.2.2. Synthesis of segmented poly(ether–urethane–urea) copolymers
PUUs were prepared by prepolymer method outlined in our previous studies.4,36 Reactions were carried out in three-neck, round bottom, Pyrex reaction flasks equipped with an overhead stirrer, thermometer and an addition funnel. Isocyanate terminated prepolymer was prepared in THF (50% solids by weight) at 60 °C by reacting PEO and HMDI, under the catalysis of 150 ppm of DBTDL. Progress and completion of the prepolymer reaction was monitored by FTIR spectroscopy. After the completion of prepolymer reaction in about 1 h, the solution was cooled down to room temperature and diluted to 25% by weight of solids using DMF. MDAP was dissolved in DMF (about 10% by weight) and added dropwise from the addition funnel into the reaction mixture until the complete disappearance of the isocyanate peak at 2260 cm−1. The viscosity increase during the chain extension reaction was controlled by adding DMF into the reaction flask. Chemical structure of the PUU copolymers is shown in Fig. 1.2.3. Preparation of polymer films
Polymer films were prepared by solution casting in a Teflon mold. Solvent was first evaporated at room temperature overnight in a fume hood, followed by drying in an air oven at 60 °C for 24 hours. Complete removal of the solvents was achieved by drying the films in a vacuum oven at 60 °C until constant weight. This was also confirmed by thermogravimetric analyses of the film samples (data not shown in the study). Samples based on PEO-2000, 4600 and 8000 with 30 wt% urethane–urea HS were denoted as PU-2, PU-5 and PU-8, respectively. After annealing at 60 °C for 24 hours the films were kept at room temperature in a desiccator for a week, to achieve equilibrium morphologies.2.4. Characterization techniques
Gel Permeation Chromatography (GPC) analyses were performed using a Viscotek GPCmax VE-2001 instrument equipped with D 5000-D 3000-D 1000-D Guard columns and RI, LS, DP detectors. DMF was used as the solvent and analysis was performed at 55 °C with a flow rate of 1 mL min−1. Polymer solutions were prepared in DMF at a concentration of 2 mg mL−1. The samples were filtered using VMR PTFE syringe filters with average pore size of 0.45 μm before measurements. Average molecular weights were determined using calibration curves obtained from polystyrene standards. PU-2, PU-5 and PU-8 have weight average molecular weights of 100![[thin space (1/6-em)]](https://www.rsc.org/images/entities/char_2009.gif) 000, 232
000, 232![[thin space (1/6-em)]](https://www.rsc.org/images/entities/char_2009.gif) 000 and 309
000 and 309![[thin space (1/6-em)]](https://www.rsc.org/images/entities/char_2009.gif) 000 g mol−1, and number average molecular weights of 68
000 g mol−1, and number average molecular weights of 68![[thin space (1/6-em)]](https://www.rsc.org/images/entities/char_2009.gif) 000, 164
000, 164![[thin space (1/6-em)]](https://www.rsc.org/images/entities/char_2009.gif) 000 and 209
000 and 209![[thin space (1/6-em)]](https://www.rsc.org/images/entities/char_2009.gif) 500 g mol−1 with molecular weight distributions of 1.48, 1.42 and 1.47, respectively.
500 g mol−1 with molecular weight distributions of 1.48, 1.42 and 1.47, respectively.
X-ray diffraction (XRD) studies of the film samples (an average thickness of 0.2 mm) were performed on a Bruker D8 Advance X-ray Diffractometer using Ni-filtered Cu-Kα radiation (λ = 0.1542 nm). All measurements were performed from 5 up to 90° with a step size of 0.01°. The results were plotted as a function of the scattering angle 2θ without applying any fitting procedure.
Stress–strain analyses were performed on dog-bone type specimens punched out of thin films using a standard die (ASTM D 1708). Measurements were made on a Zwick Z100 model tester under ambient temperature and humidity conditions with a crosshead speed of 25.0 mm min−1 (Lo = 24.0 mm). At least five specimens were tested for each material.
Differential Scanning Calorimetry (DSC) analyses were performed on a TA Q2000 instrument calibrated with indium standard and equipped with Tzero functionality that significantly improves the baseline via compensating resistance and capacitance imbalances. All measurements were performed in the range of −160 and 250 °C at a heating and cooling rate of 3 °C min−1 under nitrogen atmosphere. Glass transition temperature (Tg) and the heat capacity change at Tg (ΔCp at Tg) were determined by the inflection point and the tangent methods, respectively. The degree of crystallinity (crystalline fraction – Xc) is calculated using the melting enthalpy normalized by the weight fraction of the hard segment, assuming that it does not contribute to the crystallinity of the soft segment:
Dielectric Relaxation Spectroscopy (DRS) studies were conducted on a Novocontrol Alpha Analyzer. Samples were placed between two brass electrodes, forming a capacitor of known area and thickness equal to the thickness of each sample. The complex dielectric function ε* was studied in the frequency range of 10−1 to 106 Hz. Temperature was varied from −150 °C to 20 °C for PU-2 and PU-5 and from −60 °C to 20 °C for PU-8. The relaxations are evident as peaks in the dielectric loss ε′′ spectra, which can be described using the Havriliak–Negami (H–N) function:37
where (fmax) is the frequency of ε′′(f) peak, (T) the temperature, (f0) a pre-exponential constant, Eact the activation energy of the relaxation and (k) the Boltzmann's constant. The Vogel–Tammann–Fulcher (VTF) equation, characteristics of cooperative processes, was used to describe the time scale dependence on temperature,38
where (B) is the apparent activation energy, (f0) the pre-exponential frequency factor and (T0) the Vogel temperature. The strength parameter was calculated as D = B/T0 and the fragility as m = 16 + 590/D.39
Another formalism we can use is that the electric modulus (M), defined as M* = 1/ε*, which has been proven effective in analyzing ionic conductivity and interfacial effects in amorphous materials.40 Conductivity and conductivity effects were analyzed in terms of ac conductivity (σac) calculated as σac = 2πfε0ε′′(f), where (ε0) is the permittivity of free space.40
3. Results and discussion
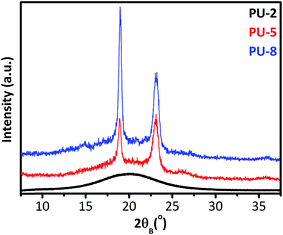
To provide a clear overview on the dynamics of PU copolymers, it is important to know the structural characteristics of PU copolymers along with their microphase morphologies and final properties. For this reason, before going into the results and discussion of dielectric studies, we report the results obtained from XRD, DSC and stress–strain analyses of the samples under investigation. Fig. 2 shows the room temperature XRD patterns of PUU samples. The XRD results basically suggest that PEO matrix in PU-2 is mainly amorphous, while those in PU-5 and PU-8 are semi-crystalline at room temperature.As shown in Fig. 2, PU-5 and PU-8 display typical X-ray diffraction patterns widely observed for monoclinic crystal structure of helical PEO chains,29,31,34 whereas PU-2 shows an amorphous halo. The scattering angles of the main XRD peaks observed in PU-5 and PU-8 for crystalline PEO segments are in good agreement with those reported in the literature for the helical model of the crystalline PEO along with their hkl indexing and lattice parameters of the monoclinic unit cell listed as (a): 0.805 nm, (b): 1.304 nm and (c): 1.948 nm with β = 125.4° (the oblique angle between the a- and c-axis).28,30,33 The (120) reflections (2θ = 19.3°) taken along the [001] zone axis have information about interchain separations and chain conformations, i.e., the orientation of the helix, whereas the (112) reflections (2θ = 23.2°) contains structural information along the c-axis, i.e., the helicity of PEO macromolecules.41 This may be a convenient framework to investigate the presence of a “secondary structure” in crystalline parts of soft domains in PU-5 and PU-8 in a further study.
Thermal properties of PUs are strongly dependent on the annealing conditions. In this study, all samples were annealed for 24 hours at 60 °C and then kept at room temperature in a desiccator for a week, to achieve equilibrium morphologies. DSC thermograms of PU copolymers are provided in Fig. 3. The results obtained from the thermal analyses of the samples are listed in Table 1. As can be seen in Fig. 3 and Table 1, PU-2 copolymer shows a well-defined glass transition at −57.2 °C with a heat capacity change (ΔCp at Tg) of 0.485 J g−1 K−1, followed by a small exotherm between −50 and −25 °C and an endotherm at 19.9 °C. PU-5 and PU-8 copolymers, which are highly crystalline when compared to PU-2, display very weak glass transition temperatures at −51.9 and −48.9 °C with ΔCp at Tg values of 0.113 and 0.058 J g−1 K−1, followed by sharp endotherms at 42.1 and 51.2 °C, respectively. The glass transitions at −57.2, −51.9 and −48.9 °C are assigned to the PEO soft segments of PU-2, PU-5 and PU-8 copolymers, respectively. As expected, Tg of PEO soft segment increases with increasing molecular weight.42 As listed in Table 1, the endothermic peaks at 19.9, 42.1 and 51.2 °C are attributed to the melting points (Tm) of PEO soft segment crystals in PU-2, PU-5 and PU-8, respectively. The degree of soft segment crystallinity (Xc) values are calculated as 32.6, 43.5 and 56.4% for PU-2, PU-5 and PU-8, respectively. Tm and Xc values also increases with increasing molecular weight. No other high temperature exothermic and/or endothermic transitions are observed for any samples. As listed in Table 1, a decreasing trend in the ΔCp at Tg is observed. In line with the increasing trend in Tg, the decreasing trend in ΔCp at Tg indicates the restriction imposed on the chain movements due to increasing soft segment crystallinity as a direct result of increasing soft segment molecular weight. It should be also noted that the magnitude of ΔCp at Tg is significantly higher in PU-2 copolymer when compared with those of PU-5 and PU-8. This is due to that PEO soft segments in PU-5 and PU-8 are inherently more crystalline when compared with PU-2. These results are in accordance with the results obtained from XRD analyses of the copolymers as given in Fig. 2. To clarify, one should note that the melting endotherm observed in PU-2 copolymer is below room temperature, and thus, X-ray diffraction pattern shows an amorphous halo. In contrast, the melting endotherms observed in PU-5 and PU-8 are far above room temperature. Therefore, their XRD patterns clearly display the characteristic peaks of PEO crystals as described earlier.
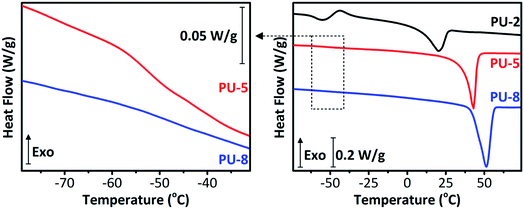 | ||
| Fig. 3 The glass transition region in DSC thermograms of PU-5 and PU-8 (left) and complete DSC thermograms of PU-2, PU-5 and PU-8 (right) in the range of −75 and 75 °C. | ||
| Sample | Tg (°C) | ΔCp at Tg (J g−1 K−1) | Tm (°C) | DSCΔHm (J g−1) | normalizedΔHm (J g−1) | Xc (%) |
|---|---|---|---|---|---|---|
| PU-2 | −57.2 | 0.485 | 19.9 | 44.9 | 64.1 | 32.6 |
| PU-5 | −51.9 | 0.113 | 42.1 | 59.9 | 85.5 | 43.5 |
| PU-8 | −48.9 | 0.058 | 51.2 | 77.6 | 110.9 | 56.4 |
In addition to the results obtained from XRD and DSC analyses, the stress–strain properties of the copolymers are also provided in Table 2. As listed in Table 2, the tensile test results clearly demonstrate the formation of high strength elastomers, with ultimate tensile strength values around 30 MPa, under the applied processing condition. Since the HS content is constant for all the copolymers reported in here, no significant difference is observed in the ultimate tensile strengths. The elastic modulus values of the copolymers increase with increasing PEO molecular weight. In line with XRD and DSC results, the modulus of PU-5 and PU-8 with highly crystalline PEO matrices are significantly higher than the one of PU-2 with an amorphous PEO matrix at room temperature. Accordingly, the elongation at break value of PU-2 is remarkably higher than the ones of PU-5 and PU-8 copolymers due to the presence of highly mobile amorphous matrix phase in this copolymer. In addition, the elongation at break values decrease with increasing PEO molecular weight.
| Sample code | Modulus (MPa) | Tensile strength (MPa) | Elongation (%) |
|---|---|---|---|
| PU-2 | 5.0 ± 0.5 | 30 ± 1 | 1000 ± 40 |
| PU-5 | 140 ± 14 | 29 ± 1 | 620 ± 20 |
| PU-8 | 360 ± 15 | 27 ± 2 | 430 ± 30 |
3.1. Dielectric relaxation spectroscopy (DRS) studies
Five different relaxations were observed in dielectric analyses of all copolymers: local glassy state motions (γ and β), segmental motion of the soft phase (α), conductivity relaxation (CR), and interfacial Maxwell–Wagner–Sillars (MWS) polarization. All of them are discussed in detail in the following sections along with the room temperature measurements.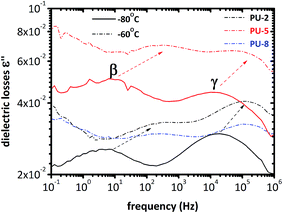 | ||
| Fig. 4 Dielectric losses at −80 °C and −60 °C for PU-2, PU-5 and PU-8. Two local relaxations, β and γ, are within the frequency windows in these temperatures. | ||
As can be seen in Fig. 4, two peaks are observed at −80 °C. The peak at low frequencies corresponds to the β-relaxation, whereas the one at high frequencies is attributed to the γ-relaxation. As expected, these two peaks are shifted to the higher frequencies by increasing the temperature due to the thermally activated polarization phenomena. This can also be clearly seen in the spectra recorded at −60 °C in Fig. 4. Moreover, the frequency of the peaks is the same for all three samples. Thus, the relaxation times of the γ and β relaxations are not significantly affected by PEO molecular weight. It should also be noted that the relative heights of these two peaks are different for PU-5 compared to the other two samples.
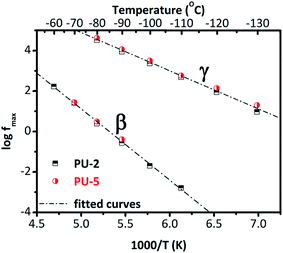
To quantify the results, Arrhenius plots are provided for these two relaxations in Fig. 5. For each isotherm, one Havriliak–Negami function was fitted to β and γ relaxations. Temperature–frequency pairs of the relaxation peaks were determined when they started to converge during the fitting process.37 It should be noted that PU-8 was not systematically measured at low temperatures compared to PU-2 and PU-5 since the local relaxations (β and γ) were at the same frequency for all three samples as shown in Fig. 4. For this reason, the Arrhenius plot for β and γ relaxations provided in Fig. 5 is constructed using the data obtained from the analyses of PU-2 and PU-5. As expected, both of the relaxations (β and γ) follow a straight line, which is characteristic for local motions.38
Activation energies calculated for these two relaxations from Fig. 5 are listed in Table 3. The activation energy for β-relaxation (0.67 eV ≈ 64.7 kJ mol−1) is almost double of that of γ-relaxation (0.38 eV ≈ 36.7 kJ mol−1), even though these two relaxations have similar time scales. This is counterbalanced by the high value of (f0) for the β-relaxation. The parameter (f0) is related with lattice vibrations. The unexpectedly high value of f0 reflects some cooperativity in this relaxation.38 In general, the activation parameters of the β-relaxation show a scattering in the literature,26,28,43 most probably reflecting different hydration levels of the samples studied.
| γ | β | ||||
|---|---|---|---|---|---|
| Eact | log(f0) | Eact | log(f0) | ||
| (eV) | (kJ mol−1) | (eV) | (kJ mol−1) | ||
| 0.38 | 36.7 | 14.4 | 0.67 | 64.7 | 18.1 |
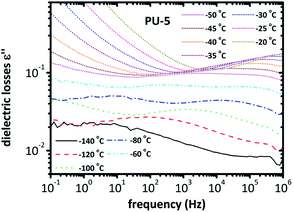 | ||
| Fig. 6 Spectra of dielectric losses for PU-5 as a function of frequency, in the temperature range of −140 °C to −20 °C. | ||
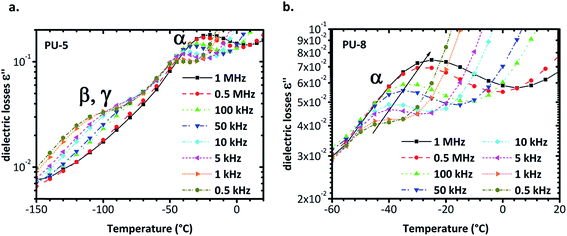
The isotherms given in Fig. 6 clearly indicate that a more complex analysis is needed for a better understanding of the segmental relaxation and dynamic glass transition behavior in this system. The high conductivity of the PU-urea samples originates from PEO and, in previous studies on PU nanocomposites based on the much less conductive poly(tetramethylene glycol) (PTMG) as soft segment, the α-relaxation was clearly observed in the ε′′ spectra.43 Analysis based on the frequency derivative of ε′, which is known to result in curves similar to ε′′ without the contribution of dc-conductivity,44 did not reveal the α-relaxation. This stresses the fact that the phenomena that hide the peaks of ε′′ are not related to dc-conductivity but rather to some Maxwell–Wagner–Sillars (MWS) polarization,27,40 or conductivity relaxation.24,45 For this reason, we followed another analysis approach. The isothermal data were re-plotted into the isochronal diagrams, which are provided in Fig. 7 and Fig. 8, where the change in dielectric losses as a function of temperature are plotted at constant frequency of 1 MHz, where the peak is clearly apparent and the conductivity effects are minor. Positions of α-relaxation peaks, which are related to the glass transition temperatures of the materials, are provided in Fig. 7. The α-relaxation seems slightly slower for PU-5 compared to PU-2 and PU-8, which have similar time scales.
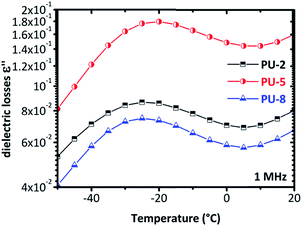 | ||
| Fig. 7 The isochronal diagrams for PUUs at a frequency of 1 MHz. The peak of the PU-5 is slightly shifted to higher temperatures compared to the other two copolymers (PU-2 and PU-8). | ||
Isochronal diagrams of dielectric losses versus temperature for PU-5 and PU-8 are provided in Fig. 8. For frequencies higher than 0.5 kHz, two peaks are observed for PU-5 in Fig. 8a, one at low temperature, which is a superposition of β and γ relaxations, and the other at temperatures higher than −50 °C with peak values of ε′′ in the order of 10−1, due to α-relaxation. Both peaks move to higher temperatures with increasing frequency, as expected for the thermally activated molecular polarizations. Although it is not visible in the isothermal plots, the temperature range and the height of the peak in the isochronal diagrams validate our assumption. To provide a better comparison, α-relaxation peak was plotted for PU-8 in Fig. 8b. The peak was first observed above 0.5 kHz around −50 °C as a rather weak one and then shifted to the higher temperatures and became much more apparent as the frequency increased.
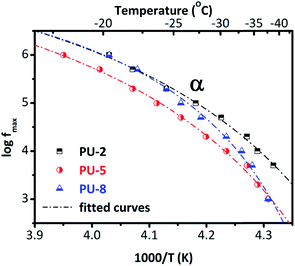
To provide a better overview, we provide the Arrhenius plot in Fig. 9, for all three samples. As can be seen in Fig. 9, these curves are not linear (as it was for β and γ relaxations given in Fig. 5) but concave. This is a typical feature of the segmental dynamics and α-relaxation38 and confirms our assumptions about the origin of the peak. By looking at the Arrhenius plot for the α-relaxation (Fig. 9), we can see that the time scale of the relaxation for PU-2 and PU-8 is the same (at least at high temperatures) but it is slightly slower in the case of PU-5. In addition, the curves of PU-2 and PU-8 have different shape that basically indicates different cooperativity. Furthermore, the α-relaxation follows a VTF temperature dependence. The equivalent time of the relaxation for the DSC is τ = 100 s, so by translating this into frequency in the Arrhenius plot, we can predict the glass transition temperature for each sample. By fitting the VTF model to the points of the Arrhenius plot, here we obtained some interesting results. The fitting parameter of VTF equation for the α-relaxation and the predicted glass transition temperature were listed in Table 4.
| Sample | log(f0) | B (K) | T0 (K) | Tg (K) | Tg (°C) | DSCTg (°C) | D |
|---|---|---|---|---|---|---|---|
| PU-2 | 9.3 | 324 | 207 | 218 | −55 | −57.8 | 1.6 |
| PU-5 | 9.4 | 360 | 208 | 220 | −53 | −51.9 | 1.7 |
| PU-8 | 8.6 | 185 | 217 | 224 | −49 | −48.4 | 0.9 |
The Vogel temperature (T0) and the predicted glass transition temperature is increasing with increasing soft segment molecular weight as does the Tg determined from calorimetric measurements. This mainly suggests that the effect of increasing degree of crystallinity dominates the behavior. Interestingly, f0 (frequency of lattice vibrations), B (apparent activation energy) and D (fragility), do not follow a systematic change with the soft segment molecular weight. The highest and lowest quantitative values of these parameters were obtained for PU-5 and PU-8, respectively. Values for PU-2 were in between the other two samples. It should be noted that there is an additional uncertainty in the analysis: a single α-relaxation was fitted to the data, although there some evidences about the existence of a slower and weaker contribution to the α-relaxation in polyurethanes, arising from soft segments in close proximity to hard segments.27 However, this is not the case in this system. Furthermore, the behavior of α-relaxation in PU-8 is rather interesting. As it can be seen in the Arrhenius plot (Fig. 9), it is basically similar to the one in PU-5 at low temperatures, and to the one in PU-2 at high temperatures.
On the other hand, differences in dielectric permittivity or conductivity of the phases lead to interfacial polarization, which can be described as the accumulation of space charges at the interfaces between the various phases, in heterogeneous materials like phase separated polymers. The accumulating charges behave like a dipole giving rise to the formation of a peak in the dielectric loss spectra, which is generally referred as Maxwell–Wagner–Sillars (MWS) polarization.7,12 More specifically, this interfacial polarization is originated from mobility and accumulation of charges at the interfaces of soft and hard domains of polyurethanes due to the differences between their respective dielectric constants and conductivities, which also affect the frequency and intensity of the MWS process.7 Therefore, the interfacial MWS polarization can be examined for a better understanding of micro-phase separation in polyurethanes.
As mentioned earlier, the dielectric analysis, particularly following the α-relaxation, was quite challenging in this system due to high conductivity of PEO. For this reason, we tried to apply a better approach to the system by comparing diagrams of different quantities obtained using different formalisms, such as the (ε′) and (ε′′), their ratio (tan![[thin space (1/6-em)]](https://www.rsc.org/images/entities/char_2009.gif) δ), the conductivity (σac), the imaginary part of the electric modulus (M′′) and the frequency derivative of (ε′). From these plots, it is possible to correlate different curves to various phenomena, such as interfacial Maxwell–Wagner–Sillars (MWS) polarization, conductivity relaxation, etc.40 The multi-plots of dielectric the losses (ε′′), the electric modulus (M′′) and the conductivity, (σac) for PU-2 and PU-5 are given in Fig. 10a and b, respectively. In the spectrum of electric modulus (M′′), the peak at low frequencies is related to a conductivity relaxation, i.e. the transition from conductivity DC (which is frequency independent) to conductivity AC (which increases linearly with frequency in a log–log plot). By comparing the spectra of electric modulus and conductivity, it should be noted that the peak of (M′′) is slightly higher than the “knee” of the conductivity.24
δ), the conductivity (σac), the imaginary part of the electric modulus (M′′) and the frequency derivative of (ε′). From these plots, it is possible to correlate different curves to various phenomena, such as interfacial Maxwell–Wagner–Sillars (MWS) polarization, conductivity relaxation, etc.40 The multi-plots of dielectric the losses (ε′′), the electric modulus (M′′) and the conductivity, (σac) for PU-2 and PU-5 are given in Fig. 10a and b, respectively. In the spectrum of electric modulus (M′′), the peak at low frequencies is related to a conductivity relaxation, i.e. the transition from conductivity DC (which is frequency independent) to conductivity AC (which increases linearly with frequency in a log–log plot). By comparing the spectra of electric modulus and conductivity, it should be noted that the peak of (M′′) is slightly higher than the “knee” of the conductivity.24
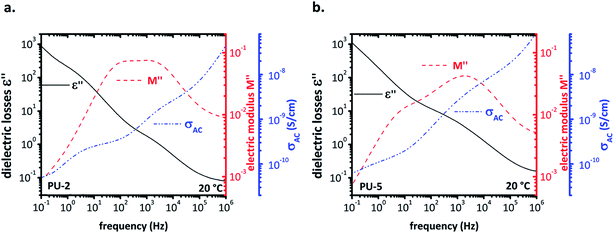 | ||
| Fig. 10 Multi-plots for (a) PU-2 and (b) PU-5 in order to compare the dielectric losses (ε′′), the electric modulus (M′′) and the conductivity (σac). | ||
For this system, at temperatures higher than −20 °C, interfacial MWS polarization dominates the spectrum of (ε′′). To provide a clear overview on the conductivity relaxation and interfacial MWS polarization, the Arrhenius plot was reconstructed by using the Havriliak–Negami model for the peaks of (M′′) for all three samples in Fig. 11.
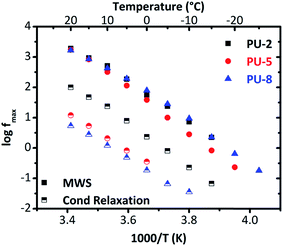 | ||
| Fig. 11 Arrhenius plot derived from the electric modulus diagrams for the MWS polarization and the conductivity relaxation. | ||
As can clearly be seen in Fig. 11, all the samples under investigation (PU-2, PU-5 and PU-8) display quite similar behaviors, and thus, similar activation energies in terms of interfacial MWS polarization. Although these results indicate that the microphase separation is not significantly affected by the soft segment molecular weight, it should be noted that no safe conclusions can be extracted here due to the complexity of the system and the presence of many phases with different conductivity. For this reason, the interfacial MWS polarization will not be further discussed.
On the other hand, significant differences were observed in the conductivity relaxation, which is much faster for PU-2 (Fig. 11). This is mainly related to the amorphous/crystalline nature of the samples. As the conductivity decreases with increasing crystallinity, which is due to the restrained mobility arisen from the presence of the crystalline regions, the conductivity relaxation is expected to be slower for the samples with high crystallinity values. Since PU-2 copolymer is mainly amorphous, there is no notable restriction on the mobility, particularly in comparison to other two crystalline materials under investigation (PU-5 and PU-8), its conductivity relaxation becomes faster than those of PU-5 and PU-8. Besides, the shape of the Arrhenius curves for the interfacial MWS polarization and conductivity relaxation is similar to each other (Fig. 11). Parallel traces of these two processes for each sample mainly imply similar activation energies. In addition, both of the processes, i.e., MWS polarization and conductivity relaxation, follow VTF behavior, which is typical for the conductivity relaxation above glass transition temperature, basically indicating cooperativity in the system.
4. Conclusions
The effect of soft segment molecular weight on the molecular mobility and segmental dynamics of a series of PEO-based polyurethaneurea copolymers with identical hard segment contents (30% by weight) were investigated using differential scanning calorimetry and dielectric relaxation spectroscopy. DSC analyses showed that PEO SS glass transition temperature increased with the soft segment molecular weight. This was supported by the results obtained from DRS analyses. Furthermore, as widely observed in polyurethanes, these copolymers also display rich dielectric relaxation behavior, where five different relaxations were observed in dielectric analyses of all copolymers. These were local glassy state motions (γ and β), segmental motion of the soft phase (α), conductivity relaxation (CR) and interfacial Maxwell–Wagner–Sillars (MWS) polarization. Local relaxations follow Arrhenius behavior and their time scale is not affected by the soft segment molecular weight. Interestingly enough, the α-relaxation was not visible in the spectra of dielectric losses versus frequency, but became apparent after re-plotting the data into isochronal diagrams. It follows VTF behavior and interestingly is slower for the copolymer based on PEO-4600 (PU-5) when compared with those based on PEO-2000 (PU-2) and PEO-8000 (PU-8). The conductivity relaxation and the interfacial MWS polarization also follow VTF behavior and have quite similar slope basically indicating cooperativity and similar activation energies, respectively. Very interestingly, the interfacial MWS polarization is not affected by the soft segment molecular weight indicating that microphase separation is not significantly affected by the PEO molecular weight for this system, which is unexpected. Due to the highly complex structures of the samples having many phases with different conductivity, we should note that no safe conclusions can be extracted for the microphase separation in this system based on the interfacial MWS polarization. However, significant differences were observed in the conductivity relaxation, which is much faster for PU-2 copolymer when compared with PU-5 and PU-8. This is explained by an increase in the degree of crystallinity of the PEO matrix with an increase in the PEO molecular weight in these copolymers, as demonstrated by XRD and DSC studies.Conflicts of interest
The authors declare no conflict of interest.Acknowledgements
We gratefully acknowledge Scientific and Technical Research Council of Turkey (TUBITAK) for the use of materials which were synthesized within the content of the project funded under the contact number 109M073.References
- A. Noshay and J. E. McGrath, Block Copolymers: Overview and Critical Survey, Elsevier, 2013 Search PubMed.
- M. Szycher, Szycher's Handbook of Polyurethanes, Taylor & Francis, 1st edn, 1999 Search PubMed.
- P. Król, Prog. Mater. Sci., 2007, 52, 915–1015 CrossRef.
- I. Yilgör, E. Yilgör and G. L. Wilkes, Polymer, 2015, 58, A1–A36 CrossRef.
- A. M. Castagna, D. Fragiadakis, H. Lee, T. Choi and J. Runt, Macromolecules, 2011, 44, 7831–7836 CrossRef CAS.
- A. M. Castagna, A. Pangon, T. Choi, G. P. Dillon and J. Runt, Macromolecules, 2012, 45, 8438–8444 CrossRef CAS.
- D. Fragiadakis and J. Runt, Macromolecules, 2013, 46, 4184–4190 CrossRef CAS.
- K. N. Raftopoulos, B. Janowski, L. Apekis, K. Pielichowski and P. Pissis, Eur. Polym. J., 2011, 47, 2120–2133 CrossRef CAS.
- K. N. Raftopoulos, S. Koutsoumpis, M. Jancia, J. P. Lewicki, K. Kyriakos, H. E. Mason, S. J. Harley, E. Hebda, C. M. Papadakis, K. Pielichowski and P. Pissis, Macromolecules, 2015, 48, 1429–1441 CrossRef CAS.
- C. Schick, Eur. Phys. J.: Spec. Top., 2010, 189, 3–36 CrossRef CAS.
- B. Wunderlich, Thermal Analysis of Polymeric Materials, Springer, Berlin Heidelberg, 2005 Search PubMed.
- F. Kremer and A. Schönhals, Broadband Dielectric Spectroscopy, Springer, Berlin Heidelberg, 2002 Search PubMed.
- E. Akiyama, Y. Nagase, N. Koide and K. Araki, Phys. Chem. Chem. Phys., 1999, 1, 2319–2326 RSC.
- Y. W. Lian, K. S. Zhao and L. K. Yang, Phys. Chem. Chem. Phys., 2010, 12, 6732–6741 RSC.
- C. Colosi, M. Costantini, A. Barbetta, C. Cametti and M. Dentini, Phys. Chem. Chem. Phys., 2013, 15, 20153–20160 RSC.
- M. Sharma, G. Madras and S. Bose, Phys. Chem. Chem. Phys., 2014, 16, 23421–23430 RSC.
- J. Li and K. Zhao, Phys. Chem. Chem. Phys., 2015, 17, 4175–4183 RSC.
- T. Hirata, H. Matsuno, D. Kawaguchi, M. Inutsuka, T. Hirai, M. Tanaka and K. Tanaka, Phys. Chem. Chem. Phys., 2017, 19, 1389–1394 RSC.
- S. Kitajima, F. Bertasi, K. Vezzù, E. Negro, Y. Tominaga and V. Di Noto, Phys. Chem. Chem. Phys., 2013, 15, 16626–16633 RSC.
- A. Campanella, A. Brás, K. N. Raftopoulos, C. M. Papadakis, O. Vassiliadou, A. Kyritsis, M. S. Appavou, P. Müller-Buschbaum and H. Frielinghaus, Polymer, 2016, 96, 70–80 CrossRef CAS.
- A. G. Charnetskaya, G. Polizos, V. I. Shtompel, E. G. Privalko, Y. Y. Kercha and P. Pissis, Eur. Polym. J., 2003, 39, 2167–2174 CrossRef CAS.
- T. Choi, D. Fragiadakis, C. M. Roland and J. Runt, Macromolecules, 2012, 45, 3581–3589 CrossRef CAS.
- D. Fragiadakis, S. Dou, R. H. Colby and J. Runt, Macromolecules, 2008, 41, 5723–5728 CrossRef CAS.
- G. Georgoussis, A. Kanapitsas, P. Pissis, Y. V. Savelyev, V. Y. Veselov and E. G. Privalko, Eur. Polym. J., 2000, 36, 1113–1126 CrossRef.
- A. Kanapitsas and P. Pissis, Eur. Polym. J., 2000, 36, 1241–1250 CrossRef CAS.
- A. Kanapitsas, P. Pissis and A. Garcia Estrella, Eur. Polym. J., 1999, 35, 923–937 CrossRef CAS.
- K. N. Raftopoulos, B. Janowski, L. Apekis, P. Pissis and K. Pielichowski, Polymer, 2013, 54, 2745–2754 CrossRef CAS.
- K. N. Raftopoulos, C. Pandis, L. Apekis, P. Pissis, B. Janowski, K. Pielichowski and J. Jaczewska, Polymer, 2010, 51, 709–718 CrossRef CAS.
- K. Chrissopoulou, K. S. Andrikopoulos, S. Fotiadou, S. Bollas, C. Karageorgaki, D. Christofilos, G. A. Voyiatzis and S. H. Anastasiadis, Macromolecules, 2011, 44, 9710–9722 CrossRef CAS.
- A. C. French, A. L. Thompson and B. G. Davis, Angew. Chem., Int. Ed., 2009, 121, 1274–1278 CrossRef.
- S. A. Kim and L. A. Archer, Macromolecules, 2014, 47, 687–694 CrossRef CAS.
- H. Matsuura and K. Fukuhara, J. Polym. Sci., Part B: Polym. Phys., 1986, 24, 1383–1400 CrossRef CAS.
- J. Maxfield and I. W. Shepherd, Polymer, 1975, 16, 505–509 CrossRef CAS.
- W. Qiu, M. Pyda, E. Nowak-Pyda, A. Habenschuss and B. Wunderlich, Macromolecules, 2005, 38, 8454–8467 CrossRef CAS.
- T. Uemura, N. Yanai, S. Watanabe, H. Tanaka, R. Numaguchi, M. T. Miyahara, Y. Ohta, M. Nagaoka and S. Kitagawa, Nat. Commun., 2010, 1, 83 Search PubMed.
- O. Malay, O. Oguz, C. Kosak, E. Yilgor, I. Yilgor and Y. Z. Menceloglu, Polymer, 2013, 54, 5310–5320 CrossRef CAS.
- S. Havriliak and S. Negami, Polymer, 1967, 8, 161–210 CrossRef CAS.
- E. J. Donth, The Glass Transition: Relaxation Dynamics in Liquids and Disordered Materials, Springer, 2001 Search PubMed.
- P. Klonos, A. Panagopoulou, L. Bokobza, A. Kyritsis, V. Peoglos and P. Pissis, Polymer, 2010, 51, 5490–5499 CrossRef CAS.
- A. Kyritsis, G. Vikelis, P. Maroulas, P. Pissis, B. Milosheva, R. Kotsilkova, A. Toplijska, C. Silvestre and D. Duraccio, J. Appl. Polym. Sci., 2011, 121, 3613–3627 CrossRef CAS.
- O.-H. Kwon, V. Ortalan and A. H. Zewail, Proc. Natl. Acad. Sci. U. S. A., 2011, 108, 6026–6031 CrossRef CAS PubMed.
- F. E. Bailey and J. V. Koleske, Poly(ethylene oxide), Academic Press, 1976 Search PubMed.
- S. Koutsoumpis, K. N. Raftopoulos, M. Jancia, J. Pagacz, E. Hebda, C. M. Papadakis, K. Pielichowski and P. Pissis, Macromolecules, 2016, 49, 6507–6517 CrossRef CAS.
- J. van Turnhout and M. Wübbenhorst, J. Non-Cryst. Solids, 2002, 305, 50–58 CrossRef CAS.
- E. Neagu, P. Pissis, L. Apekis and J. G. Ribelles, J. Phys. D: Appl. Phys., 1997, 30, 1551 CrossRef CAS.
- S. Kripotou, P. Pissis, V. A. Bershtein, P. Sysel and R. Hobzova, Polymer, 2003, 44, 2781–2791 CrossRef CAS.
Footnote |
| † Currently at Quantag Nanotechnologies, Urla, Izmir, Turkey. |
| This journal is © The Royal Society of Chemistry 2017 |


