 Open Access Article
Creative Commons Attribution 3.0 Unported Licence
The economic and CO2 reduction benefits of a coal-to-olefins plant using a CO2-ECBM process and fuel substitution
Han Yu a,
Qingzhe Jiang*a,
Zhaozheng Songa,
Qian Maa,
Bo Yuanb and
Huanxi Xiongb
aState Key Laboratory of Heavy Oil Processing and Beijing, China University of Petroleum, Beijing 102249, P. R. China. E-mail: jiangqingzhe@163.com; Tel: +86 10 89733372
bResearch Institute of Safety & Environment Technology, China National Petroleum Corporation, Beijing 102206, China
First published on 26th October 2017
Abstract
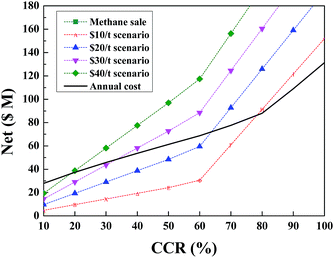
Taking advantage of coalbed methane as a substitute for coal fuel can facilitate CO2 reduction in addition to CO2 sequestration. Here, the CO2 reduction potential and economic impact of CO2 recovery of methane from a coalbed were evaluated at a CTO plant in the Inner Mongolia Autonomous Region of China. Emission reductions and capital, annual, and methane costs were analyzed basing on engineering data, empirical formulas, and assumptions. Cost analysis included the influence of a potential carbon tax. In addition, a sensitivity analysis was conducted on the annual gross profit to parameters, including carbon tax, CO2 capture rate (CCR), pipeline distance, capital recovery factor, CO2 injection rate, operation and maintenance (O&M) percentage, coal depth, and methane price. Results showed that an optimal CO2 capture rate is about 80%, taking into consideration total capital, annual, and methane costs. At this optimum CCR, the methane price was calculated as $0.12 Nm−3 and a total capital cost of $323.14 M, which also results in a 58% reduction in CO2 emissions. Reductions from CO2 sequestration and fuel substitution respectively account for 66% and 34% of the total emissions reductions. The carbon tax impact analysis suggests a carbon tax greater than $20 per tCO2 will maintain a profitable system with a range in CCR of 70–80%. The sensitivity analysis demonstrates that carbon tax, CCR, and pipeline distance have the greatest effects on annual gross profit.
1. Introduction
Olefin plays an important role in the petrochemical industry; therefore, its production capacity may in part reflect a nation's economic status. The world ethylene production capacity reached 153.5 Mt/a with a documented production of roughly 130.0 Mt/a in 2014.1 In China, the domestic supply of ethylene was 17.3 Mt/a in 2015; nevertheless, the demand was over 37.3 Mt/a with a big gap of 20 Mt/a;2 it is imperative that this gap be filled with olefins derived from alternative resources. The characteristics of China's energy structure are referred to as “rich in coal, low in oil, and poor in gas” (see Fig. 1), which makes coal to olefins (CTO) production the most clear choice for solving the olefin shortage problem.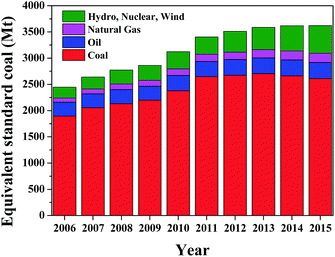 | ||
| Fig. 1 Profile of major energy production in China since 2006.3 | ||
The CTO process has clear advantages in product cost based on the low price of feedstock.4 However, CTO technology suffers from high CO2 emissions, which urgently needs to be addressed in the context of the international political environment. CO2 mitigation methods have primarily focused on fuel balance and switching, technology upgrades, and CO2 capture for sequestration or utilization.5–10 Among these, CO2 sequestration has been verified as an effective approach because it can reduce CO2 at a larger scale than other options. Carbon capture and storage (CCS), CO2 enhanced coalbed methane (CO2-ECBM), and CO2 enhanced oil recovery (CO2-EOR) are three major technologies which have received increasingly attention in recent years.
All the three processes have similar key sub-processes: (1) CO2 collection and pretreatment; (2) CO2 compression and transportation; and (3) geologic injection. The CO2 sources include industries related to generation of power, production of cement, iron and steel, and coal chemicals as well as chemical refineries.11 Different technologies for gas pretreatment have been adopted due to varying CO2 concentrations in the flue gas resulting in different corresponding carbon capture costs. For onshore CO2 transportation, pipeline and tanks are the two primary modes. Results demonstrate that for longer distances, pipeline transportation is relatively more cost-effective due to its larger CO2 loading capacity.12 With regard to the CO2 geologic injection procedure involved in the CO2-EOR and CO2-ECBM projects, it is much higher in complexity than the first two sub-processes. Tables 1 and 2 show the criteria for CO2-EOR and CO2-ECBM projects.13
| Criteria | Miscible | Immiscible |
|---|---|---|
| Capacity | >4 Mt | |
| Reservoir type | Sandstones and carbonates | |
| Rock wettability | Water wet of week oil wet | |
| Depth | >450 m | 600–900 |
| Thickness | <40 m | 10–20 m |
| Temperature | 60–121 °C | >35 |
| Pressure | > minimum miscibility and < fracture pressures | >7.5 MPa |
| Porosity | >3% | >3% |
| Permeability | >5 mD | >0.1 mD |
| Caprock thickness | >10 m | >10m |
| Oil density | <0.88 | >0.9 |
| Oil viscosity | <10 mPa s | 10–1000 |
| Oil saturation | >0.3 | 0.3–0.7 |
| Criteria | Suitable condition |
|---|---|
| Capacity | >1 Mt |
| Thickness | >10 m |
| Depth | 300–1500 m |
| Temperature | >35 °C |
| Pressure | >7.5 MPa |
| Porosity | >5% |
| Permeability | >1 mD |
| Caprock thickness | >10 m |
| Ash content | <25% |
| Methane content | 2.5–50 m3 t−1 |
| Coal rank | 0.6–1.5% |
As is evident, the CO2-EOR and CO2-ECBM processes as well as the economic performances are sensitive to parameters like oil density, oil viscosity, permeability, methane content, and well depth. According to Dahowski,14 the net costs pertaining to the large CO2 point sources in China range from less than −$60 to more than $200 per ton of CO2 stored. Sun et al.13 concluded that CO2-EOR could be considered the most favorable CCUS technology that deserves highest priority for development in the short and medium term. Kay Damen et al.15 made a comparison between the four CO2-EOR and CO2-ECBM projects. Results showed that the CO2 mitigation costs ranged between −3 to 19 €/t CO2 and 5 to 6 €/t CO2, respectively that ratified promising prospects for both the CO2 reduction methods.
Here, a notable point is that the methane gas generated from the CO2-ECBM process can become a source of revenue as feedstock or fuel, with minimal processing; this gives the process a comparative advantage over the CO2-EOR process and other CCS processes.
The CO2-ECBM process has been studied extensively. A feasibility study on ECBM recovery and CO2 storage was conducted in Southeast Qinshui Basin, China by Zhou et al.16 Wong et al.17 evaluated the conceptual economic performance of a full-scale CO2-ECBM project and concluded that it showed promising prospects for deployment. A laboratory and simulation investigation of ECBM recovery by CO2 injection was conducted by Fulton et al.18 that demonstrated an increase in the gas recovery efficiency from 36% to 132% with an increase in CO2 pressure from 0.34 to 1.41 MPa. An experimental study conducted by Philipp Weniger et al.19 revealed that the CO2 sorption capacities exceeded the methane sorption capacities by a factor of 1.9–6.9 for the coal samples extracted from the Paraná Basin, Brazil. A.S. Ranathunga,20 in his study, concluded that compared to natural recovery, CO2 flooding can significantly increase the CH4 production from low-rank coal seams. However, most of the related researches are on an experimental level. The few field level studies that have been conducted related to CO2-ECBM processes are presented in Table 3; they reveal that the impact of CO2 injection on CH4 recovery is definitely positive at the field level, although it may vary according to operating conditions and geological settings. A broad body of literature is also available on ECBM theory and mechanisms in detail.21–24 Most scholars have focused more on coalbed methane production and have only evaluated the CO2 reduction potential from the perspective of CO2 sequestration; very few studies have evaluated the benefits of the produced methane.25,26
| Scale | Location | Key findings | Ref. |
|---|---|---|---|
| Field test | San Juan Basin, USA | Gas recovery was enhanced from 77–95% by CO2 injection | Reeves27 |
| Field test | Upper Silesian Basin, Poland | 55–70% increase of gas production | Bergen28 |
| Micro-piolet test | Ishikari Coal Basin, Japan | Methane production was enhanced by 2–3 times | Fujioka29 |
| Micro-piolet test | Qinshui Basin, China | Methane production was enhanced by 2.5–15 times | Wong10 |
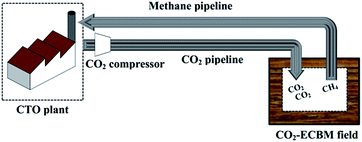
In this study, a system consisting of CO2 capture and compression, CO2 pipeline transport, CO2-ECBM processing, and methane pipeline transport was constructed (see Fig. 2). Taking advantage of the produced methane to displace coal fuel in the CTO plant boilers have the potential for additional CO2 reduction because methane is much cleaner than fuel coal. A particular CTO plant in China was selected as the study site and the adjacent Ordos Basin was chosen for the CO2-ECBM field option. CO2 resources for ECBM processing were derived from the CTO plant emissions. The produced methane was sent back to substitute for the fuel coal in the CTO plant boilers, which offered a novel low carbon option for the CTO plant. The CO2 reduction potential and corresponding economic performance were evaluated.
2. Methodology
2.1 Overview
In this study, CO2 from a Rectisol® unit was transported to the CBM field and injected into the coalbed, which produced methane. The methane was sent back to the CTO plant to replace the fuel coal in the boilers. Thus, CO2 emission reductions were derived from both CO2 sequestration and switching fuels.A CTO plant in Baotou City, Inner Mongolia Autonomous Region of China was selected as study site. The plant was put into production in 2011 with an olefin capacity of 0.7 Mt/a, which made it the first and largest CTO commercial scale facility.30 According to the literature,31 the total emission of the CTO plant was near 6 Mt CO2/a. Table 4 shows the CO2 emission sources as percentages of total emissions. The Rectisol unit accounted for the most emissions, 60.1% of the total, with a CO2 concentration of 88.1%. Boiler flue gas accounted for 36.4% of total emissions, but the CO2 concentration was as low as 6.0%. Because the two sources accounted for 96.5% of total emissions, they were the main focus of CO2 reduction. CO2 flue gas emissions from the MTO regenerator, sulfur recovery, and steam superheater accounted for the remaining 3.5%.
| CO2 sources | Value (Mt/a) | CO2 concentration (%) | Portion (%) |
|---|---|---|---|
| Rectisol unit | 3.60 | 88.1 | 60.1 |
| MTO regenerator flue gas | 0.11 | 21.0 | 2.0 |
| Sulfur recovery flue gas | 0.06 | 28.1 | 1.0 |
| Steam superheater flue gas | 0.03 | 9.5 | 0.5 |
| Boiler flue gas | 2.18 | 6.0 | 36.4 |
| Total | 5.98 | 100.0 |
The treated CO2 was sent to the gas field in the Ordos Basin through a pipeline. With an area of 25 × 104 km2, the Ordos Basin is the second largest sedimentary basin in China;32 it is a few hundred kilometers south of Baotou City (see Fig. 3). The basin has the largest proven reserves of natural gas with >500 × 109 m3 in newly confirmed annual reserves.33,34 Six gas fields, Jingbian, Daniudi, Shenmu, Sulige, Zizhou, and Yulin, with >1000 × 108 m3 of proven reserves have been found in the basin to date.35 Table 5 presents basic information on the main gas fields in the Ordos Basin;36,37 it can be noted that most of the fields possess low permeability and high averaged coal layer thickness, indicating that perfect gas sealing conditions are possible. In this study, no specific gas field was identified so the CO2 transport distance varied. The produced methane was transported back to the CTO plant by pipeline.
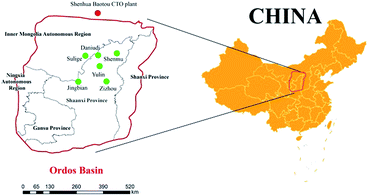 | ||
| Fig. 3 Location of the CTO plant in Baotou City, Inner Mongolia Autonomous Region of China, and the CO2-ECBM field in the Ordos Basin. | ||
| Gas fields | Porosity (%) | Permeability (mD) | Thickness (m) | Gas saturation (%) |
|---|---|---|---|---|
| Jingbian | 4.5–7.4 | 0.6–5.5 | 3.1–8.1 | 77% |
| Daniudi | 6.0–10.6 | 0.4–1.0 | 5.3–14.8 | 22% |
| Shenmu | 7.5–7.8 | 0.6–2.5 | 5.8–8.8 | 33% |
| Sulige | 7.0–11.0 | 0.5–1.0 | 4.9–11.5 | 22% |
| Zizhou | 5.8–8.5 | 0.7–1.3 | 6.6–9.0 | 67% |
| Yulin | 6.0–6.6 | 1.8–8.2 | 6.5–10.8 | 35% |
Before the economic analysis, a preliminary safety evaluation needs to be performed. Adaptive capacity performance as per the operating conditions differs significantly from one gas field to another due to the differences in geological settings. The main safety risks comprise leakage, pipeline corrosion, and reservoir fracture; the first two risks can be managed effectively through monitoring and maintenance.
However, the third risk, i.e., reservoir fracture, is relatively more complex to manage. It is related to geological characteristics and operating pressure. We use Daniudi gas field as an example. Its caprock is a set of 180–300 m thick lacustrine clastic mudstones with a single layer of thickness up to 30–50 m. The minimum values of porosity and permeability are 6.0% and 0.4 mD, respectively, indicating that the reservoirs have good sealing efficiency and a stable regional distribution. The overpressure was estimated to be as high as 20–25 MPa; much higher than the general CO2-ECBM operating pressure.38,39 As is shown in Table 5, most of the gas fields in the Ordos Basin have similar characteristics of low porosity, permeability and likewise. This fact indicates that the preliminary safety requirements for a CO2-ECBM process in the Ordos Basin are met. However, there is a need of a detailed empirical investigation, along with a process simulation, and pilot test specific to the gas reservoir before an actual CO2-ECBM process is undertaken.
2.2 CO2 reduction
Total CO2 reduction consisted of two processes, direct CO2 sequestration in coalbeds and indirect CO2 reduction from fuel switching.Throughout the process, net CO2 sequestration underperforms the theoretical calculations. This difference is due to CO2 losses in the capturing and purifying process, leakages in pipelines, and parasitic CO2 produced from energy use. Therefore, the net CO2 sequestered in coalbed was set at 79% of the total CO2 based on calculations by Wong.17
The amount of CO2 reduction from fuel switching was calculated on the basis of low heat value and carbon content per GJ. The low heat value and carbon content for coal fuel are 14.08 GJ t−1 and 28.00 × 10⁻³ t C/GJ, respectively. The low heat value and carbon content for the produced methane are 389.31 GJ/104 Nm3 and 15.30 × 10⁻³ t C/GJ, respectively.3,40
2.3 Economic evaluation methodology
The economic evaluation for CO2-ECBM was based on four aspects, total capital cost, annual cost, methane cost, and annual gross profit.• CO2 capture and compression. CO2 from the Rectisol unit needs to be processed using the existing absorption tower and flashing evaporator to concentrate the CO2 from 88.1% to >98.5%. The CO2 capture rate will vary from 10% to 100% by switching the operating pressure and temperature. Therefore, the capital cost includes compressors and pumps.
These costs were estimated based on the method described by McCollum and Ogden.41 This approach adopts a combination of 5-stage compression plus pumping to increase the CO2 pressure from atmospheric pressure to 15.0 MPa for transportation. An additional parallel compressor train was needed, and the calculated compression power was more than 40![[thin space (1/6-em)]](https://www.rsc.org/images/entities/char_2009.gif) 000 kW due to the limits of the single compressor maximum power. The compression power calculating formulas for each stage are as follows:
000 kW due to the limits of the single compressor maximum power. The compression power calculating formulas for each stage are as follows:
 | (1) |
| Ws-total = (Ws)1 + (Ws)2 + (Ws)3 + (Ws)4 + (Ws)5 | (2) |
 | (3) |
Power needs for boosting the pressure of the dense phase CO2 to the final 15.0 MPa outlet pressure were estimated as follows:
 | (4) |
The capital cost of the compressor and pump was based on the following equations:42
| mtrain = (1000 × m)/(24 × 3600 × Ntrain) | (5) |
 | (6) |
| Cpump = [(1.11 × 10⁶) × (Wp/1000)] + 0.07 × 10⁶ | (7) |
• CO2 pipeline transport. The capital costs of CO2 pipelines have been estimated using several models, including linear cost model,43 flow rates model,41,44–46 pipeline weight model,12,47 and quadratic equations.48,49 In this case, we adopted a model based on the flow rates and pipeline length:46
I = 77![[thin space (1/6-em)]](https://www.rsc.org/images/entities/char_2009.gif) 854 × m0.4055 × L + 595 854 × m0.4055 × L + 595![[thin space (1/6-em)]](https://www.rsc.org/images/entities/char_2009.gif) 704 704
| (8) |
• CO2 enhanced coalbed methane process. For this part, the capital costs included the investment for CO2 injecting wells, methane production wells, and field infrastructure. The number of injection wells was the key factor in capital cost, which depends heavily on the CO2 injection rate. According to field geologic parameters, Dahowski set the injection rates for most of China's hypothetical CO2-ECBM fields. In his work, the annual injection rate in the Ordos Basin was evaluated as 200
![[thin space (1/6-em)]](https://www.rsc.org/images/entities/char_2009.gif) 000 tCO2 per well.46 However, data from the very few CO2-ECBM projects indicate that the documented on-site injection rate was much less than the calculated values.10,16,17 Thus, the annual injection rate of 14
000 tCO2 per well.46 However, data from the very few CO2-ECBM projects indicate that the documented on-site injection rate was much less than the calculated values.10,16,17 Thus, the annual injection rate of 14![[thin space (1/6-em)]](https://www.rsc.org/images/entities/char_2009.gif) 000 tCO2 per well was applied in this study, based on the results of the only large-scale CO2-ECBM project to date, in the San Juan Basin of New Mexico, USA.50 The injection-to-production well ratio was set as 1
000 tCO2 per well was applied in this study, based on the results of the only large-scale CO2-ECBM project to date, in the San Juan Basin of New Mexico, USA.50 The injection-to-production well ratio was set as 1![[thin space (1/6-em)]](https://www.rsc.org/images/entities/char_2009.gif) :
:![[thin space (1/6-em)]](https://www.rsc.org/images/entities/char_2009.gif) 1.22, referring to a full-scale conceptual CO2-ECBM project in Qinshui Basin, Shanxi Province, China.17 Capital costs were estimated for wells and infrastructure as follows:51,52
1.22, referring to a full-scale conceptual CO2-ECBM project in Qinshui Basin, Shanxi Province, China.17 Capital costs were estimated for wells and infrastructure as follows:51,52
Cwell = 1![[thin space (1/6-em)]](https://www.rsc.org/images/entities/char_2009.gif) 000 000![[thin space (1/6-em)]](https://www.rsc.org/images/entities/char_2009.gif) 000 × 0.127e0.0008z + 530.7 000 × 0.127e0.0008z + 530.7
| (9) |
 | (10) |
• Methane transport. Currently, Pipeline transport of Natural Gas (PNG) is a booming market in China. Because the technology is mature, researchers have rich experience in estimating capital cost. In this study, the capital cost of constructing a natural gas pipeline was calculated on the basis of 2 × 10⁶ RMB km−1.53
| Cannual = Ctotal capital × CRF + CO&M + Cenergy | (11) |
| Cmethane = Cannual/Pmethane | (12) |
2.4 Basic assumptions
The purpose of the economic calculations was to determine the economic feasibility and appeal of the project with the adopted parameters. Some assumptions were required due to the lack of documented variables, which are described as follows.The CTO plant and CO2-ECBM process were assumed to operate 8000 hours annually. The pipeline length for CO2 and methane were set to 200 km for the base case.
No boosters were considered for CO2 and methane pipeline transport. For CO2 transport, the pressure drops may be fairly small for short distance transportation. For methane transport, the methane can be delivered back to the CTO plant by taking advantage of the high pressure during methane production.
We also assumed that every 1 molecule of methane production requires 2 molecules of CO2 injection, and no breakthrough will occur for the lifetime of the CO2-ECBM process.
All costs are expressed in U.S. dollars and converted to 2015 dollars by using the Chemical Engineering Plant Cost Index without taking tax into account.60 The exchange rate between US dollars and RMB was set to 6.39 according to the average exchange rate of 2015.61
3. Results and discussion
3.1 CO2 reduction
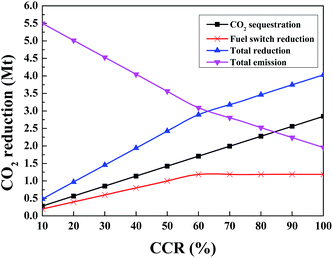
As indicated previously, CO2 reduction was achieved using both CO2 sequestration and switching fuels. Furthermore, CO2 reduction from the sequestration process was set to 79% of the initially calculated value.As shown in Fig. 4, the CO2 sequestration curve is linear because CO2 reduction was calculated based on a fix percentage. The reduction from switching fuels continues to increase until the CCR reaches 59.4%, subsequently, no further reductions from switching fuels occurs, which causes a slight decrease in the total reduction trend. At a CCR of 59.4%, the fuel coal used for CTO plant boilers has been totally substituted with coalbed methane. Nonetheless, it is evident that the total emission reduces significantly as the CCR increases. For example, the total emission drops from 5.98 Mt/a to 2.52 Mt/a when CCR is 80%, which represents a 58% CO2 reduction in emissions, of which 34% is contributed from switching fuels.
3.2 Economic performance
![[thin space (1/6-em)]](https://www.rsc.org/images/entities/char_2009.gif) 000 kW, so a parallel compressor will be needed, which causes an obvious increase in CO2 compression capital costs.
000 kW, so a parallel compressor will be needed, which causes an obvious increase in CO2 compression capital costs.
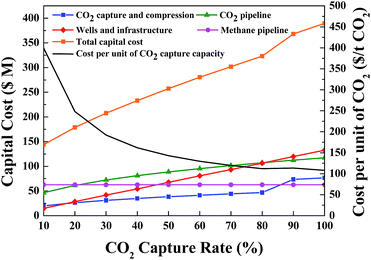 | ||
| Fig. 5 Variations in total capital and constituent costs and costs normalized to capture capacity with changing CCR. | ||
The capital cost per unit of CO2 capture capacity was selected as the economic index. As shown in Fig. 5, capital costs per unit of CO2 capture capacity decreases dramatically when the CO2 capture rate increases from 10% to 80%; CCR greater than 80% shows no additional cost benefit. Therefore, from the perspective of capital cost, the capture rate should be set to 80%.
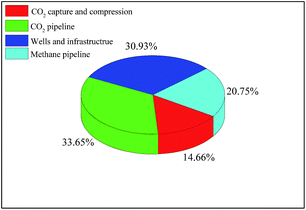
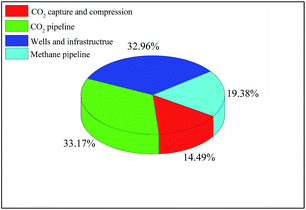
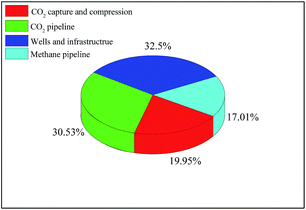
To gain a better insight into the impact of each constituent cost, a breakdown of capital cost items for the CCRs of 70%, 80%, and 90% are shown in Fig. 6–8; this highlights the variations around the threshold CCR of 80%. As shown, capital cost proportions for CCR 70% and 80% follow the same ranking: CO2 pipeline, wells and infrastructures, methane pipeline, and CO2 capture and compression in order of decreasing capital cost. For a CCR of 80%, the capital cost for CO2 pipeline accounts for 33.17% of the total cost, while wells and infrastructure capital cost account for 32.96%, and methane pipeline and CO2 compression account for 19.38% and 14.49%, respectively. However, for a CCR of 90%, the capital costs for wells and infrastructure are dominant, followed by CO2 pipeline, CO2 capture and compression, and methane pipeline.
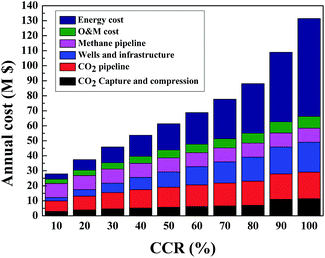
As Fig. 9 indicates, annual costs increase with increasing CCR, with an increase in annual cost rate at the CCR threshold of 80%. This observation reiterates that the optimal CCR ranges between 80% and 90%, which was found in the previous capital cost results. This range provides economically reasonable annual costs.
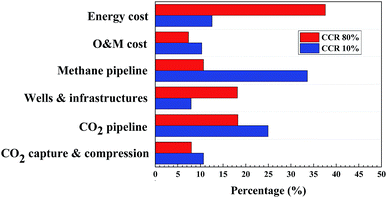
Energy and well and infrastructure costs show large changes in annual cost growth. The 10% and 80% CCRs were taken as examples to compare the proportional changes (see Fig. 10). As shown, annual costs from the methane pipeline accounts for the highest proportion (33.6%) at a CCR of 10%, followed by CO2 pipeline costs of 25.0% and energy costs of 12.6%. In comparison, at a CCR of 80%, energy costs account for the highest proportion of annual costs (37.6%), followed by CO2 pipeline costs of 18.3% and wells and infrastructure costs of 18.1%. Clearly, energy use becomes the dominant cost as CCR increases. In addition, the CO2 capture rate has relatively greater influence on annual cost than those from CO2 and methane pipelines, wells and infrastructures, O&M, and CO2 capture and compression.
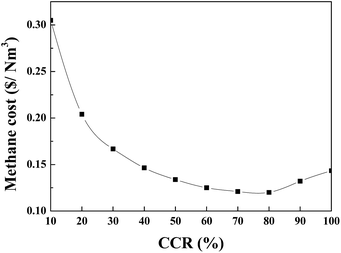
To obtain a better understanding of the economic performance, the cost per cubic meter ($ Nm−3) of methane was evaluated (see Fig. 11). Clearly, the unit volume cost drops conspicuously prior to CCR 60%, after which the downward trend flattens until the trend goes up for CCR greater than 80%. This indicates that the optimal CCR is between 70–80%, slightly different than the optimal value derived from annual costs. When the CCR was set as 80%, the cost for per cubic meter of methane was as low as $0.12 Nm−3. This is much cheaper than the current market price of Chinese methane, which is about $0.30 Nm−3.
3.3 Sensitivity analysis
A sensitivity analysis was conducted to evaluate the economic performances due to the uncertainties in some of the assumptions. The base case was set to make comparisons, and fluctuations in annual gross profit are due to changes in the main parameters (see Table 6). The annual gross profit for the base case was calculated as $19.75 M. The parameters investigated were carbon tax, CCR, pipeline distance, capital recovery factor, CO2 injection rate, O&M percentage, coal depth, and methane price. Results of the sensitivity analysis demonstrate the sensitivity of annual gross profit to parameter values (see Fig. 13).| Parameters | Base case | Adjusted values |
|---|---|---|
| Carbon tax ($ t−1 CO2) | 30 | 20, 40 |
| CCR (%) | 60 | 50, 70 |
| Distance (km) | 200 | 100, 300 |
| Capital recovery factor (%) | 15 | 12.5, 17.5 |
| Injection rate (t/a per well) | 14![[thin space (1/6-em)]](https://www.rsc.org/images/entities/char_2009.gif) 000 000 |
10![[thin space (1/6-em)]](https://www.rsc.org/images/entities/char_2009.gif) 000, 18 000, 18![[thin space (1/6-em)]](https://www.rsc.org/images/entities/char_2009.gif) 000 000 |
| O&M percentage (%) | 2.0 | 1.5, 2.5 |
| Coal depth (m) | 500 | 400, 600 |
| Methane price ($ m−3) | 0.30 | 0.25, 0.35 |
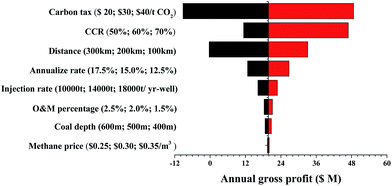 | ||
| Fig. 13 Sensitivity analysis of annual gross profit based on changing the values of the listed parameters. | ||
Fig. 13 indicates that the carbon tax, CCR, and distance are the three main factors that affect annual gross profit. It is most sensitive to carbon tax because this parameter is the main revenue stream. The annual gross profit from the case with a $40 t−1 CO2 carbon tax is nearly 2.5 times higher than the base case. Interestingly, the influence of the CCR increase is much larger than that of a CCR decrease even though the ranges are the same. This indicates that the CCR should be set higher than 60% to maintain profitability. Annualization and injection rates were less sensitive factors, which depend heavily on the lifetime of the equipment and technology, respectively. These two factors will be the main considerations for calculating the economic forecast. Finally, reasonable changes in O&M percentage, coal depth, and methane price do not significantly influence annual gross profit.
4. Conclusion
In this work, a CO2 reduction system using CO2-ECBM and extracted methane as an alternate fuel in a CTO plant was evaluated. The CO2 reduction potential and corresponding economic performance of the system was examined. A number of conclusions can be drawn from the results:• The power of one compressor will meet the compression demands for CCRs below 88.5%; above this threshold, another compressor will be needed, which will cause increase the capital costs significantly.
• The capital cost per unit of CO2 capture capacity decreases dramatically when the CO2 capture rate rises from 10% to 80%, then the trend stabilizes to a nearly constant value. This indicates that the optimal CCR to minimize capital cost is 80%.
• Total capital costs are dominated by cost for wells and infrastructures; for CCR above 50%, CO2 pipeline costs dominate the capital costs.
• An economical reasonable CCR range is proposed as 80–90% from an annual cost perspective.
• Energy costs grow most rapidly with increasing CCR, followed by costs for wells and infrastructure. The proportional constituent costs are ranked in the same order for all CCRs, even for those above 80%.
• An optimal CCR range of 70–80% was proposed based on methane cost.
• A CCR of 59.4% is a critical point for this particular CTO plant because complete fuel switching from coal to methane occurs.
• A CCR of 80%, results in a 58% reduction in CO2 emissions; of this reduction, CO2 sequestration and switching fuels account for roughly 66% and 34%, respectively.
• In the optimal CCR interval of 70–80%, a minimum carbon tax of $10 t−1 CO2 makes the project feasible; carbon taxes greater than $20 t−1 CO2 generates substantial profits.
• Carbon tax, CCR, and pipeline distance are significant when the annual gross profit was used as an index. The impacts of capital recovery factor and injection rate are relatively small.
Conflicts of interest
There are no conflicts to declare.Acknowledgements
Funding for this work was provided by the China National Petroleum Corporation (CNPC) under grant 016E-1209. We thank the CNPC Research Institute of Safety & Environment Technology and Shenhua Group Corporation for access to their database.Notes and references
- H. Zhou, Y. Qian and S. Yang, Appl. Energy, 2015, 156, 344–353 CrossRef CAS.
- Q. Zhang, S. Hu and D. Chen, J. Cleaner Prod., 2017, 165, 1351–1360 CrossRef CAS.
- National Bureau of Statistics, China energy statistics yearbook (in Chinese), China Stat. Press, Beijing, China, 2016 Search PubMed.
- D. Xiang, Y. Qian, Y. Man and S. Yang, Appl. Energy, 2014, 113, 639–647 CrossRef CAS.
- B.-Y. Yoo, Energy, 2017, 121, 772–780 CrossRef.
- A. I. Escudero, S. Espatolero, L. M. Romeo, Y. Lara, C. Paufique, A.-L. Lesort and M. Liszka, Appl. Therm. Eng., 2016, 103, 274–281 CrossRef CAS.
- C. C. Cormos, Int. J. Hydrogen Energy, 2014, 39, 13–27 CrossRef CAS.
- B. S. Koelbl, M. A. van den Broek, B. J. van Ruijven, A. P. C. Faaij and D. P. van Vuuren, Int. J. Greenhouse Gas Control, 2014, 27, 81–102 CrossRef CAS.
- M. M. F. Hasan, R. C. Baliban, J. A. Elia and C. A. Floudas, Ind. Eng. Chem. Res., 2012, 51, 15642–15664 CrossRef CAS.
- S. Wong, D. Law, X. Deng, J. Robinson, B. Kadatz, W. D. Gunter, Y. Jianping, F. Sanli and F. Zhiqiang, Int. J. Greenhouse Gas Control, 2007, 1, 215–222 CrossRef CAS.
- Technology Roadmaps Carbon Capture and Storage in Industrial Applications, http://www.iea.org/publications/freepublications/publication/ccs_industry.pdf.
- L. Gao, M. Fang, H. Li and J. Hetland, Energy Procedia, 2011, 4, 5974–5981 CrossRef.
- L. Sun, H. Dou, Z. Li, Y. Hu and X. Hao, J. Energy Inst., 2017 DOI:10.1016/j.joei.2017.08.002.
- R. T. Dahowski, C. L. Davidson, X. C. Li and N. Wei, Int. J. Greenhouse Gas Control, 2012, 11, 73–85 CrossRef.
- K. Damen, A. Faaij, F. van Bergen, J. Gale and E. Lysen, Energy, 2005, 30, 1931–1952 CrossRef CAS.
- F. Zhou, W. Hou, G. Allinson, J. Wu, J. Wang and Y. Cinar, Int. J. Greenhouse Gas Control, 2013, 19, 26–40 CrossRef CAS.
- S. Wong, D. Macdonald, S. Andrei, W. D. Gunter, X. Deng, D. Law, J. Ye, S. Feng, Z. Fan and P. Ho, Int. J. Coal Geol., 2010, 82, 280–286 CrossRef CAS.
- P. F. Fulton, C. A. Parente, B. A. Rogers, N. Shah and A. A. Reznik, A Laboratory Investigation Of Enhanced Recovery Of Methane From Coal By Carbon Dioxide Injection, SPE-8930-MS, SPE Unconventional Gas Recovery Symposium, Society of Petroleum Engineers, Pittsburgh, Pennsylvania, 18–21 May 1980 Search PubMed.
- P. Weniger, W. Kalkreuth, A. Busch and B. M. Krooss, Int. J. Coal Geol., 2010, 84, 190–205 CrossRef CAS.
- A. S. Ranathunga, M. S. A. Perera, P. G. Ranjith and C. H. Wei, Fuel, 2017, 189, 391–399 CrossRef CAS.
- F. B. Gorucu, S. A. Jikich, G. S. Bromhal, W. N. Sams, T. Ertekin and D. H. Smith, SPE Reservoir Eval. Eng., 2007, 10(4), 382–392 CrossRef CAS.
- G. Yin, B. Deng, M. Li, D. Zhang, W. Wang, W. Li and D. Shang, Fuel, 2017, 196, 288–297 CrossRef CAS.
- X. Sun, Y. Zhang, K. Li and Z. Gai, Fuel, 2016, 183, 478–488 CrossRef CAS.
- H. Wang, Q. Ran, X. Liao, X. Zhao, M. Xu and P. Fang, J. Nat. Gas Sci. Eng., 2016, 33, 678–686 CrossRef CAS.
- N. Mallick and V. Prabu, J. CO2 Util., 2017, 19, 16–27 CrossRef CAS.
- V. Sarhosis, A. A. Jaya and H. R. Thomas, Energy, 2016, 107, 580–594 CrossRef.
- S. Reeves and A. Oudinot, The Allison Unit CO2-ECBM Pilot – A Reservoir and Economic Analysis, Advanced Resources International, Inc, 2005, http://www.adv-res.com/Coal-Seq_Consortium/ECBM_Sequestration_Knowledge_Base/CBM%20Symposium%202005/0522.pdf Search PubMed.
- F. van Bergen, H. Pagnier and P. Krzystolik, Field experiment of CO2-ECBM in the Upper Silesian Basin of Poland, http://www.adv-res.com/Coal-Seq_Consortium/ECBM_Sequestration_Knowledge_Base/GHGT-8%202006/02_05_04.pdf Search PubMed.
- M. Fujioka, S. Yamaguchi and M. Nako, Int. J. Coal Geol., 2010, 82, 287–298 CrossRef CAS.
- X. Ling, Bull. Chin. Acad. Sci., 2011, 25, 128–130 Search PubMed.
- X. Wu, Process and Engineering of Coal to Light Olefins, Chemical Industry Press, Beijing, China, 2014 Search PubMed.
- S. Huang, X. Fang, D. Liu, C. Fang and T. Huang, Int. J. Coal Geol., 2015, 152, 132–143 CrossRef CAS.
- M. Jingkui, H. Kun, T. Shizhen, Y. Chun and S. Mengmeng, J. Geochem. Explor., 2016, 171, 133–140 CrossRef CAS.
- X. Wei, H. Chen, D. Zhang, R. Dai, Y. Guo, J. Chen, J. Ren, N. Liu, S. Luo and J. Zhao, Pet. Explor. Dev., 2017, 44, 347–357 CrossRef.
- H. Yang and X. Liu, Pet. Explor. Dev., 2014, 41, 144–152 CrossRef.
- J. Zhang, C. Yu, S. Huang, D. Gong, W. Wu, C. Fang and D. Liu, Pet. Explor. Dev., 2014, 1–13 Search PubMed.
- G. Wei, J. Li, Z. Xie, W. Yang, D. Wang and Z. Zhao, Acta Pet. Sin., 2013, 1–13 CAS.
- Q. Liu, Z. Jin, Q. Meng, X. Wu and H. Jia, J. Asian Earth Sci., 2015, 107, 1–11 CrossRef.
- Z. Yang, S. He, C. Zou, Q. Li and Z. Chen, Acta Pet. Sin., 2010, 31, 373–378 CAS.
- IPCC 2006, 2006 IPCC Guidelines for National Greenhouse Gas Inventories, Prepared by the National Greenhouse Gas Inventories Programme, ed. H. S. Eggleston, L. Buendia, T. Ngara and K. Tanabe, IGES, Japan, 2006 Search PubMed.
- D. L. McCollum and J. M. Ogden, Techno-economic models for carbon dioxide compression, transport, and storage and correlations for estimating carbon dioxide density and viscosity, Report UCD-ITS-RR-06–14, Institute of transportation studies, University of California, Davis, CA, 2006 Search PubMed.
- C. Hendriks, W. Graus and F. v. Bergen, Global carbon dioxide storage potential and costs, Report EEP-02001, Ecofys & TNO-NITG, 2004 Search PubMed.
- M. van den Broek, E. Brederode, A. Ramírez, L. Kramers, M. van der Kuip, T. Wildenborg, W. Turkenburg and A. Faaij, Environ. Model. Software, 2010, 25, 1754–1768 CrossRef.
- M. K. Chandel, L. F. Pratson and E. Williams, Energy Convers. Manage., 2010, 51, 2825–2834 CrossRef CAS.
- J. Serpa, J. Morbee and E. Tzimas, Technical and Economic Characteristics of a CO2 Transmission Pipeline Infrastructure, Report JRC62502, European Commission Joint Research Centre Institute for Energy, Netherlands, 2011 Search PubMed.
- R. T. Dahowski, X. Li, C. L. Davidson, N. Wei and J. Dooley, Regional opportunities for carbon dioxide capture and storage in China. A comprehensive CO2 storage cost curve and analysis of the potential for large scale carbon dioxide capture and storage in the People's Republic of China, Report PNNL-19091, Prepared for the U.S. Department of Energy, Richland, Washington, DC, 2009 Search PubMed.
- K. Piessens, B. Laenen, W. Nijs and J. M. Baele, Policy support system for carbon capture and storage, Report SD/CP/04A, Royal Belgian Institute of Natural Science, Belgian, 2008 Search PubMed.
- N. Parker, Using natural gas transmission pipeline costs to estimate hydrogen pipeline costs, Report UCD-ITS-RR-04–35, Institute of transportation studies, University of California, Davis, CA, 2004 Search PubMed.
- Pipeline transmission of CO2 and energy, Report PH4/6, International Energy Agency, GreenHouse Gas R&D Programme, 2002 Search PubMed.
- S. Reeves, A. Taillefert and L. Pekot, The Allison Unit CO2 – ECBM Pilot: A Reservoir Modeling Study, U.S. Department of Energy & Advanced Resources International, Houston, TX, 2003 Search PubMed.
- M. Z. Lukawski, B. J. Anderson, C. Augustine, L. E. Capuano Jr, K. F. Beckers, B. Livesay and J. W. Tester, J. Pet. Sci. Eng., 2014, 118, 1–14 CrossRef CAS.
- C. Augustine, J. W. Tester and B. J. Anderson, A Comparison of Geothermal with Oil and Gas Well Drilling Costs, Report SGP-TR-179, Stanford University, California, USA, 2006 Search PubMed.
- P. Gao, Z. Tan, G. Liu and P. Wang, International Petroleum Economics, 2017, 25, 26–33 Search PubMed.
- ElementEnergy, CO2 pipeline Infrastructure: An analysis of global challenges and opportunities, International Energy Agency Greenhouse Gas Programme, 2010 Search PubMed.
- B. Bock, R. Rhudy, H. Herzog, M. Klett, J. Davison, D. G. De La Torre Ugarte and D. Simbeck, Economic evaluation of CO2 storage and sink enhancement options, Report DE-FC26–00NT40937, TVA Public Power Institute, 2003 Search PubMed.
- S. T. McCoy and E. S. Rubin, Int. J. Greenhouse Gas Control, 2008, 2, 219–229 CrossRef CAS.
- M. Yan, L. Lian and Z. Wang, Natural Gas Distribution Engineering, China Construction Industry Press, 2005 Search PubMed.
- D. Xiang, S. Yang, X. Liu, Z. Mai and Y. Qian, Chem. Eng. J., 2014, 240, 45–54 CrossRef CAS.
- http://gas.in-en.com/html/gas-2573671.shtml.
- CEPCI, Chemical Engineering Plant Cost Index (CEPCI), https://zh.scribd.com/doc/310334114/CEPCI-February-2016-pdf.
- List of Exchange Rate Quotation of Bank of China, http://srh.bankofchina.com/search/whpj/search.jsp.
| This journal is © The Royal Society of Chemistry 2017 |

