 Open Access Article
Carbon dot-silica composite nanoparticle: an excitation-independent fluorescence material with tunable fluorescence†
Yefei Tian *a,
Zhipeng Ranb and
Wuli Yang
 *b
*b
aSchool of Materials Science and Engineering, Institute of Polymer Materials, Chang'an University, Xi'an 710064, China. E-mail: yftian@chd.edu.cn
bState Key Laboratory of Molecular Engineering of Polymers, Department of Macromolecular Science, Fudan University, 220 Handan Road, Shanghai 200433, P. R. China. E-mail: wlyang@fudan.edu.cn
First published on 11th September 2017
Abstract
Based on the copolycondensation of tetraethoxysilane and glucose, a facile one-pot approach is explored in this paper to prepare composite nanoparticles of silica/carbon dots (SCDs) on a large scale. Glucose, the carbon source for the carbon dots (CDs), is pre-packaged by copolycondensation with tetraethoxysilane in silica nanoparticles. It is likely that this creative route can reversibly modulate the excitation-dependent behavior of CD fluorescence. Compared with the character of the blue emission belonging to the carbon dots (CDs), which are illuminated under a UV lamp, SCDs suspended in water show bright tunable fluorescence from green to yellow. Moreover, the excitation dependence of the photoluminescence (PL) of the CDs is unprecedentedly restricted with a limitation of the CDs' growth in the silica nanoparticles, and afterwards the excitation dependence of PL can be fully recovered by the removal of the silica. In the solid state, the SCDs remain strongly luminescent and show temperature-sensitive PL. These findings pave the way for mechanistic studies on the excitation dependent fluorescence and applications of CDs in bioimaging and phosphor powders.
Introduction
As an emerging fluorescent nanomaterial, carbon dots (CDs), possessing many appealing advantages such as low toxicity, excellent biocompatibility, bright fluorescence, tunable excitation and emission spectra, low photobleaching and easy surface modification, have attracted great attention due to their potential applications in the fields of bioimaging, optoelectronic devices, biosensors, theranostics and photocatalysis.1–10 Currently, there are lots of methods exploited to construct CDs, such as hydrothermal synthesis,11–14 microwave assisted technology,15 electrochemical synthesis,16 oxygen plasma treatment17 and ultrasonic method.18,19 Among these strategies, hydrothermal route has gradually become one of the most commonly used and effective methods owing to its low cost, convenient operation and abundance of the raw materials. A wide range of organic compounds can be served as carbon sources to make preparations, such as graphene sheets,17 fullerene,20 CCl4,21 glycerol,22 glucose,23 as well as citric acid.24No matter what methods or carbon sources are utilized, nearly all CDs are excitation-dependent in photoluminescence (PL), usually showing bright blue fluorescence under a 365 nm ultraviolet (UV) lamp. The blue luminescence induced by UV excitations does harm to living cells or bio-systems for most formerly reported applications in bioimaging, as well, it always suffers from strong interferences of blue emissions from impurities. Based on that, the PL of CDs shifts to longer wavelengths with increasing excitation wavelengths, though yellow or red fluorescent emission from CDs is likely to be obtained by using light with longer wavelengths serving as excitation source, as well, the significant attenuation of emission intensity is inevitable.2,25 Several valuable attempts have been made to tune the PL of CDs. It has been found by Hu et al.26 that a red-shift phenomenon exists in the PL of CDs by introducing epoxides or hydroxys on their surfaces. Lin et al.27 have produced CDs with blue, green and red emissions by a control of the quantum size and nitrogen-doping concentration of the CDs. Yang et al.28 have prepared a polymer–carbon nanodot with near-infrared emission and two-photon fluorescence from dopamine and o-phenylenediamine. Moreover, Xiong et al.29 have hydrothermally synthesized CDs from urea and separated them via silica column chromatography. Therefore, they have found that the elution fractions show only one peak in the excitation independent PL emission spectrum. Although CDs with adjustable PL have been obtained, the exact mechanisms of the bright and colourful PL depending on excitation wavelength remain to be elucidated.30 The current pressing problem we are confronting with is to explore a convenient approach to control the excitation-dependent behavior of CDs to tailor the maximum emission of CDs from blue to longer wavelengths.
Herein, we reported a one-pot approach to fabricate a new type of silica/CD (SCD) composite nanoparticles based on the condensation between environmental friendly tetraethoxysilane (TEOS) and glucose in the presence of 1,2-ethanediamine (EDA). This synthetic strategy is efficacious for large-scale and rapid synthesis of CDs-based fluorescent silica nanoparticles. The SCDs exhibit unique PL properties, covering a broad spectrum from green to yellow window, different from the blue fluorescence of traditional CDs. Interestingly, the PL wavelength of SCDs is independent of excitation. The excitation-dependence of PL for CDs is under restriction, which may be due to the confined growth of CDs in silica network. Further results demonstrate the excitation dependence of PL for CDs, which can be fully restored by removal of silica. This research offers new insights into the essence of excitation dependent fluorescence of CDs, the architecture of SCDs and their adjustable fluorescence properties. Tentative applications of SCDs regarded as temperature-sensitive phosphor powder and biomarkers for cell imaging have proved their extensive application prospects.
Results and discussion
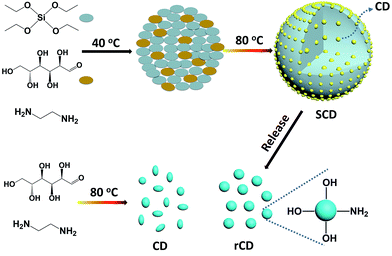
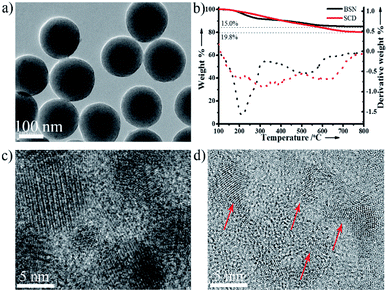
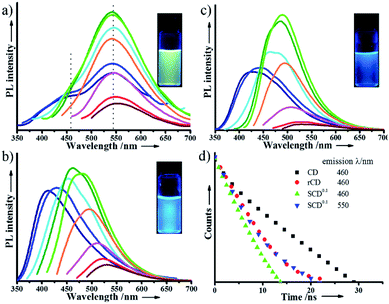
In regard to the fluorescent composite nanoparticles, SCDs were fabricated through condensation of TEOS and glucose in the presence of EDA (Scheme 1). In a typical procedure, there was an employment of the sol–gel process in a mixed solvent of ethanol and water, with TEOS serving as a silica precursor in the presence of glucose (TEOS/glucose: 1.5 mL/500 mg). The copolycondensation was preceded at 40 °C with the aid of EDA, aiming to form carbonous silica nanoparticles. And in situ growth of CDs confined by silica, it was initiated by directly increasing the reaction temperature from 40 °C to 80 °C without any separation or any further treatment. The mixture turns into milky yellow, indicating the self-condensation of glucose and the formation of SCDs (Fig. S1 in the ESI†). This one-pot synthetic strategy is proved to be efficacious for large-scale production of CDs-based fluorescent silica nanoparticles, e.g., the 2.5 g SCDs are readily achieved with a 250 mL reaction system in a flask.The obtained SCDs are so unique in PL emission that it can be tuned by sol–gel parameters and cover a broad spectrum from green to yellow window in a sharp contrast to the blue fluorescence of CDs that are well-known as earlier reported (Fig. 1). With CDs being confined in silica network, the excitation-dependence of PL for CDs is inhibited, however, it could be recovered by removal of silica. A series of SCDs, with emission peaks of 518 (SCD1.0), 534 (SCD0.25) and 550 nm (SCD0.1) respectively, were obtained by adjusting feeding amount of EDA from 1.0 or 0.25 to 0.1 mL. All SCDs give out bright luminescence, following which the PL maximum emission peak is able to be tuned when shifting from 550 to 518 nm through a simple increase of the amount of EDA. This phenomenon may be attributed to the change of surface oxidation of CDs when adding different amount of EDA.26,29 In addition to the maximum emission peak, the dual emissive mode of SCD0.1 in water clearly displays a small shoulder peak of 460 nm (the dash line in Fig. 1b). It will be discussed in detail later in this section and the emission intensity exhibits well stability within the pH ranging 3–9 (Fig. S2 in the ESI†). Possessing a narrow size distribution with an average diameter of 168 ± 8 nm, the SCDs exhibit a uniform spherical morphology (Fig. 2a). The hydrodynamic size of SCD0.1 is 265 nm, with a narrow size distribution determined by dynamic light scattering. The size of SCDs might be easily tuned from 100 to 230 nm after adjusting the amount of EDA or water (Fig. S3 and S4 in the ESI†). To get the copolycondensation verified, blank silica nanoparticles (BSNs) were prepared in the absence of glucose for comparison purpose, during which the regular spherical morphology (Fig. S5 in the ESI†) was exhibited. Thermogravimetric analysis of SCD0.1 shows a larger weight loss about 19.8% while the weight loss of BSNs of 15.0%. Besides, two additional weight loss peaks are observed in derivative thermogravimetric curve of SCD0.1, revealing that SCD0.1 contains more organic groups (Fig. 2b). In FTIR spectrum of SCD0.1, the new band at 1647 cm−1 is attributed to C![[double bond, length as m-dash]](https://www.rsc.org/images/entities/char_e001.gif) O vibrations with the peak centred at 3417 cm−1 being assigned to the bending vibrations of O–H bonds, which could be mainly extracted from glucose (Fig. S6 in the ESI†). The symmetrical stretching vibrations of Si–O–C shift from 1086 cm−1 of BSNs to 1079 cm−1 of SCD0.1, as a result of condensation between TEOS and glucose. The XRD pattern of SCD0.1 shows a stronger peak centered at 2θ = 23.4°, smaller than that of BSNs (Fig. S7 in the ESI†). All the above results demonstrated a successful incorporation of glucose in silica.
O vibrations with the peak centred at 3417 cm−1 being assigned to the bending vibrations of O–H bonds, which could be mainly extracted from glucose (Fig. S6 in the ESI†). The symmetrical stretching vibrations of Si–O–C shift from 1086 cm−1 of BSNs to 1079 cm−1 of SCD0.1, as a result of condensation between TEOS and glucose. The XRD pattern of SCD0.1 shows a stronger peak centered at 2θ = 23.4°, smaller than that of BSNs (Fig. S7 in the ESI†). All the above results demonstrated a successful incorporation of glucose in silica.
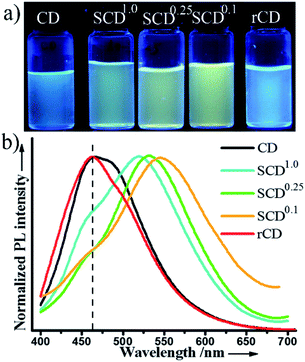 | ||
| Fig. 1 Luminescent CDs, SCDs, and rCDs suspended in water. (a) Digital photos under a 365 nm UV lamp. (b) Fluorescent spectra excited at 360 nm. | ||
To make a further study on the structure and the origin of fluorescence of SCDs, silica is etched by NaOH solution, and the released carbon dots (rCDs) with an average diameter of 8.6 nm are also in need (Fig. 2c and S8 in the ESI†). As a control, CDs are also prepared with same method but without TEOS, which shows an irregular morphology with an average diameter of 4.5 nm (Fig. 2d). High-resolution transmission electron microscopy (HRTEM) measurement reveals that rCDs are graphitic in nature with a lattice spacing of 0.250 nm consistent with (100) facet of graphite.3 Moreover, the same results were observed in CDs (Fig. S9 in the ESI†). However, much higher quantum yield of 0.13 at 400 nm are demonstrated in rCDs, compared with that of 5% for CDs (Fig. S10 in the ESI†). It may be attributed to the confined growth of graphitic crystals in silica, meaning that less nucleation occurs in limited space and more perfect crystals are formed. As evidence, rCDs exhibit larger size, narrower size distribution (Fig. S11 in the ESI†), nearer spherical morphology, and perfect crystalline structure (Fig. S12 in the ESI†).
As is well known, most luminescent CDs show blue fluorescence under a UV lamp, being characterized with an excitation-dependent PL behavior.31 We, therefore, investigate the fluorescent emission of SCD0.1, rCDs and CDs excited by different wavelengths. Although a big difference exists in size and crystallinity of CDs and rCDs, the PL spectra of them are close to each other and the excitation-dependent PL properties for rCDs are quite similar to those of CDs (Fig. 1, 3b and c). The maximum emission peaks of rCDs and CDs shift from 425 nm to 540 nm when excitation wavelengths are adjusted from 320 nm to 480 nm. And the maximum emission intensity decreases dramatically when wavelength is longer than 475 nm. Meanwhile, the fluorescent emission spectra of SCD0.1 at different excitation wavelengths are presented in Fig. 3a. SCD0.1 shows a broad excitation band resembling rCDs or CDs from 320 nm to 480 nm, whereas the maximum emission peaks are nearly fixed at 550 nm, which is almost independent on the change of excitation wavelengths. In addition, it can be found that the excitation spectrum for SCDs conforms with those of rCDs and CDs (Fig. S13 in the ESI†) well, as well, no emission is detected for BSNs. All these findings indicate that the observed bright luminescence of SCDs is certainly related to the incorporated CDs within the silica. This interesting and unique phenomenon demonstrates that silica decoration can lead to a flexible alteration of the usual excitation-dependent PL of CDs. To our knowledge, owing to an extensive study on the silica-coating methodology for quantum dots or dyes, it has been proved for many times that the silica shell from the sol–gel process has just little effect on PL properties of embedded fluorophores, and it is rarely reported that the function of silica can take effect in modulation of PL properties of the fluorophores.32,33
For the PL of CDs is ascribed to the presence of surface energy traps becoming emissive upon stabilization as a result of the surface passivation by EDA,2,34 the surface state of CDs has a great effect on optical properties.35 As-prepared CDs or rCDs show a strong absorption band at UV and near-UV range, but without any obvious absorption above 450 nm (Fig. S14 in the ESI†). The absorption of BSNs gradually decreases while extends from UV to NIR range. However, the composite SCDs show a powerful absorption ranging from 400 to 1000 nm, which is far greater than the stack of BSNs and CDs. One can conclude that there is a newly formed energy band in SCDs, which differs from CDs and BSNs. The Si–O–C linkage at the surface of carbon dots, known to be required components to induce PL of carbon-doped silica materials, is responsible for the increased absorption.36,37 Silica nanoparticles, which has been prepared with much less glucose (TEOS/glucose: 1.5 mL/50 mg), also show faint yellow under daylight, when emitting bright fluorescence (Fig. S15 in the ESI†). Therefore, glucose is a required component to produce the chromophore and silica backbone, such as auxochrome, significantly affecting both intensity and wavelength of the fluorescence. What needs further attention is the excitation-independent behavior of CDs derived from saccharides. In addition, it has been found that the fluorescence doesn't be shifted to wavelengths longer than 550 nm with progressively longer excitation wavelengths and that the intensity of the emission peaks close to 550 nm decrease abruptly (Fig. S16 in the ESI†).23 The limitation agrees well with the emission wavelength of SCDs, which are not obtained with emission longer than 550 nm. It can be understood in terms of restriction of silica framework inducing emission at 550 nm in order to become the strongest one.
To get a further elucidation of the mechanism of the excitation-dependence PL, time-resolved PL study is carried out to trace the change of PL in time scale (Fig. 3d). Lifetime of SCDs0.1 (2.77 ns) that measured at 460 nm is far less than that of CDs (6.11 ns), which may be due to the emergence of new energy gaps in SCDs.38 Then, the entrapped CDs are released from silica, following which the lifetime of rCDs obtained at 460 nm increases a little (3.57 ns), which however, is still close to the lifetime of SCD0.1 analysed at 550 nm (3.42 nm). It is illustrated in the results that the silica encapsulation does elicit the change of the surface energy traps of CDs, and the surface passivation from the multiple Si–O–C linkages ascertain the stable fluorescence emission of the incorporated CDs, with responsibility for the noticeable excitation-independence PL for SCDs.
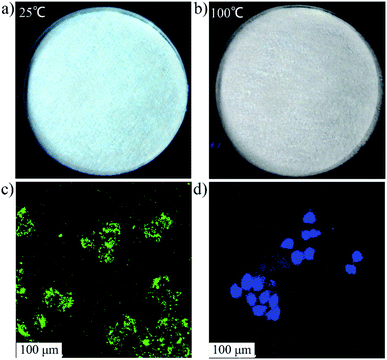
Then, we have demonstrated the potential applications of SCDs for the temperature-sensitive phosphor powder and bioimaging. In terms of SCDs, they not only emit the bright fluorescence in aqueous solution, but also are strongly luminescent in a solid state at room temperature owing to the homogeneous distribution of CDs rather than aggregation within the SCDs. It is found that their character of fluorescence disappears as the temperature goes up to 100 °C (Fig. 4a, b and S17 in the ESI†) and a cooling operation can make it recovered. Thereby the fluorescence-on/off switching performance will allow for the use of SCDs for temperature sensing and phosphor powder. Considering the good biocompatibility of SCDs (Fig. S18 in the ESI†), the potential application of SCDs as biomarker for cell imaging are explored. As shown in the confocal laser scanning microscopy (CLSM) images (Fig. 4c, d and S19 in the ESI†), the colour of bright green has been shown from HeLa cells treated with SCDs while the colour of blue has been shown from CD-labelled cells, which indicates that the CDs and SCDs have been internalized into the cells successfully.
Apart from the distinctive luminescent characteristic, the tremendous attempt has been devoted to exploring the photocatalytic activity of the silica-CD composites for selective oxidation of cis-cyclooctene,39 and environmental and energy issues.16 To date, the method with a preparation of the silica-CD composite nanomaterials could be classified into following two procedures: synthesis of CDs and compositing CDs with silica.40 The conventional two-step method is laborious, limiting the development of its productivity. Along this line, a large-scale preparation methodology for silica-CD composites is of significance for their applicability. The one-pot route presented in Scheme 1 is thus advanced and what is more, it also allows for the control over the size of the encapsulated CDs as well as maintenance of excellent luminescent quality. Also, the morphology and size of composite nanoparticles could be conveniently modulated by the modified Stöber method.41 Compared with the classical Stöber method, EDA instead of ammonium hydroxide is used as the aquatic catalyst to promote condensation of TEOS and glucose as a result of its prominent catalytic ability, apart from which it plays an important role of nitrogen source in structuring N dopant CDs to dramatically enhance the fluorescence of CDs.2,12 As far as we know, the hydrothermal technique has been widely used in the synthesis of CDs, which means that in general, the reaction is allowed to proceed at elevated temperatures (>180 °C) in a Teflon-lined autoclave.11–13 In our case, since the more active glucose and EDA have been used as carbon source and nitric stabilizer, the mild and green reaction is enabled to proceed in a common flask at low temperature (80 °C). Overall, the current one-pot synthesis for SCDs originating from the low-cost glucose would provide more convenience and efficient energy to comply with the requirement of high-throughput production and open a broad way to build CD-related composites for specific photocatalytic activity.
Conclusions
In brief, the over decades have witnessed the widespread uses of fluorescent CDs and silica. As well, the one-pot condensation approach is explored to prepare the uniform SCD composite nanoparticles with tunable fluorescence properties in a large scale. It is found that the PL emission wavelength of SCDs could be adjusted from 518 nm to 550 nm by varying the reaction conditions such as the feeding amount of water or EDA in the sol–gel process; furthermore, the excitation-dependent PL of SCDs is then thoroughly studied, and the results elucidate that the surface passivation originated from Si–O–C linkages makes the PL properties of the embedded CDs maintain the stable fluorescence emission irrespective of excitation wavelength, which shifts and affords the enhanced absorption and high quantum yield. Thus, the fantastic PL properties of SCDs promise the versatile applications after being attested by temperature sensing and cell labelling in the current work. Confining carbon dots in silica is full of brightness to control the morphology, size and PL properties.Experimental
Materials
Tetraethoxysilane (TEOS) was obtained from Shanghai Chemical Reagents Company. Glucose (glucose), absolute alcohol, and 1,2-ethanediamine (EDA) were purchased from Sinopharm Chemical Reagent Co., Ltd. All reagents were used directly without any further purification.Synthesis of SCDs and BSNs
In copolycondensation procedure, 0.5 g glucose and 3 mL deionized water (DI water) were added to a three-neck flask. After an acquirement of colourless and transparent solution taken by ultrasonic processing, 50 mL absolute alcohol and 0.1 mL EDA were added in the flask. During the stirred process of the mixture with a speed of 200 rpm at 40 °C, 1.5 mL TEOS was added to the flask followed by a continuous stir of 3 h. In this procedure, the transparent mixture turned to milky. However, in carbonization procedure, the temperature of oil bath for the flask was increased to 80 °C to reflux the mixture. After 3 h, the colour was transformed to orange–yellow, as well, the product was separated from the mixture by centrifugation and washed with water for two times to purify carbon/silica dots (SCDs). The SCDs, with emission peaks of 518 nm (SCD1.0), 534 nm (SCD0.25) and 550 nm (SCD0.1), respectively, were prepared by feeding 1.0, 0.25 and 0.1 mL of EDA, respectively. As a control experiment, the process, which is absolutely similar to above manipulations except the absence of glucose, was carried out to prepare blank silica nanoparticles (BSNs).Synthesis of CDs
After 0.5 g glucose being dissolved into a flask with 3 mL DI water by an ultrasonic treatment, 50 mL absolute alcohol and 0.1 mL EDA needed to be added into the flask, which was heated to reflux the mixture for 3 h to yield a light-yellow solution. The solution was treated with rotary evaporation so as to acquire pure carbon dots (CDs).Acquirement of rCDs
The SCDs were dispersed to 2 M NaOH solution to dissolve silica. Twelve hours later, the colour of the mixture changing to light yellow indicated the release of CDs (rCDs).Cellular uptake
Hela cells were cultivated in cell culture dish, containing 2 mM L-glutamine, 100 U mL−1 penicillin, 100 U mL−1 streptomycin RPMI-1640 and 10% (v/v) fetal bovine serum. The addition of 1 mL fresh culture serum-free medium with CDs or SCD0.1 was made to take the place of the media. After 4 h, cells should be washed for three times with fresh PBS. Afterwards, CLSM (Leica TCSSP5) was used to take fluorescent images, and the emission was collected at 450–500 nm for CDs and 550–600 nm for SCDs under excitation at 405 nm.Characterization
Transmission electron microscopy (TEM) images were obtained under a JEOL 1230 transmission electron microscope. The application of high resolution transmission electron microscopy (HRTEM, JEM-2100F) was to analyse the structure of samples. The hydrodynamic size and size distribution were determined by dynamic light scattering (DLS) particle size analyzer (Malvern Zetasizer Nano-ZS90) at scattering angle of 90°. As well, the fluorescent spectra were measured by FLS920, while the UV-vis absorption spectra were measured on Lambda 35 and FTIR spectra on a Nicolet Nexus-440 FTIR spectroscopy. Pyris 1 TGA instrument was in use for thermogravimetric analysis with a heating rate of 20 °C min−1 under air environment. X-ray diffraction (XRD) patterns were acquired from Bruker D4 X-ray diffractometer with Ni-filtered Cu Kα radiation (40 kV, 40 mA). The cellular images were obtained with a confocal laser scanning microscope (CLSM, C2+ Nikon).Conflicts of interest
There are no conflicts to declare.Acknowledgements
We acknowledge the support and assistance from the National Science Foundation of China (Grant No. 20874015 and 51273047), the special fund for basic scientific research of central colleges of Chang'an University (No. 310831171008), and the Open Project of State Key Laboratory of Molecular Engineering of Polymers (No. K2017-21)Notes and references
- X. Wang, L. Cao, S. T. Yang, F. Lu, M. J. Meziani, L. Tian, K. W. Sun, M. A. Bloodgood and Y. P. Sun, Angew. Chem., Int. Ed., 2010, 49, 5310 CrossRef CAS PubMed.
- Y. P. Sun, B. Zhou, Y. Lin, W. Wang, K. A. S. Fernando, P. Pathak, M. J. Meziani, B. A. Harruff, X. Wang, H. F. Wang, P. J. G. Luo, H. Yang, M. E. Kose, B. L. Chen, L. M. Veca and S. Y. Xie, J. Am. Chem. Soc., 2006, 128, 7756 CrossRef CAS PubMed.
- S. N. Baker and G. A. Baker, Angew. Chem., Int. Ed., 2010, 49, 6726 CrossRef CAS PubMed.
- B. Kong, A. Zhu, C. Ding, X. Zhao, B. Li and Y. Tian, Adv. Mater., 2012, 24, 5844 CrossRef CAS PubMed.
- L. Cao, X. Wang, M. J. Meziani, F. S. Lu, H. F. Wang, P. J. G. Luo, Y. Lin, B. A. Harruff, L. M. Veca, D. Murray, S. Y. Xie and Y. P. Sun, J. Am. Chem. Soc., 2007, 129, 11318 CrossRef CAS PubMed.
- J. Shen, Y. Zhu, X. Yang and C. Li, Chem. Commun., 2012, 48, 3686 RSC.
- T. Feng, X. Ai, G. An, P. Yang and Y. Zhao, ACS Nano, 2016, 10, 5587 CrossRef CAS PubMed.
- J. Hou, H. Cheng, C. Yang, O. Takeda and H. Zhu, Nano Energy, 2015, 18, 143 CrossRef CAS.
- J. Ge, Q. Jia, W. Liu, L. Guo, Q. Liu, M. Lan, H. Zhang, X. Meng and P. Wang, Adv. Mater., 2015, 27, 4169 CrossRef CAS PubMed.
- C.-B. Ma, Z.-T. Zhu, H.-X. Wang, X. Huang, X. Zhang, X. Qi, H.-L. Zhang, Y. Zhu, X. Deng, Y. Peng, Y. Han and H. Zhang, Nanoscale, 2015, 7, 10162 RSC.
- W. Li, Z. Zhang, B. Kong, S. Feng, J. Wang, L. Wang, J. Yang, F. Zhang, P. Wu and D. Zhao, Angew. Chem., Int. Ed., 2013, 52, 8151 CrossRef CAS PubMed.
- S. Zhu, Q. Meng, L. Wang, J. Zhang, Y. Song, H. Jin, K. Zhang, H. Sun, H. Wang and B. Yang, Angew. Chem., Int. Ed., 2013, 52, 3953 CrossRef CAS PubMed.
- D. Pan, J. Zhang, Z. Li and M. Wu, Adv. Mater., 2010, 22, 734 CrossRef CAS PubMed.
- J. Wang, M. Gao and G. W. Ho, J. Mater. Chem. A, 2014, 2, 5703 CAS.
- X. Wang, K. Qu, B. Xu, J. Ren and X. Qu, J. Mater. Chem., 2011, 21, 2445 RSC.
- H. Li, X. He, Z. Kang, H. Huang, Y. Liu, J. Liu, S. Lian, C. H. Tsang, X. Yang and S. T. Lee, Angew. Chem., Int. Ed., 2010, 49, 4430 CrossRef CAS PubMed.
- T. Gokus, R. R. Nair, A. Bonetti, M. Boehmler, A. Lombardo, K. S. Novoselov, A. K. Geim, A. C. Ferrari and A. Hartschuh, ACS Nano, 2009, 3, 3963 CrossRef CAS PubMed.
- Z. Ma, H. Ming, H. Huang, Y. Liu and Z. Kang, New J. Chem., 2012, 36, 861 RSC.
- S. Y. Park, H. U. Lee, E. S. Park, S. C. Lee, J.-W. Lee, S. W. Jeong, C. H. Kim, Y.-C. Lee, Y. S. Huh and J. Lee, ACS Appl. Mater. Interfaces, 2014, 6, 3365 CAS.
- J. Lu, P. S. E. Yeo, C. K. Gan, P. Wu and K. P. Loh, Nat. Nanotechnol., 2011, 6, 247 CrossRef CAS PubMed.
- Y. Q. Zhang, D. Ma, Y. Zhuang, X. Zhang, W. Chen, L. Hong, Q. Yan, K. Yu and S. Huang, J. Mater. Chem., 2012, 22, 16714 RSC.
- C. Lai, Y. Hsiao, Y. Peng and P. Chou, J. Mater. Chem., 2012, 22, 14403 RSC.
- H. Peng and J. Travas-Sejdic, Chem. Mater., 2009, 21, 5563 CrossRef CAS.
- S. J. Zhu, Q. N. Meng, L. Wang, J. H. Zhang, Y. B. Song, H. Jin, K. Zhang, H. C. Sun, H. Y. Wang and B. Yang, Angew. Chem., Int. Ed., 2013, 52, 3953 CrossRef CAS PubMed.
- A. B. Bourlinos, A. Stassinopoulos, D. Anglos, R. Zboril, V. Georgakilas and E. P. Giannelis, Chem. Mater., 2008, 20, 4539 CrossRef CAS.
- S. Hu, A. Trinchi, P. Atkin and I. Cole, Angew. Chem., Int. Ed., 2015, 54, 2970 CrossRef CAS PubMed.
- K. Jiang, S. Sun, L. Zhang, Y. Lu, A. Wu, C. Cai and H. Lin, Angew. Chem., Int. Ed., 2015, 54, 5360 CrossRef CAS PubMed.
- S. Lu, L. Sui, J. Liu, S. Zhu, A. Chen, M. Jin and B. Yang, Adv. Mater., 2017, 29, 1603443 CrossRef PubMed.
- H. Ding, S. B. Yu, J. S. Wei and H. M. Xiong, ACS Nano, 2016, 10, 484 CrossRef CAS PubMed.
- M. J. Krysmann, A. Kelarakis, P. Dallas and E. P. Giannelis, J. Am. Chem. Soc., 2012, 134, 747 CrossRef CAS PubMed.
- H. Li, Z. Kang, Y. Liu and S. T. Lee, J. Mater. Chem., 2012, 22, 24230 RSC.
- L. Wang, J. Lei and J. Zhang, Chem. Commun., 2009, 2195 RSC.
- B. H. Jun, D. W. Hwang, H. S. Jung, J. Jang, H. Kim, H. Kang, T. Kang, S. Kyeong, H. Lee, D. H. Jeong, K. W. Kang, H. Youn, D. S. Lee and Y. S. Lee, Adv. Funct. Mater., 2012, 22, 1843 CrossRef CAS.
- Z. Ding, B. M. Quinn, S. K. Haram, L. E. Pell, B. A. Korgel and A. J. Bard, Science, 2002, 296, 1293 CrossRef CAS PubMed.
- Y. Dong, H. Pang, H. B. Yang, C. Guo, J. Shao, Y. Chi, C. M. Li and T. Yu, Angew. Chem., Int. Ed., 2013, 52, 7800 CrossRef CAS PubMed.
- J. Jeong, M. Cho, Y. T. Lim, N. W. Song and B. H. Chung, Angew. Chem., Int. Ed., 2009, 48, 5296 CrossRef CAS PubMed.
- W. H. Green, Science, 1997, 276, 1826 CrossRef CAS.
- C.-T. Chien, S.-S. Li, W.-J. Lai, Y.-C. Yeh, H.-A. Chen, I.-S. Chen, L.-C. Chen, K.-H. Chen, T. Nemoto, S. Isoda, M. Chen, T. Fujita, G. Eda, H. Yamaguchi, M. Chhowalla and C.-W. Chen, Angew. Chem., Int. Ed., 2012, 51, 6662 CrossRef CAS PubMed.
- X. Han, Y. Han, H. Huang, H. Zhang, X. Zhang, R. Liu, Y. Liu and Z. Kang, Dalton Trans., 2013, 42, 10380 RSC.
- F. Wang, Z. Xie, H. Zhang, C. Liu and Y. Zhang, Adv. Funct. Mater., 2011, 21, 1027 CrossRef CAS.
- W. Stober, A. Fink and E. Bohn, J. Colloid Interface Sci., 1968, 26, 62 CrossRef.
Footnote |
| † Electronic supplementary information (ESI) available: Experimental details and figures. See DOI: 10.1039/c7ra07990g |
| This journal is © The Royal Society of Chemistry 2017 |

