 Open Access Article
Creative Commons Attribution 3.0 Unported Licence
Lignocellulosic biomass-derived, graphene sheet-like porous activated carbon for electrochemical supercapacitor and catechin sensing†
Vediyappan Veeramaniab,
Mani Sivakumarb,
Shen-Ming Chen *b,
Rajesh Madhuc,
Hatem R. Alamrid,
Zeid A. Alothmane,
Md. Shahriar A. Hossainfg,
Ching-Kuo Chenb,
Yusuke Yamauchifgh,
Nobuyoshi Miyamotoc and
Kevin C.-W. Wu
 *a
*a
aDepartment of Chemical Engineering, National Taiwan University, No. 1, Sec. 4, Roosevelt Road, Taipei 10617, Taiwan. E-mail: kevinwu@ntu.edu.tw
bDepartment of Chemical Engineering and Biotechnology, National Taipei University of Technology, Taipei 10608, Taiwan. E-mail: smchen78@ms15.hinet.net
cDepartment of Life, Environment, and Materials Science, Fukuoka Institute of Technology, 3-30-1, Wajirohigashi, Higashiku, Fukuoka 811-0295, Japan
dPhysics Department, Jamoum University College, Umm Al-Qura University, Makkah 21955, Saudi Arabia
eAdvanced Materials Research Chair, Chemistry Department, College of Science, King Saud University, Riyadh 11451, Saudi Arabia
fAustralian Institute for Innovative Materials (AIIM), University of Wollongong, Squires Way, North Wollongong, NSW 2500, Australia
gInternational Center for Materials Nanoarchitectonics (MANA), National Institute for Materials Science (NIMS), 1-1 Namiki, Tsukuba, Ibaraki 305-0044, Japan
hSchool of Chemical Engineering & Australian Institute for Bioengineering and Nanotechnology (AIBN), The University of Queensland, Brisbane, QLD 4072, Australia
First published on 25th September 2017
Abstract
We synthesize graphene sheet-like porous activated carbon (GPAC) with a high specific surface area by using Bougainvillea spectabilis as a precursor with the assistance of a facile and reliable chemical activation method. The as-synthesized GPAC materials were characterized with a variety of physico-chemical and analytical techniques to investigate their structural and porous properties. In addition, we apply the synthesized GPAC as an electrode material for supercapacitor and catechin sensing, and corresponding electrochemical studies were carried out using cyclic voltammetry, galvanostatic charge–discharge and differential pulse voltammetry. For supercapacitor application, the GPAC exhibits a specific capacitance of 233 F g−1 (at a current density of 1.6 A g−1) and an energy density of 7.2 W h kg−1 (for a symmetric cell). For the sensing application, the GPAC exhibits sensitive detection of catechin (CA). We achieved good sensitivity, an extensive linear range, and a low limit of detection for the CA sensor, with values of 7.2 μA μM−1 cm−2, 4–368 μM, and 0.67 μM, respectively. We further test the GPAC sensor in green tea leaves for real time CA detection. This work demonstrates the successful conversion of waste biomass to useful electrochemical devices.
1. Introduction
Carbon-based nanomaterials (e.g. graphene oxide (GO), carbon nanotube (CNT), fullerene, etc.) exhibit many advantages such as high specific surface area, meso-/micro-porosity, and high electrical conductivity, so they have been considered useful for various applications.1–3 In contrast to graphene oxide and carbon nanotubes, which require complicated synthetic processes and instrumental set-ups, activated carbons (ACs) can be prepared from various types of biomass (coconut shell, dead mango leaves, guava leaves, water hyacinth, water bamboo, pumpkin stems, eggplants, etc.).1,4–9 In addition, the synthesized ACs have been employed in various applications such as supercapacitors,5,10,11 Li-ion batteries,12 removal of organic dyes and toxic metal ions,4 electrochemical and biomedical sensors,8 and electrocatalysts,13,14 owing to their high surface area with modulated pore size, low cost, self-doping of heteroatoms, and natural abundance.4,5 Hence, it is becoming a hot research topic around the world to prepare functional ACs from biomass conversion and to apply the synthesized functional ACs in various electrochemical applications.15The supercapacitor is one of the important electrochemical applications owing to its high power density and long cycle life.16–21 Based on the fundamentals of their storage mechanisms, supercapacitors have been classified into two types: (1) electrochemical double layer capacitors (EDLCs), where electrostatic charges are accumulated on the surfaces of electrode materials and electrolyte interfaces, and (2) pseudocapacitors, which have electrodes with the faradaic redox mechanism.22 In both cases, biomass-derived porous carbon materials are potentially useful in supercapacitors, owing to their versatile properties such as self-doping of heteroatoms (N, S), high specific surface area, and various kinds of pore sizes.22–24 Recently, other examples using graphene, CNTs, and carbon nanofibers have also demonstrated good performance for supercapacitor application.21,25,26
In grocery stores, there are various foods that contain cancer-fighting properties owing to their antioxidants and radical scavenger properties.27,28 Among these, catechin (CA) belongs to the flavonoid family and features polyphenol groups. Moreover, it is contained in a variety of common foods and drinks, such as fruits, vegetables, wines, and some types of tea. For examples, green tea contains a high percentage of CA, up to 30%, so it provides chemo-preventative properties that are beneficial to human health for reducing the risk of coronary heart disease and decreasing high blood pressure.29–31 Furthermore, it participates in many activities in the human body with relevance to preventing atherosclerosis and diabetes, and it has anti-carcinogenic anti-inflammatory properties.32 There are various methods for the detection of CA, such as thin-layer chromatography (TLC), capillary electrophoresis (CE), high performance liquid chromatography with ultraviolet detection (HPLC-UV), biomimetic sensors, and electrochemical methods.33–35 Among them, the electrochemical method is the best choice because of its simple and time-saving operation processes, good response time, high sensitivity, excellent selectivity, and low cost.36
Here, we use a biomass precursor (i.e. Bougainvillea spectabilis) to synthesize graphene sheet-like porous activated carbon (namely, GPAC), as shown in Scheme 1. After that, we further applied the synthesized GPAC as supercapacitor electrodes. The assembled supercapacitor device with a maximum capacitance of 233 F g−1 was tested and demonstrated using light emitting diode (LED) light (Scheme 1(i)). Additionally, a GPAC modified glassy carbon electrode (GCE) was applied for real-time detection of CA in green tea samples, with an enhanced detection limit of 0.67 μM (Scheme 1(ii)).
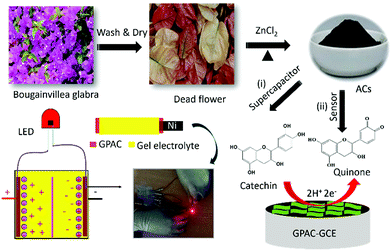 | ||
| Scheme 1 Synthesis of graphene sheet-like activated carbon (GPAC) and its applications as an electrode material for supercapacitors and catechin sensor. | ||
2. Experimental
2.1. Synthesis of graphene sheet-like porous activated carbons (GPAC)
Bougainvillea spectabilis flowers were collected from National Taipei University of Technology (NTUT) campus and used as the biomass source. The preparation of GPAC was modified from a previous report.5 Typically, the flowers were cut into a small pieces and then kept in a water bath for one day. After that, the water was removed, and then the residue was dried in an oven at 100 °C. Afterwards, the dried material was preheated at 200 °C for 6 h and then ground into a fine powder. For the activation process, the preheated carbon powder was mixed with 10% ZnCl2, then stirred at 60 °C under N2 atmosphere for 24 h. After that, the powder was carbonized in a tubular furnace at different temperatures for 3 h in N2 atmosphere with a heating rate of 5 °C min−1. Finally, the carbonized powder was washed with 1.0 M HCl and hot distilled water until the pH reached neutral, prior to drying it at 100 °C overnight. The as-synthesized carbon samples were labelled as AC-700, AC-800 (also called GPAC), and AC-900 for samples calcined at 700, 800, and 900 °C, respectively.2.2. Fabrication of electrodes
2.3. Instrumentation
The crystallinity of the samples were characterized by X-ray diffraction (Rigaku, MiniFlex II). The surface morphology and structure of the samples were observed with field-emission scanning electron microscopy (FE-SEM; Hitachi S-3000) and transmission electron microscopy (TEM; JEOL operated at 300 kV), respectively. The porous properties of the samples were analyzed with N2 adsorption/desorption isotherms (Quantachrome, Autosorb-1 system). For the elemental analysis, X-ray photoelectron spectroscopy (XPS) was carried out (ULVAC-PHI PHI 5000 Versa Probe instrument). The surface functionality of the samples were measured with Raman spectroscopy (WITeck CRM200 confocal microscopy Raman system). The cyclic voltammetry (CV), galvanostatic charge–discharge (GCD), and differential pulse voltammetry (DPV) studies were accomplished by using a CHI 627 (CH instrument) electrochemical analyzer.3. Results and discussion
3.1. Morphology, spectroscopy, and structural analysis
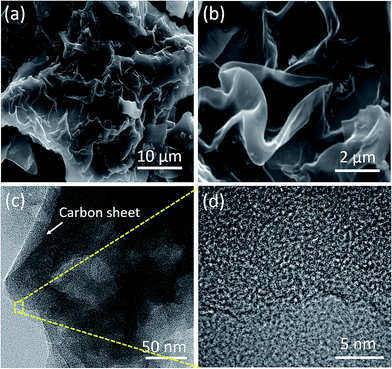
The typical SEM and HR-TEM images of the GPAC, AC-700, and AC-900 samples are shown in Fig. 1 and S1,† respectively. A flake-like morphology was obtained for the sample calcined at 700 °C (i.e. AC-700) (Fig. S1a†), while increasing the carbonization temperature to 800 °C, it changed into a wrinkled graphene sheet-like morphology (i.e. GPAC) (Fig. 1a and b). On further increasing the temperature, the graphene sheet-like carbon changed into a particle morphology (Fig. S1b†).The fine structure of the GPAC sample was further examined by HR-TEM. Fig. S1(c and d)† shows the AC-700 and AC-900 samples, which confirmed the flake-like morphology of the former sample. In contrast to AC-700 and AC-900, it was confirmed that the GPAC sample indeed exhibited multilayer wrinkled graphene sheets, as shown in Fig. 1c. Additionally, Fig. 1d and the inset figures to Fig. S1c and d† show high-resolution HR-TEM images of all samples, which further confirm that the obtained samples were mesoporous with amorphous graphitic carbon frameworks.
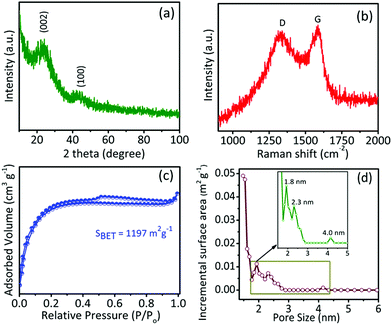
The physical and chemical properties of the as-synthesized samples were investigated by XRD, Raman spectroscopy, XPS, nitrogen adsorption/desorption isotherms, and pore size distribution studies. As shown in Fig. 2a, for a typical GPAC sample, there are two XRD peaks at 23.8° and 43°, which are consistent with the (002) and (100) planes of graphitic carbon and disordered carbon, respectively. The intensities of the peaks were low due to the low crystallinity of the graphitic structure. Raman spectroscopy further confirmed the graphitic carbon (G band) and disordered carbon (D band) by showing peaks centred at ∼1592.48 cm−1 and ∼1353.69 cm−1, respectively (Fig. 2b). Similar results were obtained for the AC-700 and AC-900 samples (Fig. S2†). The calculated relative intensity ratio (ID/IG) values for these peaks for all the samples are summarized in Table 1. It is found that the intensity of the G band is slightly higher than the D band, indicating there is more structurally ordered graphite in the synthesized samples.
| Samples | Specific surface area (m2 g−1) | Pore volume (m3 g−1) | Pore diameter (nm) | ID/IG | ||
|---|---|---|---|---|---|---|
| Vtot | Vmicro | Vmeso | ||||
| AC-700 | 1142 | 0.52 | 0.13 | 0.72 | 1.74 | 0.83 |
| GPAC | 1197 | 0.51 | 0.16 | 0.35 | 1.72 | 0.84 |
| AC-900 | 1046 | 0.47 | 0.14 | 0.33 | 1.82 | 0.84 |
Furthermore, the porous properties of samples were examined with N2 adsorption/desorption isotherms, as shown in Fig. 2c and S2c,† and the corresponding pore size distributions of the samples calculated by using the nonlinear density functional theory (NLDFT) method are shown in Fig. 2d and S2d.† The specific surface areas and pore sizes are summarized in Table 1. All samples exhibited high specific surface areas of over 1000 m2 g−1 and typical type-I isotherms, indicating the presence of micropores (1.7 to 1.8 nm). In addition, the isotherm has slight upward loops at relative pressure P/P0 around 0.5, which corresponds to the presence of mesopores.37 The hierarchically porous feature together with the high specific surface area of the samples would be helpful for their electrochemical applications. Furthermore, the chemical bonding and elemental composition of all samples were examined by XPS. As shown in Fig. S3,† the C 1s, and O 1s signals were observed in the full range spectra of the AC-900, GPAC, and AC-700 samples, which reveal that the obtained carbon materials do not contain any other signals, which relates to any possible impurities.
3.2. Electrochemical supercapacitor
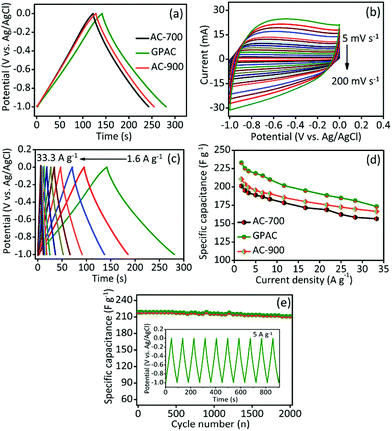
The electrochemical capacitive performance of each electrode was investigated by cyclic voltammetry (CV) and galvanostatic charge–discharge (GCD) test. Fig. 3a presents GCD curves for different electrode materials (i.e. AC-700, GPAC, and AC-900) and their analogous CV curves also shown in Fig. S4.† The obtained specific capacitance values are 202, 233, and 211 F g−1 for AC-700, GPAC, and AC-900 electrode, respectively. The GPAC electrode achieved the highest capacitance value of 233 F g−1, which resulted from its having the highest specific surface area. We further collected CV curves for the GPAC electrode at different scan rates within the potential window of −1.0 to 0 V. As shown in Fig. 3b, on increasing the scan rate, the rectangular shape of the CV curves did not change, even at the high scan rate of 200 mV s−1, which means that the electrode has good rate performance and can simultaneously increase the current response. Furthermore, its analogous GCD profiles are shown in Fig. 3c with different current densities from 1.6 to 33.3 A g−1. The obtained specific capacitance value compared with some previous reports in the literature as shown in Table S1.†Fig. 3d presents the obtained specific capacitance values as a function of various current densities for the AC-700, GPAC, and AC-900 materials. The specific capacitance of each sample decreases when the current density increases, which is common in most carbon-based electrodes.5,6,9,10 Fig. 3e reveals the cycling stability for the GPAC electrode at a constant current density of 5 A g−1 over 2000 charge/discharge cycles. After cycling, about 98% of the initial capacitance was retained, which demonstrated that the electrode has excellent durability. Based on the results above, the wrinkled graphene sheet-like morphology could help in the transportation of ions across the electrode/electrolyte interface. Furthermore, the natural presence of the heteroatoms would enhance the wettability of the electrode materials.38,39 In addition, the GPAC sample exhibits a hierarchically porous structure, and this would increase its storage capacity, which is likely to be the main reason for its enhanced electrochemical performance.
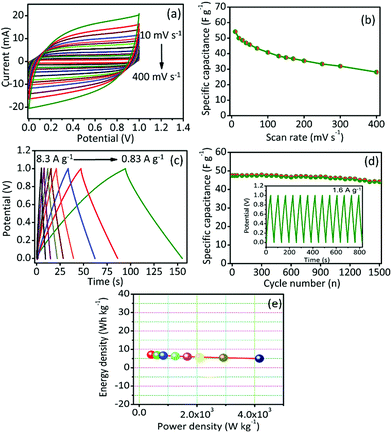
To ensure suitability for practical application, we fabricated symmetric cell (SC) supercapacitor using GPAC as the material for both electrodes, and a polymer gel electrolyte (PVA/KOH) used as the separator. The capacitive performance of the as-prepared SC device (GPAC/PVA/KOH/GPAC) was analyzed, and the resultant data are shown in Fig. 4. Fig. 4a shows the CV curves at different scan rates for the fabricated SC. Note that the rectangular shape of its CV curves was maintained up to 400 mV s−1, which is higher than for its corresponding three-electrode performance. The obtained capacitance value (54 F g−1 at 10 mV s−1) is shown in Fig. 4b. Furthermore, we could also measure the capacitance value from GCD method by scanning at different current densities (Fig. 4c). The obtained specific capacitance value for the SC device is 51 F g−1 at 0.83 A g−1. As expected, 94% of the initial specific capacitance is retained after 1500 cycles, which suggests good stability for the SC (Fig. 4d). Furthermore, we have plotted the Ragone plot for the SC and shown that it delivers a maximum energy density of 7.2 W h kg−1 (Fig. 4e). As a result, the obtained energy density value is quite comparable with those of many previously reported biomass-derived carbon-based materials.39–44
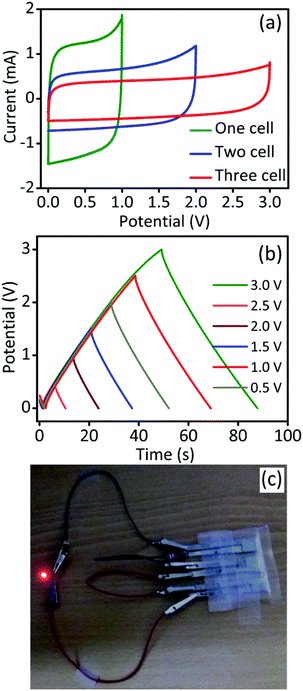
To establish a practical device, the GPAC-based three cells were connected in series and the corresponding electrochemical behavior was tested. As shown in Fig. 5a and b, and S5,† the operating potential from CV and GCD for a single cell is 1.0 V and can further increase up to 3.0 V by connecting another two cells in series. Finally, the fabricated device was used to light up a red LED (working potential below 2.0 V) and a photograph of the cell set-up is shown in Fig. 5c. We conclude that the GPAC material is more suitable for solid-state supercapacitors than liquid electrolyte capacitors because the former can avoid the leakage of electrolyte in the packed cell.
3.3. Electrochemical determination of CA
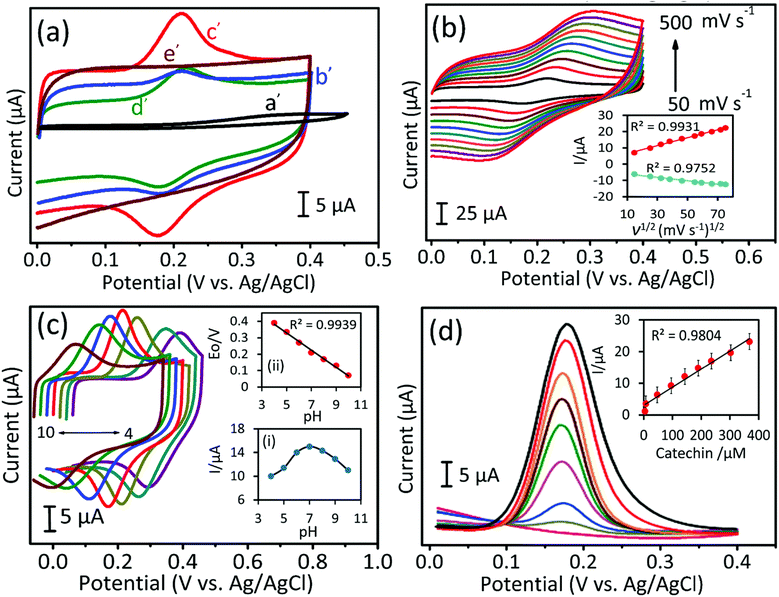
Electrochemical properties of the as-synthesized carbon materials were studied by using the CV and DPV methods in 0.05 M phosphate buffered saline (PBS, pH 7.0) electrolyte solution at a scan rate of 50 mV s−1. The electrochemical response to CA oxidation for bare GCE electrode (a′) and for AC-700 (b′), GPAC (c′), and, AC-900 (d′) modified GCE electrodes with/without the presence of CA (240 μM) (i.e. the blank (e′) is the one without CA). As shown in Fig. 6a, as compared to AC-700, AC-900, and bare GCE, the GPAC modified GCE exhibits a sharp peak current and very low overpotential of 0.16 V. Fig. 6b presents the CV profiles for the GPAC-modified electrode recorded in the presence of CA (240 μM) at scan rates in the range of 50–500 mV s−1. With increasing scan rate, the peak current was increased, while the oxidation peak potential was shifted towards the positive direction and reduction peak potential was shifted towards the negative direction. The oxidation peak reveals the CA to quinone oxidation and again it reduced to CA while in reduction process (Scheme 2). The inset shows the corresponding calibration plot for the peak current vs. square root of scan rate, and the linear regression equation is y = 0.243x + 4.163 and y = −0.1036x − 4.95 (linear correlation coefficient, R2 = 0.9931; R2 = 0.9752). Hence, the oxidation of CA on the electrode surface is a diffusion-controlled process. The reaction mechanisms can be expressed as follows (Scheme 2).30Because the peak current depends on the pH, it is critical to determine an optimized pH value. Fig. 6c shows the optimization of the pH value for the GPAC-modified electrode in the presence of CA (240 μM) at a constant scan rate of 50 mV s−1. The corresponding calibration plots are shown in the insets. In inset (i), the peak current of CA was varied as the pH value was changed (from 4 to 10), because protons can promote the adsorption of CA on the electrode surface up to pH = 7. When the pH value exceeded 7, the peak current decreased due to the prevention of CA absorption by hydroxyl anions. Inset (ii) shows peak potential vs. pH, which obeys the equation Ep = −0.0525x (pH) + 0.5925 (R2 = 0.9939). This gives a result that is a little lower than the theoretical pH value. Based on the Nernst equation, the electrode reaction indicates that an equal number of protons and electrons are involved in the reversible electrochemical process of CA oxidation. Moreover, Fig. S6a† shows the relationship between peak current and different CA concentrations from 49 μM to 697 μM, with the calibration plot in the inset. It was found that the peak current could be linearly fitted with respect to the concentration.
To attain high sensitivity, the fabricated electrode was further tested by differential pulse voltammetry (DPV). Fig. 6d shows the DPV curves for the GPAC-modified electrode at varying concentrations of CA in PBS solution. From this result, it was obvious that the oxidation peak current of CA increased linearly on increasing the CA concentration. The inset shows the corresponding calibration plot for CA oxidation. Moreover, this electrode exhibits a wider linear range up to 368 μM, and its resultant linear regression equation is y (μA) = 0.057 (μM) + 3.015 with correlation coefficient, R2 = 0.980. Hence, the calculated parameter values are 4–368 μM, 7.2 μA μM−1 cm−2, and 0.67 μM corresponding to the linear range, sensitivity, and limit of detection, respectively. The obtained linear range and sensitivity values are very high, as compared with previously reported literatures (Table S2†).45–47
3.4. Real-time application in green tea leaves
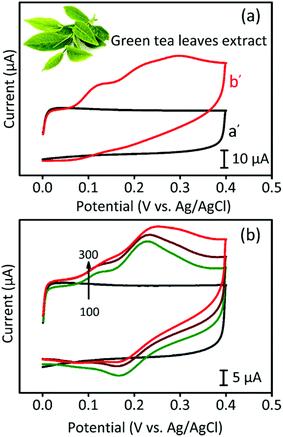
For the real-time analysis, a commercially available green tea sample was purchased in the local market and used after pre-treatment. First, the tea sample was put into a buffer solution (pH 7.0) and was sonicated for 10 minutes prior to filtration. Fig. 7 presents the CV analysis of CA detection in the green tea sample. In Fig. 7a, we took 10 mL of PBS containing pre-treated green tea extract and measured the corresponding CV curves. In contrast to the blank sample showing no peak in the CV curve, the green tea-containing sample showed several broad peaks. When we increased the concentration of green tea extract, the CV peaks became stronger, as shown in Fig. 7b. In addition, Fig. S6b† presents the DPV curves of the green tea-containing sample, where a standard chemical was added. The results exhibited a good linear range up to 206 μM, indicating that the GPAC-based electrode is suitable for real time detection.3.5. Reproducibility and stability studies
Stability and reproducibility are two of the most important issues for real time applications of sensors. To study these two issues, the GPAC-modified electrode was tested in the presence of CA (240 μM), and the electrode was then stored at room temperature for one week. After that, we collected CV curves again and found that the sample retained 92% of its original performance with a relative standard deviation (RSD) value of 1.54%. To measure reproducibility, we tested five different GPAC modified electrodes for their ability to detect CA. We found that all the data were similar with an RSD value of 2.3%. Consequently, we can conclude that the synthesized GPAC-based electrodes exhibit excellent reproducibility and stability.4. Conclusions
We have demonstrated an eco-friendly method to convert lignocellulosic biomass to activated carbon material (namely, graphene-like activated carbon (GPAC)) with a high specific surface area (1197 m2 g−1), hierarchical pore structure (meso- and micropores), and graphene-like framework. These advantages endow the GPAC material with a maximum specific capacitance value of 233 F g−1 at a current density of 1.6 A g−1. In addition, we further used GPAC to fabricate a symmetric solid state supercapacitor, and it exhibited a high energy density of 7.2 W h kg−1. In addition to the supercapacitor, the GPAC-based electrode also revealed excellent performance towards the detection of catechin (CA). The proposed CA sensor exhibits extraordinary analytical advantages such as low overpotential, as well as a wide linear range with good sensitivity and a low detection limit, which would enable its use in real-time CA detection in green tea leaves.Conflicts of interest
There are no conflicts to declare.Acknowledgements
We would like to thank the Ministry of Science and Technology (MOST) of Taiwan (104-2628-E-002-008-MY3; 105-2218-E-155-007; 105-2221-E-002-003-MY3; 105-2221-E-002-227-MY3; 105-2622-E-155-003-CC2) and the Aim for Top University Project at National Taiwan University (105R7706) for funding support. SMC thanks the National Taipei University of Technology (MOST 106-2811-M-027-004 to SMC). This work was partially supported by the service of The Pore Fabrication Pty Ltd. (Australia) and the Australian Research Council (ARC) Future Fellow (FT150100479). Y. Y and Z. A. A. are grateful to the Deanship of Scientific Research, King Saud University for funding through Vice Deanship of Scientific Research Chairs.References
- Z. Hu, M. P. Srinivasan and Y. Ni, Adv. Mater., 2000, 12, 62–65 CrossRef CAS.
- J. Wang and S. Kaskel, J. Mater. Chem., 2012, 22, 23710–23725 RSC.
- M. Sevilla and R. Mokaya, Energy Environ. Sci., 2014, 7, 1250–2128 CAS.
- R. Madhu, K. V. Sankar, S.-M. Chen and R. K. Selvan, RSC Adv., 2014, 4, 1225–1233 RSC.
- R. Madhu, V. Veeramani, S.-M. Chen, P. Veerakumar and S.-B. Liu, Chem.–Eur. J., 2015, 21, 8200–8206 CrossRef CAS PubMed.
- X. Liu, Y. Zhou, W. Zhou, L. Li, S. Huang and S. Chen, Nanoscale, 2015, 7, 6136–6142 RSC.
- J. Li and Q. Wu, New J. Chem., 2015, 39, 3859–3864 RSC.
- R. Madhu, V. Veeramani, S.-M. Chen, J. Palanisamy and A. T. E. Vilian, RSC Adv., 2014, 4, 63917–63921 RSC.
- Z. Li, W. Lv, C. Zhang, B. Li, F. Kang and Q.-H. Yang, Carbon, 2015, 92, 11–14 CrossRef CAS.
- J. Deng, T. Xiong, F. Xu, M. Li, C. Han, Y. Gong, H. Wang and Y. Wang, Green Chem., 2015, 17, 4053–4060 RSC.
- Z. Gao, Y. Zhang, N. Song and X. Li, Mater. Res. Lett., 2016, 5, 69–88 CrossRef.
- K.-l. Hong, L. Qie, R. Zeng, Z. Yi, W. Zhang, D. Wang, W. Yin, C. Wu, Q.-J. Fan, W.-X. Zhang and Y.-H. Huang, J. Mater. Chem. A, 2014, 2, 12733–12738 CAS.
- X. Liu, Y. Zhou, W. Zhou, L. Li, S. Huang and S. Chen, Nanoscale, 2015, 7, 6136–6142 RSC.
- H. Yuan, L. Deng, X. Cai, S. Zhou, Y. Chena and Y. Yuan, RSC Adv., 2015, 5, 56121–56129 RSC.
- (a) Q. Xia, Z. Chen, Y. Shao, X. Gong, H. Wang, X. Liu, S. F. Parker, X. Han, S. Yang and Y. Wang, Nat. Commun., 2016, 7, 11162 CrossRef PubMed; (b) F. H. Isikgora and C. R. Becer, Polym. Chem., 2015, 6, 4497–4559 RSC.
- X. Peng, L. Peng, C. Wu and Y. Xie, Chem. Soc. Rev., 2014, 43, 3303–3323 RSC.
- H. Zhang, Y. Wang, D. Wang, Y. Li, X. Liu, P. Liu, H. Yang, T. An, Z. Tang and H. Zhao, Small, 2014, 16(10), 3371–3378 CrossRef PubMed.
- W. K. Chee, H. N. Lim, Z. Zainal, N. M. Huang, I. Harrison and Y. Andou, J. Phys. Chem. C, 2016, 120, 4153–4172 CAS.
- Y. Huang, J. Liang and Y. Chen, Small, 2012, 8, 1805–1834 CrossRef CAS PubMed.
- L. Dong, C. Xu, Y. Li, Z.-H. Huang, F. Kang, Q.-H. Yang and X. Zhao, J. Mater. Chem. A, 2016, 4, 4659–4685 CAS.
- W. Qian, F. Sun, Y. Xu, L. Qiu, C. Liu, S. Wang and F. Yan, Energy Environ. Sci., 2014, 7, 379–386 CAS.
- M. Sevilla and R. Mokaya, Energy Environ. Sci., 2014, 7, 1250–1280 CAS.
- S. Gao, K. Geng, H. Liu, X. Wei, M. Zhang, P. Wang and J. Wang, Energy Environ. Sci., 2015, 8, 221–229 CAS.
- L. Xie, G. Sun, F. Su, X. Guo, Q. Kong, X. Li, X. Huang, L. Wan, W. Song, K. Li, C. Lv and C.-M. Chen, J. Mater. Chem. A, 2016, 4, 1637–1646 CAS.
- J. Deng, M. Li and Y. Wang, Green Chem., 2016, 18, 4824–4854 RSC.
- Y. Shao, M. F. El-Kady, L. J. Wang, Q. Zhang, Y. Li, H. Wang, M. F. Mousavi and R. B. Kaner, Chem. Soc. Rev., 2015, 44, 3639–3665 RSC.
- F. Shadidi, P. K. Janitha and P. D. Wanasundara, Crit. Rev. Food Sci. Nutr., 1992, 32, 67 CrossRef PubMed.
- D. A. El-Hady and N. A. El-Maali, Talanta, 2008, 76, 138–145 CrossRef PubMed.
- S. C. Fernandes, R. Osório, A. Anjos, A. Neves, G. A. Micke and I. C. Vieira, J. Braz. Chem. Soc., 2008, 19, 1215–1223 CrossRef CAS.
- A. T. Ezhil Vilian, R. Madhu, S.-M. Chen, V. Veeramani, M. Sivakumar, Y. S. Huh and Y.-K. Han, J. Mater. Chem. B, 2015, 3, 6285–6292 RSC.
- B. Devadas and S.-M. Chen, J. Solid State Electrochem., 2015, 19, 1103–1112 CrossRef CAS.
- C. Carmen, G. M. Rafael and L. P. Carmen, J. Agric. Food Chem., 2003, 51, 4427–4435 CrossRef PubMed.
- K. Dhalwal, V. M. Shinde, Y. S. Biradar and K. R. Mahadik, J. Food Compos. Anal., 2008, 21, 496–500 CrossRef CAS.
- Z. Chen, L. Zhang and G. Chen, J. Chromatogr. A, 2008, 1193, 178–181 CrossRef CAS PubMed.
- P. Iacopini, M. Baldi, P. Storchi and L. Sebastiani, J. Food Compos. Anal., 2008, 21, 589–598 CrossRef CAS.
- M. Fernandes, D.-B. Renata EI-Hage, A. Ademir Dos, N. Ademir, A. M. Gustavo and C. V. Iolanda, J. Braz. Chem. Soc., 2008, 19, 1215–1223 CrossRef.
- G. Xu, J. Han, B. Ding, P. Nie, J. Pan, H. Dou, H. Li and X. Zhang, Green Chem., 2015, 17, 1668–1674 RSC.
- B. Li, F. Dai, Q. Xiao, L. Yang, J. Shen, C. Zhang and M. Cai, Energy Environ. Sci., 2016, 9, 102–106 CAS.
- Q. Liang, L. Ye, Z.-H. Huang, Q. Xu, Y. Bai, F. Kang and Q.-H. Yang, Nanoscale, 2014, 6, 13831–13837 RSC.
- M. Wahid, D. Puthusseri, D. Phase and S. Ogale, Energy Fuels, 2014, 28, 4233–4240 CrossRef CAS.
- L. Zhou, H. Cao, S. Zhu, L. Hou and C. Yuan, Green Chem., 2015, 17, 2373–2382 RSC.
- K. Wu, B. Gao, J. Su, X. Peng, X. Zhang, J. Fu, S. Peng and P. K. Chu, RSC Adv., 2016, 6, 29996–30003 RSC.
- Y.-Q. Zhao, M. Lu, P.-Y. Tao, Y.-J. Zhang, X.-T. Gong, Z. Yang, G.-Q. Zhang and H.-L. Li, J. Power Sources, 2016, 307, 391–400 CrossRef CAS.
- J. Wang, L. Shen, Y. Xu, H. Dou and X. Zhang, New J. Chem., 2015, 39, 9497–9503 RSC.
- X. Wang, J. Li and Y. Fan, Microchim. Acta, 2010, 169, 173–179 CrossRef CAS.
- S. Masoum, M. Behpour, F. Azimi and M. H. Motaghedifard, Sens. Actuators, B, 2014, 193, 582–591 CrossRef CAS.
- S. K. Moccelini, S. C. Fernandes, T. P. Camargo, A. Neves and I. C. Vieira, Talanta, 2009, 8, 1063–1068 CrossRef PubMed.
Footnote |
| † Electronic supplementary information (ESI) available. See DOI: 10.1039/c7ra07810b |
| This journal is © The Royal Society of Chemistry 2017 |

