 Open Access Article
Electrospun magnetic CoFe2O4/Ag hybrid nanotubes for sensitive SERS detection and monitoring of the catalytic degradation of organic pollutants†
Wei Song *a,
Zezhou Yangb,
Fuqiu Mac,
Maoqiang Chib,
Bing Zhao
 a and
Xiaofeng Lu
 *b
*b
aState Key Laboratory of Supramolecular Structure and Materials, Jilin University, Changchun 130012, P. R. China. E-mail: weisong@jlu.edu.cn; Fax: +86-431-85168473; Tel: +86-431-85168473
bAlan G. MacDiarmid Institute, College of Chemistry, Jilin University, Changchun, 130012, P. R. China. E-mail: xflu@jlu.edu.cn
cFundamental Science of Nuclear Safety and Simulation Technology Laboratory, Harbin Engineering University, 150001, P. R. China
First published on 18th August 2017
Abstract
We report on the facile synthesis of magnetic CoFe2O4/Ag hybrid nanotubes, as a reliable and sensitive surface enhanced Raman scattering (SERS) substrate for sensitive detection and in situ monitoring of the catalytic degradation process of organic pollutants. This SERS substrate, based on CoFe2O4/Ag hybrid nanotubes, is achieved through an electrospinning followed by calcination process. The CoFe2O4 and Ag nanoparticles are well dispersed in the CoFe2O4/Ag hybrid nanotubes. The unique heterostructure and strong interactions between CoFe2O4 and Ag nanoparticles in the hybrid nanotubes contribute the electromagnetic field SERS enhancement. In addition, target molecules can be easily enriched on the surface of the CoFe2O4/Ag hybrid nanotubes due to their magnetic properties, further providing good SERS properties. The CoFe2O4/Ag hybrid nanotubes can be also used as a catalyst for the degradation of organic pollutants. Therefore, we have developed a facile approach by using CoFe2O4/Ag hybrid nanotubes as both catalyst and SERS substrate to determine the reaction kinetics of the catalytic degradation of organic pollutants.
Introduction
Surface enhanced Raman scattering (SERS) is powerful and fascinating analytical technology with a large variety of applications in biology, medical science, food security, chemical and environmental fields.1–6 The SERS technique can provide intrinsic structure information of target molecules with a huge enhancement (generally up to 106 times) compared with traditional Raman spectroscopy.7–10 The most important process for SERS analysis is the fabrication of the active substrate, such as rough noble metals (e.g., Au, Ag and Cu) and semiconductor nanomaterials.11–16 In general, the enhancement factor (EF) for rough noble metals can reach more than 104 due to the existence of electromagnetic field, while the EF for semiconductors is only about 10–100, which is related to the charge-transfer complex formed between semiconductors and target molecules. To further increase the SERS activity, it is a meaningful object to utilize both the electromagnetic enhancement of noble metals and change-transfer enhancement of semiconductors. In the past few years, hybrid nanomaterials consisting of multicomponents have also been used as efficient SERS substrate, such as Au/TiO2 nanotube arrays,17 Ag/TiO2 nanofibers,18 porous CuO/Ag nanofibers,19 Ag/ZnO hollow nanospheres,20 and Ag/NiO nanoflakes.21 In addition, the noble metal/semiconductor based hybrid nanomaterials are also good catalysts or photocatalysts, thus they can be used as SERS substrate for the in situ monitoring the catalytic or photocatalytic reaction process and providing the kinetic characteristic of the heterogeneous catalysis. For example, Lu, Wang and co-workers has demonstrated the fabrication of silver-coated ZnO nanowire arrays as catalyst for in situ monitoring of the degradation of organic pollutants in the presence of reducing agents.22 Recently, a ternary nancomposite of ZnO–reduced graphene oxide (rGO)–Au has been prepared, which can be employed as both SERS substrate and photocatalyst for in situ SERS determination of typical dye molecules during the photocatalytic degradation process.23On the other hand, magnetic hybrid nanomaterials have attracted extensively research interest due to their multifunction in a single nanomaterial.24,25 In particular, the integration of noble metal nanoparticles with ferromagnetic oxides in hybrids results in a new kind of nanocatalysts with magnetically recoverable properties, which can be easily recycled from the reaction system. For instance, the dumbbell-like Au@Fe3O4 heterostructures have been prepared via a thermal decomposition of iron–oleate complex using Au nanoparticles as the seeds.26 The as-prepared Au@Fe3O4 heterostructure not only exhibited a high catalytic activity for the reduction of nitrophenol, but also showed an excellent magnetically recyclable properties. In addition, bifunctional Au–Fe3O4 hybrid hollow spheres have also been synthesized through a one-pot hydrothermal reaction, displaying both good catalytic activity and efficient SERS sensitivity.27 Owing to the enrichment of target molecules through magnetism-induced aggregation, silver-coated magnetic nanoparticles have been proved to be versatile SERS substrate with a high sensitivity.28 Importantly, the integrating of Au nanoparticles with Fe3O4/C nanoparticles produces a SERS substrate with good catalytic hydrogenation property, which offers a platform for in situ SERS monitoring of the reduction of p-nitrothiophenol to p-aminothiophenol.29
Owing to the high coercive force, good saturation magnetization, and chemical stability, CoFe2O4 nanomaterial have become an alternative to Fe3O4 to support noble metal nanoparticles for catalytic applications in the past few years.30–32 In this regard, we have prepared rGO supported CoFe2O4–Pd nanoparticles via a one-pot microwave synthetic route, demonstrating a high catalytic activity as well as excellent magnetic recoverable properties.32 However, up to now, there are few reports on the fabrication of CoFe2O4 based hybrid nanomaterials as both SERS substrate and nanocatalyst for in situ monitoring of the heterogeneous catalytic reaction process. In addition, CoFe2O4 is also a p-type semiconductor with a narrow band gap (0.9 eV).33 When CoFe2O4 is combined with Ag nanoparticles, a charge transfer from CoFe2O4 to Ag nanoparticles will induce a large electromagnetic field, which improve the SERS activities.
In this work, we report a simple electrospinning combined with calcination process to prepare CoFe2O4/Ag hybrid nanotubes as SERS substrate. The synthesized CoFe2O4/Ag hybrid nanotubes show a uniform morphology and good magnetic property, thus they can be quickly aggregated in a small area in the solution to enrich target molecules and to accelerate the SERS detection rate. And the SERS activity has been significantly increased due to the electromagnetic field contributed by the strong interactions between CoFe2O4 and Ag nanoparticles in the hybrid nanotubes. Furthermore, the prepared CoFe2O4/Ag hybrid nanotubes are good catalysts for the degradation of typical organic pollutant (methylene blue, MB), which can be in situ monitored by the SERS spectra. The experimental results display that the synthesized CoFe2O4/Ag hybrid nanotubes possess high catalytic activity and the catalytic reaction follows pseudo-first-order kinetics.
Experimental
Materials
Poly(vinylpyrrolidone) (PVP, Mw = 1![[thin space (1/6-em)]](https://www.rsc.org/images/entities/char_2009.gif) 300
300![[thin space (1/6-em)]](https://www.rsc.org/images/entities/char_2009.gif) 000) and p-aminothiophenol (PATP) were purchased from Sigma-Aldrich. Fe(NO3)3·9H2O was obtained from Tianjin East China reagent factory. Co(Ac)2·4H2O and NaBH4 were purchased from Sinopharm chemical reagent Beijing Co., Ltd. AgNO3 and ethanol was bought from Beijing Chemical Works. MB was purchased from Tianjin Guangfu Fine Chemical Research Institute. N,N′-Dimethylformamide (DMF) was commercially obtained from Tianjin Tiantai Fine Chemicals Co., Ltd. All the chemicals were used as received without purification. Deionized water was used throughout the study.
000) and p-aminothiophenol (PATP) were purchased from Sigma-Aldrich. Fe(NO3)3·9H2O was obtained from Tianjin East China reagent factory. Co(Ac)2·4H2O and NaBH4 were purchased from Sinopharm chemical reagent Beijing Co., Ltd. AgNO3 and ethanol was bought from Beijing Chemical Works. MB was purchased from Tianjin Guangfu Fine Chemical Research Institute. N,N′-Dimethylformamide (DMF) was commercially obtained from Tianjin Tiantai Fine Chemicals Co., Ltd. All the chemicals were used as received without purification. Deionized water was used throughout the study.
Preparation of CoFe2O4/Ag hybrid nanotubes via an electrospinning combined with calcination process
In a typical procedure, 0.656 g of PVP was dissolved in a mixing solvent consisting of 4.56 g of ethanol and 3.12 g of DMF. Then 0.0616 g of Co(Ac)2·4H2O together with 0.20 g of Fe(NO3)3·9H2O and 0.042 g of AgNO3 was added into the above solution. The mixture was stirred for more than 12 h at room temperature to produce a homogeneous solution. The as-prepared mixing solution was electrospun under an applied high voltage of 15 kV through a high-voltage DC power supply. A piece of aluminum foil was used as a collector for collecting the nanofibers. The distance between the spin nozzle and the collector was about 20 cm. The as-prepared fibrous membrane was calcined at 550 °C in air for 3 h subsequently according to a confirmed program. Finally, CoFe2O4/Ag hybrid nanotubes membrane with a black colour were obtained. For a comparison, individual electrospun CoFe2O4 nanotubes and Ag nanomaterials have also been prepared via a similar electrospinning followed by calcination process.Catalytic measurements
In a typical procedure, 30 μL of MB solution (10−3 M) was added into 3 mL of deionized water. Then 50 μL of NaBH4 solution (30 mg mL−1) was added. After that, 100 μL of CoFe2O4/Ag hybrid nanotubes aqueous dispersions (3 mg mL−1) was added into the above solution. UV-vis spectral measurement was used to evaluate the catalytic reaction.SERS measurements
In a typical experiment, PATP was used as a Raman probe to estimate the response of the CoFe2O4/Ag hybrid nanotube substrate for SERS measurements. 20 μL of CoFe2O4/Ag hybrid nanotubes dispersions (1 mg mL−1) was mixed with 180 μL aqueous solution of PATP with a certain concentration for 5 min under sonication. After standing for about 30 min, the CoFe2O4/Ag hybrid nanotubes were separated from the solution by using an external magnet, and the precipitate was dropped onto a clean glass slide. The air dried precipitate was then analysed with a Raman spectrometer. PATP samples were prepared in aqueous solutions with concentrations of 10−5, 10−6, 10−7, 10−8, 10−9 M.SERS monitoring of the catalytic degradation of MB on the CoFe2O4/Ag hybrid nanotube
In the procedure for SERS monitoring of the catalytic degradation of MB, 0.1 mL of CoFe2O4/Ag hybrid nanotube dispersions (1 mg mL−1) was mixed with 0.9 mL of MB solution (10−5 M). Then 5 μL of 2.5 × 10⁻² M NaBH4 aqueous solution was added into 55 μL of the above mixture solution. The catalytic degradation of MB was measured by monitoring the SERS spectra of the final product at different reaction time.Characterization
The morphologies of the synthesized CoFe2O4/Ag hybrid nanotubes were characterized by field-emission scanning electron microscopy (SEM, FEI Nova NanoSEM 450) and transmission electron microscopy (TEM, JEOLJEM-1200 EX) operated at 15 and 100 kV, respectively. HRTEM imaging with Energy dispersive X-ray (EDX) and elemental mapping analysis was performed with a FEI Tecnai G2 F20 high resolution transmission electron microscope operated at a 200 kV accelerating voltage. X-ray data were collected by using an X-ray diffractometer (Empyrean, PANalytical B.V.) based on Cu-Ka radiation. Analysis of the X-ray photoelectron spectra (XPS) was performed on a thermo ESCALAB 250 spectrometer. The ultraviolet-visible (UV-vis) absorption spectroscopy was performed on a Shimadzu UV-2501 PC spectrometer. SERS spectra of PATP and the catalytic degradation of MB were measured with a Renishaw-1000 spectrometer with a He/Ne laser as excitation line of 532 nm.Results and discussion
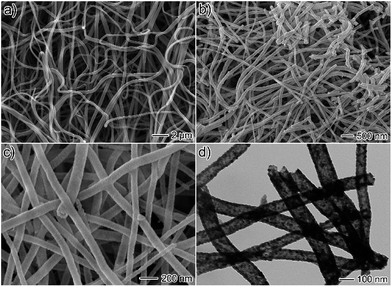
CoFe2O4/Ag hybrid nanotubes are successfully prepared through a two-step fabrication process (Fig. 1). First, electrospun PVP/Co(Ac)2/Fe(NO3)3/AgNO3 composite nanofibers membrane has been prepared via an electrospinning technique. Subsequently, the as-prepared composite nanofibers are calcined in air at 550 °C to produce CoFe2O4/Ag hybrid nanotubes. Accordingly, the color turns from white to black after the calcination, indicating the decomposition of PVP. Fig. 2a shows the SEM image of the as-electrospun PVP/Co(Ac)2/Fe(NO3)3/AgNO3 composite nanofibers. It has been obviously seen that the products are nanofibers with diameters from 100 to 400 nm. After calcination, the size of the nanofibers becomes thinner and their diameters are in the range of 50–150 nm (Fig. 2b and c). In addition, the TEM image is also used to characterize the morphology of the calcined products, revealing a hollow characteristic of the CoFe2O4/Ag hybrid nanostructures. As shown in Fig. 2d, the TEM also shows that the surface of CoFe2O4/Ag hybrid nanotubes is composed of many small nanoparticles and the thickness of the wall of the hybrid nanotubes is about 15 nm.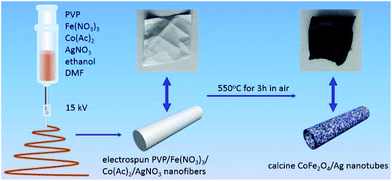 | ||
| Fig. 1 Schematic illustration of the fabrication of the CoFe2O4/Ag hybrid nanotubes through electrospinning followed by a calcination process. | ||
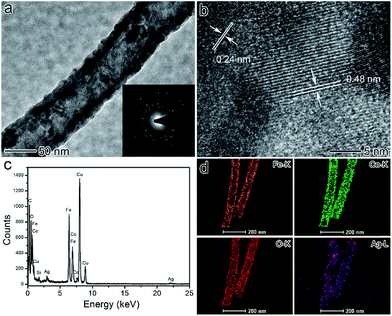
Fig. 3a shows a single CoFe2O4/Ag hybrid nanotube and the selected area electron diffraction (SAED) pattern of the product, demonstrating their high crystallinity. The size of the CoFe2O4 and Ag nanoparticles in CoFe2O4/Ag hybrid nanotubes is from several to tens of nanometers. And these nanoparticles almost inosculate as a whole shell in the CoFe2O4/Ag hybrid nanotubes. The SAED pattern of the CoFe2O4/Ag hybrid nanotubes demonstrates the existence of the crystal CoFe2O4 and Ag nanoparticles (inset in Fig. 3a). From Fig. 3b, CoFe2O4 with a lattice spacing of 0.48 nm corresponding to the (111) lattice plane of cubic CoFe2O4 with a spinel structure is clearly observed in the CoFe2O4/Ag hybrid nanotubes. In addition, Ag is well crystalized exhibiting a clear lattice with a spacing of 0.22 nm, which is attributed to the (111) lattice plane of face-centered cubic (fcc) of Ag. The as-synthesized CoFe2O4/Ag hybrid nanotubes are also characterized by energy-dispersive X-ray (EDX) spectroscopy (Fig. 3c), which displays the existence of C, O, Fe, Co, Ag, Cu, Si and no other obvious elements are observed. The Cu and Si elements originate from carbon coated copper grid and the instrument substrate, respectively. This result demonstrates the successful formation of CoFe2O4/Ag hybrid nanotubes. The elemental mapping in Fig. 3d demonstrates the direct evidence that Fe, Co, O and Ag elements are visible throughout the whole shell of hybrid nanotubes, indicating that the hybrid nanotubes are composed of CoFe2O4 and Ag nanoparticles.
FTIR spectroscopy is employed to examine the removal of PVP after the calcination. As shown in the FTIR spectrum of electrospun PVP/Co(Ac)2/Fe(NO3)3/AgNO3 hybrid nanofibers in Fig. 4a, dominant and distinct peak of PVP at 1674 cm−1 is ascribed to the C![[double bond, length as m-dash]](https://www.rsc.org/images/entities/char_e001.gif) O stretching vibration, while the peaks at 1289 and 651 cm−1 are related to the C–O–C stretching vibration, and the peak at 2923 and 1493 cm−1 can be assigned of CH2 absorption, the peak at 1374 cm−1 is due to the aliphatic CH group vibration.34 In addition, the peak at 3500 cm−1 can be attributed to the symmetric vibration of –OH group of the residue water. However, the typical bands corresponding to the PVP molecules almost disappear after calcination at 550 °C. Meanwhile, a new peak at 586 cm−1 attributed to stretching vibrations of tetrahedral complexes is clearly observed, indicating the decomposition of PVP and the formation of CoFe2O4.35 To examine the crystallographic features of the prepared CoFe2O4/Ag hybrid nanotubes, XRD is performed on the product. With regard to the CoFe2O4/Ag hybrid nanotubes, all the diffraction peaks are matched well with crystal CoFe2O4 and Ag. The typical peaks at 30.3, 35.5, 43.1, 54.4, 57.2, 62.8, and 74.1° are assigned to the (220), (311), (400), (422), (511), (440) and (533) planes of CoFe2O4 (JCPDS 22-1086). While the peaks at 38.2, 44.4, 64.5, and 77.5° are attributed to (111), (200), (220), (311) planes of face centered cubic Ag phase (JCPDS No. 04-0783) (Fig. 4b). All the diffraction peaks are sharp and intense, demonstrating the high crystallinity of the CoFe2O4 and Ag phase in the hybrid nanotubes. We have also estimated the size of Ag nanoparticles based on the Scherrer equation (Dhkl = κλ × 57.3/β
O stretching vibration, while the peaks at 1289 and 651 cm−1 are related to the C–O–C stretching vibration, and the peak at 2923 and 1493 cm−1 can be assigned of CH2 absorption, the peak at 1374 cm−1 is due to the aliphatic CH group vibration.34 In addition, the peak at 3500 cm−1 can be attributed to the symmetric vibration of –OH group of the residue water. However, the typical bands corresponding to the PVP molecules almost disappear after calcination at 550 °C. Meanwhile, a new peak at 586 cm−1 attributed to stretching vibrations of tetrahedral complexes is clearly observed, indicating the decomposition of PVP and the formation of CoFe2O4.35 To examine the crystallographic features of the prepared CoFe2O4/Ag hybrid nanotubes, XRD is performed on the product. With regard to the CoFe2O4/Ag hybrid nanotubes, all the diffraction peaks are matched well with crystal CoFe2O4 and Ag. The typical peaks at 30.3, 35.5, 43.1, 54.4, 57.2, 62.8, and 74.1° are assigned to the (220), (311), (400), (422), (511), (440) and (533) planes of CoFe2O4 (JCPDS 22-1086). While the peaks at 38.2, 44.4, 64.5, and 77.5° are attributed to (111), (200), (220), (311) planes of face centered cubic Ag phase (JCPDS No. 04-0783) (Fig. 4b). All the diffraction peaks are sharp and intense, demonstrating the high crystallinity of the CoFe2O4 and Ag phase in the hybrid nanotubes. We have also estimated the size of Ag nanoparticles based on the Scherrer equation (Dhkl = κλ × 57.3/β![[thin space (1/6-em)]](https://www.rsc.org/images/entities/char_2009.gif) cos
cos![[thin space (1/6-em)]](https://www.rsc.org/images/entities/char_2009.gif) θ), where D is the average diameter of the Ag nanoparticles, κ is the shape factor (κ = 0.89), λ is the X-ray wavelength (λ = 1.5418 Å), β is the line broadening measured as the half-height in radians, θ is the Bragg angle in degrees. From the XRD pattern of Ag in Fig. 4b, the average size of Ag nanoparticles is calculated to be about 32.4 nm.
θ), where D is the average diameter of the Ag nanoparticles, κ is the shape factor (κ = 0.89), λ is the X-ray wavelength (λ = 1.5418 Å), β is the line broadening measured as the half-height in radians, θ is the Bragg angle in degrees. From the XRD pattern of Ag in Fig. 4b, the average size of Ag nanoparticles is calculated to be about 32.4 nm.
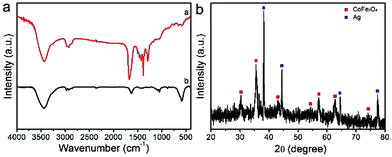 | ||
| Fig. 4 (a) FTIR spectra of the electrospun PVP/Co(Ac)2/Fe(NO3)3/AgNO3 composite nanofibers and the calcined CoFe2O4/Ag hybrid nanotubes; (b) XRD pattern of the prepared CoFe2O4/Ag hybrid nanotubes. | ||
Further information on the chemical composition and valence state of CoFe2O4/Ag hybrid nanotube are also attained by the X-ray photoelectron spectroscopy (XPS) measurement. The survey spectrum clearly displays C, O, Fe, Co, and Ag elements in the CoFe2O4/Ag hybrid nanotube product (Fig. 5a), which is in agreement with the EDX results. The XPS spectrum of Ag element shows two distinct binding energies at 368.4 and 374.4 eV, which are ascribed to the signals for Ag 3d5/2 and Ag 3d3/2, suggesting the formation of metallic Ag (Fig. 5b).36 From Fig. 5c, it can be seen that four predominant peaks are observed, which of the first two peaks at around 781.3 and 796.7 eV are assigned to Co 2p3/2 and Co 2p1/2, and the peaks with higher binding energies at about 787.3 and 805.2 eV are attributed to the shake-up satellites.37 In Fe 2p XPS spectrum in Fig. 5d, we can effortlessly observe two characteristic peaks of Fe 2p3/2 and Fe 2p1/2 at around 711.8 and 725.3 eV.37 In addition, there are two types of oxygen species in the XPS spectrum of CoFe2O4/Ag hybrid nanotubes (Fig. 5e). The fitting band with a binding energy at around 530.2 eV is related to the lattice oxygen, and the fitting peak at 532.2 eV belongs to hydroxyl group, indicating that the surface of CoFe2O4/Ag hybrid nanotubes is hydroxylated to some extent.37
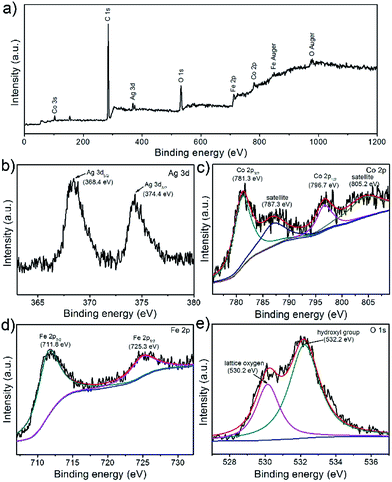 | ||
| Fig. 5 XPS spectra of the prepared CoFe2O4/Ag hybrid nanotubes: (a) full survey; (b) Ag 3d; (c) Co 2p; (d) Fe 2p; (e) O 1s. | ||
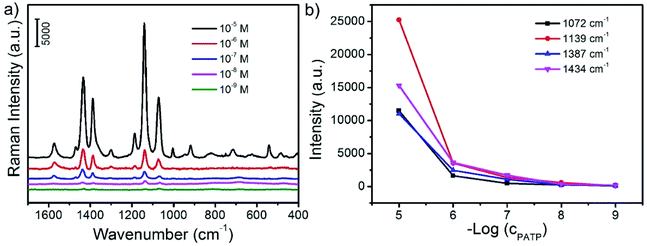
It is highly desirable for the rapid and sensitive detection and analysis of some small organic molecules for biotechnology and environment science. Among a large variety of strategies for quantitative analysis of organic molecules, SERS is a great powerful and sensitive spectroscopic technique to characterize the chemical structure of the adsorbed target molecules. In this study, PATP is employed as a model probe molecule which is adsorbed on the surface of CoFe2O4/Ag hybrid nanotubes. As shown in Fig. 6, PATP molecules can adsorb on the surface of CoFe2O4/Ag hybrid nanotubes in aqueous solution. Then after the magnetic enrichment, PATP adsorbed CoFe2O4/Ag hybrid nanotubes is collected for SERS measurement. Fig. 6a shows the SERS spectra of PATP molecules with varied concentrations from 10−5 to 10−9 M on the surface of CoFe2O4/Ag hybrid nanotubes. It is found that strong Raman bands is observed when the concentration of PATP is 10−5 M. The characteristic peaks at 1574 and 1072 cm−1 can be attributed to the a1 modes of PATP, and the first peak is due to the C–C stretching, while the other peak is related to the C–S stretching mode.36 These two peaks is shifting to lower wavenumbers compared to the Raman spectrum of PATP molecules, which should be due to the strong interactions between PATP molecules and the CoFe2O4/Ag hybrid nanotubes substrate.36 On the other hand, some other predominant bands at 1434, 1387, 1186, 1139 cm−1 have also been clearly observed. These bands ascribed to b2 symmetry of PATP molecules exhibit strong resonance enhancement owing to the charge transfer.36,38 It is also found that all the SERS bands of PATP molecules are strongly dependent on their concentrations. As shown in Fig. 6b, the SERS intensities of the typical a1 and b2 bands of PATP molecules decrease with the decreasing of their concentrations. However, the characteristic bands of PATP molecules can still be distinguished with a concentration down to 10−9 M, demonstrating the high SERS sensitivity of CoFe2O4/Ag hybrid nanotubes. The excellent SERS properties may be owing to the large electromagnetic field induced by the charge transfer from CoFe2O4 to Ag nanoparticles. It is well known that the detection limit is very important for the SERS substrate, thus we have compared the detection limit of the as-prepared CoFe2O4/Ag hybrid SERS substrate with the previous reports. It is found that the detection limit of this work is lower or comparable with most of the previous reported SERS substrates, such as Pd nanospheres,39 Ag nanoparticles,40 Au nanoparticles-functionalized monolithic columns,41 SiO2-isolated Ag islands,42 nanoporous Ag microstructure,43 Ag nanotriangles-loaded filter paper,44 Ag@carbon dots hybrid,45 three-dimensional Ag nanoparticles decorated plasmonic paper,46 Au-coated MnFe2O4 magnetic nanoparticles,47 demonstrating an efficient SERS property of the as-prepared CoFe2O4/Ag hybrid nanotubes (Table 1).
| SERS substrate | Limit of detection (M) | References |
|---|---|---|
| Pd nanosphere | 10−6 | 39 |
| Ag nanoparticles | 10−7 | 40 |
| Au nanoparticles-functionalized monolithic columns | 10−7 | 41 |
| SiO2-isolated Ag islands | 10−8 | 42 |
| Nanoporous Ag microstructure | 10−8 | 43 |
| Ag nanotriangles-loaded filter paper | 10−8 | 44 |
| Ag@carbon dots hybrid | 10−8 | 45 |
| Three-dimensional silver nanoparticles decorated plasmonic paper | 10−9 | 46 |
| Au-coated MnFe2O4 magnetic nanoparticles | 10−9 | 47 |
| Electrospun CoFe2O4/Ag hybrid nanofibers | 10−9 | This work |
The finite difference time domain (FDTD) has been performed to elucidate the mechanism of the SERS enhancement on CoFe2O4/Ag hybrid SERS substrate. As shown in Fig. 7a and b, the higher field enhancement is localized at the gap between CoFe2O4 and Ag components in the hybrid nanotubes. In general, when semiconducting CoFe2O4 are combined with Ag nanoparticles, a charge transfer from CoFe2O4 to Ag nanoparticles usually takes place due to their different work functions. Thus an electromagnetic field will be generated at the gap between CoFe2O4 and Ag surface, resulting in a SERS enhancement. This result has been proved by the FDTD results.
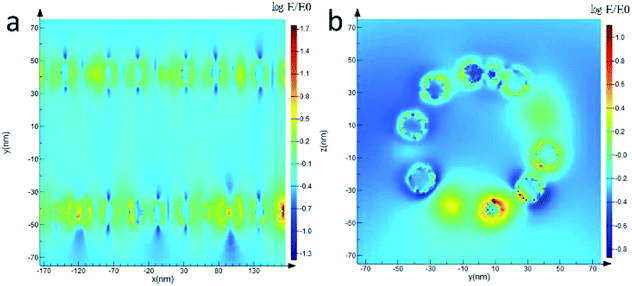 | ||
| Fig. 7 The distribution of the electric field for CoFe2O4/Ag hybrid nanotube substrate calculated with FDTD simulation. (a) Longitudinal section, (b) cross section. | ||
The synthesized CoFe2O4/Ag hybrid nanotubes are not only an efficient SERS substrate, but also a good catalyst for the degradation of organic pollutant. In this work, we have studied the catalytic activity of the prepared CoFe2O4/Ag hybrid nanotubes by employing the degradation of MB in the presence of excess amount of NaBH4. The degradation process can be monitored by the UV-vis absorption spectra. As shown in Fig. S1a,† the MB aqueous solution exhibits an obvious absorption peak at around 662 nm, while the intensity of this peak become weaker and weaker after the addition of CoFe2O4/Ag hybrid nanotubes and almost disappears in 5 min. This result indicates that the prepared CoFe2O4/Ag hybrid nanotubes are good catalyst toward the degradation of MB by NaBH4. From Fig. S1b,† the rate constant k can be calculated from the rate equation and the value is 0.396 min−1. We have also compared the catalytic activity of the CoFe2O4/Ag hybrid nanotubes with that of individual CoFe2O4 nanotubes and electrospun Ag nanomaterials. It is found that individual CoFe2O4 nanotubes and electrospun Ag nanomaterials almost do not show catalytic activity for the degradation of MB in the presence of NaBH4 (Fig. S2†). This result demonstrates the synergistic effect between CoFe2O4 and Ag components in the hybrid nanotubes for the degradation of MB.
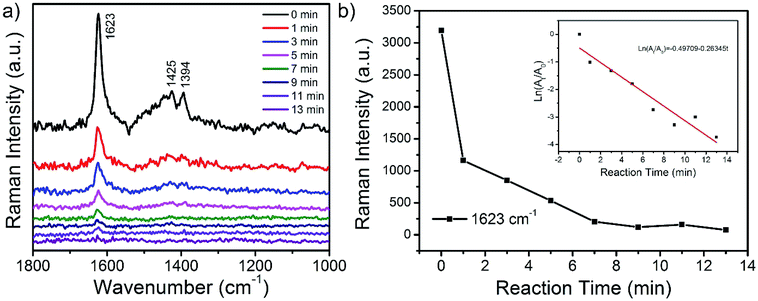
Due to the ability of dual applications as both catalyst and SERS substrate of the prepared CoFe2O4/Ag hybrid nanotubes, an in situ SERS monitoring of the catalytic degradation of MB has been developed. SERS monitoring of the degradation of MB is performed in a liquid system in the presence of NaBH4 using a 532 nm laser excitation, and the SERS signals are directly collected from the surface of CoFe2O4/Ag hybrid nanotubes. Fig. 8a shows the SERS spectra of the MB molecules in the presence of NaBH4 by using CoFe2O4/Ag hybrid nanotubes as SERS substrate and catalyst at different time intervals. It is evident that three predominant bands at 1623, 1425, and 1394 cm−1 appear in the SERS spectrum of MB before the addition of NaBH4 in the solution system. These typical bands can be assigned to C–C ring stretching, C–N stretching and N–C–H in-plane bending vibrations.48 During the catalytic reaction process in the presence of NaBH4, the SERS intensity of the typical bands of MB molecules gradually decreases with increasing time and the characteristic peaks of MB almost disappear in 13 min, revealing the degradation of MB molecules on the surface of CoFe2O4/Ag hybrid nanotubes. The degradation of MB by CoFe2O4/Ag hybrid nanotubes may be explained by a Langmuir–Hinshelwood model. Firstly, MB was adsorbed on the surface of CoFe2O4/Ag hybrid nanotubes. Then NaBH4 donates electrons to Ag in CoFe2O4/Ag hybrid nanotubes. Finally, the electrons transfer from Ag nanoparticles to MB, leading to the reduction of MB on the surface of CoFe2O4/Ag hybrid nanotubes. The catalytic reaction kinetics of the degradation of MB is also studied. Fig. 8b shows the relationship between ln(At/A0) and the reaction time for the degradation of MB catalyzed by CoFe2O4/Ag hybrid nanotubes, wherein At and A0 stand for the SERS intensities at 1623 cm−1 at time t and 0, respectively. Accordingly, the inset of Fig. 8b exhibits a good linear relationship between logarithmic integrated intensity and reaction time, and the rate law can be expressed as a fitting equation of ln(At/A0) = −0.49709–0.26345t. Based on the fitting equation, it can be concluded that the kinetics of the catalytic degradation of MB follows the pseudo-first order reaction. The catalytic reaction rate constant is calculated to be about 0.26 min−1.
Conclusions
In summary, we have prepared a magnetic CoFe2O4/Ag hybrid nanotube as SERS substrate via an electrospinning followed by a calcination process. The unique heterostructure and magnetic enrichment of target molecules contribute a large SERS enhancement on this substrate. The CoFe2O4/Ag hybrid nanotubes are also good catalysts for the degradation of organic pollutants. By combining the catalytic and SERS properties of the CoFe2O4/Ag hybrid nanotubes towards the degradation of MB, a simple approach for the in situ monitoring of the catalytic reaction and its kinetics using SERS technique has been developed. Owing to the unique SERS properties and excellent catalytic activity, the as-prepared CoFe2O4/Ag hybrid nanotubes show great promising potential applications in the fields of catalysis, biosensing and environmental monitoring.Conflicts of interest
There are no conflicts to declare.Acknowledgements
This work was supported by the research grants from the National Natural Science Foundation of China (21473068, 51473065, 21327803), Jilin Science and Technology Department Project (20150101034JC) and the Natural Science Foundation of Heilongjiang Province (B201317). We thank Prof. Shuping Xu and Mr Yu Tian for their help with the FDTD simulation.Notes and references
- S. Lal, N. K. Grady, J. Kundu, C. S. Levin, J. B. Lassiter and N. J. Halas, Chem. Soc. Rev., 2008, 37, 898–911 RSC.
- L. Tong, T. Zhu and Z. Liu, Chem. Soc. Rev., 2011, 40, 1296–1304 RSC.
- X. M. Qian and S. M. Nie, Chem. Soc. Rev., 2008, 37, 912–920 RSC.
- K. Kneipp, M. Moskovits and H. Kneipp, Surface-Enhanced Raman Scattering-Physics and Applications, Springer, Heidelberg and Berlin, 2006 Search PubMed.
- E. Le Ru and P. Etchegoin, Principles of Surface-Enhanced Raman Spectroscopy and Related Plasmonic Effects, Elsevier, Amsterdam, 2009 Search PubMed.
- Y. Ozaki, K. Kneipp and R. Aroca, Frontiers of Surface-Enhanced Raman Scattering: Single Nanoparticles and Single Cells, John Wiley & Sons, Inc., 2014 Search PubMed.
- L. Guerrini and D. Graham, Chem. Soc. Rev., 2012, 41, 7085–7107 RSC.
- B. Sharma, R. R. Frontiera, A. I. Henry, E. Ringe and R. P. VanDuyne, Mater. Today, 2012, 15, 16–25 CrossRef CAS.
- D. Y. Wu, J. F. Li, B. Ren and Z. Q. Tian, Chem. Soc. Rev., 2008, 37, 1025–1041 RSC.
- S. E. J. Bell and N. M. S. Sirimuthu, Chem. Soc. Rev., 2008, 37, 1012–1024 RSC.
- H. Y. Liang, Z. P. Li, W. Z. Wang, Y. S. Wu and H. X. Xu, Adv. Mater., 2009, 21, 4614–4618 CrossRef CAS.
- Y. Lu, G. L. Liu and L. P. Lee, Nano Lett., 2005, 5, 5–9 CrossRef CAS PubMed.
- M. V. Canamares, J. V. Garcia-Ramos, J. D. Gomez-Varga, C. Domingo and S. Sanchez-Cortes, Langmuir, 2005, 21, 8546–8553 CrossRef CAS PubMed.
- X. X. Han, W. Ji, B. Zhao and Y. Ozaki, Nanoscale, 2017, 9, 4847–4861 RSC.
- D. Maznichenko, K. Venkatakrishnan and B. Tan, J. Phys. Chem. C, 2013, 117, 578–583 CAS.
- W. Li, R. Zamani, P. Rivera Gil, B. Pelaz, M. Ibáñez, D. Cadavid, A. Shavel, R. A. Alvarez-Puebla, W. J. Parak, J. Arbiol and A. Cabot, J. Am. Chem. Soc., 2013, 135, 7098–7101 CrossRef CAS PubMed.
- X. Li, G. Chen, L. Yang, Z. Jin and J. Liu, Adv. Funct. Mater., 2010, 20, 2815–2824 CrossRef CAS.
- W. Song, Y. X. Wang and B. Zhao, J. Phys. Chem. C, 2007, 111, 12786–12791 CAS.
- W. Wang, Z. Y. Feng, W. Jiang and J. H. Zhan, CrystEngComm, 2013, 15, 1339–1344 RSC.
- X. He, C. Yue, Y. Zang, J. Yin, S. Sun, J. Li and J. Kang, J. Mater. Chem. A, 2013, 1, 15010–15015 CAS.
- Q. Zhou, G. Meng, Q. Huang, C. Zhu, H. Tang, Y. Qian, B. Chen and B. Chen, Phys. Chem. Chem. Phys., 2014, 16, 3686–3692 RSC.
- X. M. Zhao, B. H. Zhang, K. L. Ai, G. Zhang, L. Y. Cao, X. J. Liu, H. M. Sun, H. S. Wang and L. H. Lu, J. Mater. Chem., 2009, 19, 5547–5553 RSC.
- C. Y. Wen, F. Liao, S. S. Liu, Y. Zhao, Z. H. Kang, X. L. Zhang and M. W. Shao, Chem. Commun., 2013, 49, 3049–3051 RSC.
- D. Wang and D. Astruc, Chem. Rev., 2014, 114, 6949–6985 CrossRef CAS PubMed.
- V. Polshettiwar, R. Luque, A. Fihri, H. B. Zhu, M. Bouhrara and J. M. Basset, Chem. Rev., 2011, 111, 3036–3075 CrossRef CAS PubMed.
- F. H. Lin and R. A. Doong, J. Phys. Chem. C, 2011, 115, 6591–6598 CAS.
- Q. Gao, A. W. Zhao, H. Y. Guo, X. C. Chen, Z. B. Gan, W. Y. Tao, M. F. Zhang, R. Wu and Z. X. Li, Dalton Trans., 2014, 43, 7998–8006 RSC.
- Y. F. Pang, R. Xiao and S. Q. Wang, Colloids Surf., A, 2016, 506, 393–401 CrossRef.
- W. Y. Cai, X. H. Tang, B. Sun and L. B. Yang, Nanoscale, 2014, 6, 7954–7958 RSC.
- G. Hu, J. H. Choi, C. B. Eom, V. G. Harris and Y. Suzuki, Phys. Rev. B: Condens. Matter, 2000, 62, R779–R782 CrossRef CAS.
- W. N. Sun, X. F. Lu, Y. P. Xue, Y. Tong and C. Wang, Macromol. Mater. Eng., 2014, 299, 361–367 CrossRef CAS.
- X. F. Lu, L. Yang, X. J. Bian, D. M. Chao and C. Wang, Part. Part. Syst. Charact., 2014, 31, 245–251 CrossRef CAS.
- A. V. Ramos, M. J. Guittet, J. B. Moussy, R. Mattana, C. Deranlot, F. Petroff and C. Gatel, Appl. Phys. Lett., 2007, 91, 122107 CrossRef.
- P. J. Yao, J. Wang, Q. Qiao and H. Y. Du, J. Mater. Sci., 2015, 50, 1338–1349 CrossRef CAS.
- M. P. Reddy, A. M. A. Mohamed, X. B. Zhou, S. Du and Q. Huang, J. Magn. Magn. Mater., 2015, 388, 40–44 CrossRef CAS.
- W. Song, W. Ji, S. Vantasin, I. Tanabe, B. Zhao and Y. Ozaki, J. Mater. Chem. A, 2015, 3, 13556–13562 CAS.
- Z. Z. Yang, Z. Zhang, Y. Z. Jiang, M. Q. Chi, G. D. Nie, X. F. Lu and C. Wang, RSC Adv., 2016, 6, 33636–33642 RSC.
- Z. Mao, W. Song, X. X. Xue, W. Ji, Z. S. Li, L. Chen, H. J. Mao, H. M. Lv, X. Wang, J. R. Lombardi and B. Zhao, J. Phys. Chem. C, 2012, 116, 14701–14710 CAS.
- L. M. Wang, L. H. Wang, E. Z. Tan, L. Guo and X. D. Han, Nanotechnology, 2011, 22, 305712 CrossRef PubMed.
- T. H. D. Nguyen, P. Zhou, A. Mustapha and M. Lin, Analyst, 2016, 141, 5382–5389 RSC.
- Q. Jiang, T. Zeng, S. Yang, Q. Chen, L. Chen, Y. Ye, J. Zhou and S. P. Xu, Spectrochim. Acta, Part A, 2015, 141, 244–251 CrossRef CAS PubMed.
- Y. X. Wang, X. Y. Zhao, L. Chen, S. Chen, M. B. Wei, M. Gao, Y. Zhao, C. Wang, X. Qu, Y. J. Zhang and J. H. Yang, Langmuir, 2014, 30, 15285–15291 CrossRef CAS PubMed.
- K. WOngravee, H. Gatemala, C. Thammacharoen, S. Ekgasit, S. Vantasin, I. Tanabe and Y. Ozaki, RSC Adv., 2015, 5, 1391–1397 RSC.
- C. Wang, B. Liu and X. Dou, Sens. Actuators, B, 2016, 231, 357–364 CrossRef CAS.
- J. Jin, S. Zhu, Y. Song, H. Zhao, Z. Zhang, Y. Guo, J. Li, W. Song, B. Yang and B. Zhao, ACS Appl. Mater. Interfaces, 2016, 8, 27956–27965 CAS.
- Y. X. Li, K. Zhang, J. J. Zhao, J. Ji, C. Ji and B. H. Liu, Talanta, 2016, 147, 493–500 CrossRef CAS PubMed.
- J. F. Wang, X. Z. Wu, C. W. Wang, Z. Rong, H. M. Ding, H. Li, S. H. Li, N. S. Shao, P. T. Dong, R. Xiao and S. Q. Wang, ACS Appl. Mater. Interfaces, 2016, 8, 19958–19967 CAS.
- S. Dutta Roy, M. Ghosh and J. Chowdhury, J. Raman Spectrosc., 2015, 46, 451–461 CrossRef CAS.
Footnote |
| † Electronic supplementary information (ESI) available. See DOI: 10.1039/c7ra07786f |
| This journal is © The Royal Society of Chemistry 2017 |

