DOI:
10.1039/C7RA07741F
(Paper)
RSC Adv., 2017,
7, 49759-49768
Fluoride doped SrTiO3/TiO2 nanotube arrays with a double layer walled structure for enhanced photocatalytic properties and bioactivity†
Received
14th July 2017
, Accepted 20th October 2017
First published on 25th October 2017
Abstract
Anodized TiO2 nanotube arrays have important applications in the area of photocatalysis and biomedicine. In this study, with the aim of improving the photocatalytic and biomedical properties of TiO2 nanotube arrays, we prepared both single and double layer walled TiO2 nanotube arrays and subjected them to hydrothermal treatment in strontium acetate solution. It was found that fluoride doped SrTiO3/TiO2 nanotube arrays could be formed after hydrothermal treatment without the failure of the single and double layer walled structure. In the case of fluoride doped SrTiO3/TiO2 nanotube arrays with a double layer walled structure, doping of fluoride induced a visible light response, formation of SrTiO3 benefited the separation of photogenerated electron–hole pairs, and the double layer walled structure led to an enlarged surface area. Due to the synergetic effect of above three factors, the fluoride doped double layer walled SrTiO3/TiO2 nanotube arrays demonstrated the highest photocatalytic activity under ultraviolet, visible and simulated solar light irradiation. The degradation rates of methylene blue solution are 0.13 h−1, 0.26 h−1 and 0.53 h−1 respectively. Moreover, ability to induce hydroxylapatite formation on the surface was also examined through an immersing test in simulated body fluid. The results indicated that SrTiO3, doped fluoride and a double layer walled structure could stimulate the hydroxylapatite formation by providing a larger number of hydroxyl ions, hydroxyl radicals and reactive initiation sites, thus the fluoride doped double layer walled SrTiO3/TiO2 nanotube arrays also exhibited the best ability to form hydroxylapatite on the surface.
1. Introduction
Since the breakthrough work of preparing TiO2 nanotube arrays through anodization of titanium foil in fluoride containing solution by Zwilling et al., the anodized TiO2 nanotube arrays have attracted immense attention for functional applications in areas of dye sensitized solar cells, gas sensors, photocatalysis, biomedicine, ion insertion batteries, electrochromics etc.1–5 A particular advantage of anodized TiO2 nanotube arrays is that the nanotubes are fabricated from titanium metal without an immobilization process, the tubes can thus be straightforwardly used as a back contacted oxide electrode and surface coating material.6,7 It has been reported that classic quantum size effects on the electronic properties of TiO2 nanotube arrays is more significant than that for nanoparticulated TiO2 film, and therefore the electron scattering is reduced for anodized TiO2 nanotube arrays.8 Moreover, specific surface area of TiO2 nanotube arrays is relatively high for the one-dimensional nanotubular structure. These characters are scientifically exciting for the applications of solar cells, photocatalysis and biomedicine. However, many properties (e.g. photoelectric conversion efficiency, thermal stability, hydroxylapatite formation ability) of TiO2 nanotube arrays are intricately influenced by a number of geometric and compositional parameters (such as length, diameter).9 TiO2 nanotube arrays still suffer the intrinsic deficits of TiO2, that are the poor visible light utilization efficiency as well as the high recombination rate of photogenerated electron–hole pairs.10 Specific surface area of anodized TiO2 nanotube arrays remain considerably lower than that of TiO2 nanoparticles.11 In this context, the aforementioned applications of TiO2 nanotube arrays still have the potential to be enhanced via devoting more comprehensive and consistent research work. For example, following the alkali treatments in NaOH solution, enhanced formation of hydroxylapatite has been achieved.12 Wang et al. prepared bamboo type TiO2 nanotube arrays by anodization under alternating voltage condition, and achieved higher efficiency solar cells for higher specific surface area.13 Numerous efforts have also been made to address this issue through geometry optimizing, metal or non-metal ion doping, noble metal loading and hetero-coupling.14–17
It is widely known that perovskite-type titanates, such as lead titanate (PbTiO3), barium titanate (BaTiO3), strotinum titanate (SrTiO3) and lead-zirconium titanate (PbZrTiO3), have shown great potential applications in nanoscale electronics, photocatalytic and biomedical industry due to their inherent physical and chemical properties such as piezoelectricity, ferroelectricity, photoelectricity and good biocompatibility.18–20 Therefore, researchers have also focused many interests and attempts to convert TiO2 nanotube arrays to perovskite-type titanate nanotube arrays for enhanced applications. In term of perovskite-type titanates, strontium titanate (SrTiO3) has attracted many attention because of its similar band gap of 3.2 eV and more negative conductive band edge compared to TiO2.21 Through the coupling of SrTiO3, the Fermi level of TiO2 can shift to more negative potential, and the separation of photogenerated electron and hole pairs can be improved for higher photocatalytic performance. For instance, by means of hydrothermal treatment, TiO2 nanotube arrays have been converted into hetero-junction SrTiO3/TiO2 nanotube arrays, and it was found that the photocatalytic activity of SrTiO3/TiO2 nanotube arrays increased and depended on the hydrothermal reaction time.22 Moreover, strontium is effective in reducing the incident of fractures in osteoporotic patients, and SrTiO3 has also been reported to hold excellent stability and biocompatibility.23 Zhang et al. prepared the hetero-junction SrTiO3/TiO2 nanotube arrays by hydrothermal treatment of TiO2 nanotube arrays and obtained improved bioactivity for the hydroxylapatite formation.24 Li et al. further found that SrTiO3/TiO2 nanotube arrays can stimulate the secretion of cell filopodia, leading to enhanced cell proliferation.25 Considering above, coupling of SrTiO3 is benefit for obtaining improved photocatalytic and biomedical properties of anodized TiO2 nanotube arrays.
Recently, advanced double layer walled structure has been obtained under specific anodization conditions for TiO2 nanotube arrays.26,27 The double layer walled morphology occurs likely as a tube in tube structure. In this case, the porosity of tube wall could be induced, and a higher specific surface area and enhanced photocatalytic activities have been obtained.28 This suggests that double layer walled structure also provides a highly vivid picture for aim of enhancing many properties of TiO2 nanotube arrays. However, to the best of our knowledge, conversion of double layer walled TiO2 nanotube arrays into perovskite-type titanate nanotubes by hydrothermal treatment has not yet been conducted. The evolutions in morphology, composition, photocatalytic activity and bioactivity of nanotube arrays after hydrothermal treatment are not clear. This has inspired us with the means to conduct detailed research on the preparation, chemical composition and property of double layer walled hetero-junction SrTiO3/TiO2 nanotube arrays. Therefore, in the present work, we reported for the first time the production of double layer walled hetero-junction SrTiO3/TiO2 nanotube arrays via hydrothermal treatment of double layer walled TiO2 nanotube arrays in strontium acetate solution. The fluoride doped single and double layer walled SrTiO3/TiO2 nanotube arrays have been achieved and detailedly characterized. When used as photocatalytic and biomedical materials, it exhibited improved organic pollutant degradation and hydroxylapatite formation abilities. The detailed mechanism for the improvement was also investigated and discussed by comparing with other as prepared samples of single-layer walled SrTiO3/TiO2 nanotube array, single and double layer walled TiO2 nanotube arrays. Our results represented a promising vista of producing other advanced perovskite-type titanate nanotube arrays for a diversity of applications.
2. Experimental
2.1 Materials and chemicals
The titanium foil used in this work was purchased from Alfa Aesar (0.25 mm thickness; 99.5% purity). Acetone, ethanol, sulfuric acid, hydrogen peroxide, nitric acid, ammonia fluoride, ethylene glycol and glycerol were all analytical purity and purchased from Sinopharm Chemical Reagent Co., Ltd. Methylene blue (MB), strontium acetate and sodium hydroxide of analytical purity were purchased from Aladdin Reagent. The simulated body fluid (SBF) was purchased from Beijing Leagene Biotech. Co., Ltd.
2.2 Synthetic procedures
Preparation of double and single layer walled TiO2 nanotube arrays. The titanium foil was firstly cut into sizes of 10 × 20 mm, then ultrasonic washed for about 5 min in acetone, ethanol, and purified water successively. A two electrodes system with anode electrode of titanium foil and cathode electrode of platinum foil was used for the anodization experiment. Firstly, the anodization was carried out in the electrolyte containing 57.7 g ethylene glycol, 1.8 g purified water and 0.3 g ammonia fluoride. Anodization voltage was 50 V, time was 1 h. After the first step, the obtained samples were washed with ethanol for several times, then ultrasonic treatment in purified water for about 3 min to remove the as-anodized oxide film, and titanium foils with mirror-like surface were obtained. Secondly, the titanium foil with mirror like surface was anodized again under 60 V for 1.5 h in the solution which consists of 57.9 g glycerol, 1.8 g purified water and 0.3 g ammonia fluoride. The second anodized samples were washed with ethanol for several times, dried under ambient condition. Finally, the double layer walled TiO2 nanotube arrays were obtained. The single layer walled TiO2 nanotube arrays were obtained by chemical etching of double layer walled TiO2 nanotube arrays. Firstly, the double layer walled TiO2 nanotube arrays were kept under 150 °C for 1 h. Afterwards, the samples were dipped into piranha solution (H2SO4![[thin space (1/6-em)]](https://www.rsc.org/images/entities/char_2009.gif) :
:![[thin space (1/6-em)]](https://www.rsc.org/images/entities/char_2009.gif) H2O2 = 3
H2O2 = 3![[thin space (1/6-em)]](https://www.rsc.org/images/entities/char_2009.gif) :
:![[thin space (1/6-em)]](https://www.rsc.org/images/entities/char_2009.gif) 1, volume ratio) for 330 s at 70 °C, then washed with purified water and dried under ambient air condition.
1, volume ratio) for 330 s at 70 °C, then washed with purified water and dried under ambient air condition.
Preparation of hetero-junction SrTiO3/TiO2 nanotube arrays. The above as anodized TiO2 nanotube arrays were utilized for the preparation of SrTiO3/TiO2 nanotube arrays through hydrothermal treatment in sodium hydroxide solution (pH = 12) with 0.04 mol L−1 strontium acetate inside. The solution was filled into a Teflon lined stainless autoclave (80% of total volume of 40 mL) with TiO2 nanotube arrays at the bottom facing upside. Then the autoclave was sealed and heated at 200 °C for 2 h. After hydrothermal treatment, the samples were washed with nitric acid (0.1 mol L−1) and purified water, and then dried under ambient air condition.
2.3 Photocatalytic activity and bioactivity test
Before photocatalytic activity and bioactivity test, the obtained samples were annealed at 450 °C in dry air for 3 h with rate of 5 °C min−1 during heating and cooling process. The as annealed samples were denoted as STNT for single layer walled TiO2 nanotube arrays, DTNT for double layer walled TiO2 nanotube arrays, SSTNT for single layer walled SrTiO3/TiO2 nanotube arrays, and DSTNT for double layer walled SrTiO3/TiO2 nanotube arrays respectively. For the photocatalytic test, samples of 1 cm2 reaction area were put into a quartz cell containing 4 mL MB solution with concentration of 1 mg L−1. A 500 W Xenon lamp was employed as light source. The light was passed through glass filters of QD254, UVCUT420 and AM1.5 for achieving ultraviolet, visible and simulated solar light irradiation. The light intensities of ultraviolet, visible and simulated solar light are 1.1, 9.3, 25.8 mW cm−2 respectively. The absorbance of MB solution was measured every 30 min for 3 h with a UV-vis spectrometer (UV-2550). The absorption maximum of spectra showed a peak at 664 nm whose density was measured for the calculation of degradation rate of MB solution. For the bioactivity test on the hydroxylapatite formation ability of samples, each sample was immersed in a Teflon vial containing 30 mL of SBF solution and was kept under static conditions at 36.5 °C. The SBF solution was refreshed every two days. After immersion for total of 18 days, the samples were removed from the Teflon vial, rinsed with purified water and dried under ambient air condition.
2.4 Characterization
The crystal structure of samples were examined by X-ray diffractiometer (XRD, DX2700B) at a scan rate of 0.06° s−1. The surface and lateral morphologies of the samples were observed using a scanning electron microscope (SEM, JSM-7001F). Transmission electron microscopy (TEM, JEM-2100F) equipped with an energy dispersive X-ray spectrometer (EDX) operating at 200 KV was employed to observe the microstructure and elemental compositions of the samples. X-ray photoelectron spectroscopy experiments were performed on the sample using a thermo scientific ESCALAB 250Xi XPS system using Al anode. The optical characterization of the films was conducted using a UV-vis spectrometer (UV-2550). The photocurrent spectra of the samples were studied on CHI660D electrochemical workstation in 0.1 mol L−1 Na2SO4 solution using a three electrode configuration with the nanotube arrays as photoanodes (illumination area = 1 cm2), saturated Ag/AgCl as the reference electrode, and platinum foil as the counter electrode. The applied potential is 0.3 V (vs. Ag/AgCl). The light source was a 500 W Xenon lamp equipped with an AM1.5 filter. The dye loading measurements were carried out by immersing the samples in a 6 mM solution of Ru-based dye (cis-bis(isothiocyanato)bis(2,2-bipyridyl-4,4-dicarboxylato)ruthenium(II)bis(tetrabutylammonium)) at 40 °C for 24 h. After immersion, the samples were rinsed with ethanol and the soaked in an aqueous solution of 5 mL KOH (10 mM) for 30 min. The concentration of desorbed dye was measured by using UV-vis spectrometer (UV-2550) at λ = 502 nm. BET specific surface area measurements were carried out on a basis of N2 adsorption by using an ASAP2020C surface area and porosity analyser.
3. Results and discussion
Fig. 1 shows the surface and lateral SEM images of as-anodized TiO2 nanotube arrays with and without the hydrothermal treatment after annealing at 450 °C for 3 hours. Obviously, the samples demonstrated highly-ordered nanotubular structure both before and after hydrothermal treatment (Fig. 1a and c). With hydrothermal treatment, nanotubes showed average outer diameter of around 160 nm, which is similar to that of nanotubes without hydrothermal treatment (Fig. 1b and d). This indicates that the integrated nanotube arrays have been preserved well during hydrothermal reactions. Generally, the as-anodized TiO2 nanotube arrays are not stable during hydrothermal process, and can easily be converted to anatase TiO2 nanoparticles following the reactions below:29
| TiOx + 4H2O + (1 − x/2)O2 → Ti(OH)62− + 2H+ (1 < x < 2) |
| Ti(OH)62− + 2H+ → TiO2↓ + H2O |
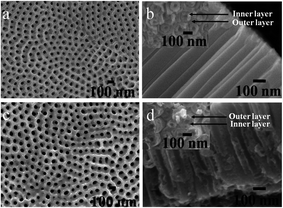 |
| | Fig. 1 SEM images of (a, b) as-anodized TiO2 nanotube arrays (DTNT) and (c, d) SrTiO3/TiO2 nanotube arrays (DSTNT) with double layer walled structure. | |
Clearly, the growth of anatase TiO2 nanoparticles is strongly affected by the concentration of H+. Herein, since the pH value of solution is high (pH = 12), the formation of anatase TiO2 from Ti(OH)62− is prevented, thus the tubular structure is retained. Despite this, it is observable that tube wall thickness increased after hydrothermal treatment (Fig. 1a and c). This could be caused by the incorporation of strontium ions into nanotube which might induce volume expansion of nanotube. Though the nanotube arrays appear smooth on the surface and lateral images (Fig. 1a–c), closer observation on the microstructure from nanotube bottom disclosed that the tube wall contained two layers of outer and inner layers inside (inset images in Fig. 1b and d). During anodization process, the relatively high anodization voltage can cause the decomposition of glycerol, produce glyceric, glycolaldehyde and glycolic acid etc., which may react with Ti4+ at the oxide/electrolyte interface, and finally form the double layer walled structure.30,31 Notably, as shown in Fig. 1d, the double layer walled structure was also maintained well after hydrothermal treatment. Therefore, through anodization, well organized double layer walled TiO2 nanotube arrays have been obtained, the double layer walled nanotubular structure remained almost unchanged after hydrothermal treatment in strontium acetate containing solution with pH value of 12.
The inner wall, which is formed due to the decomposition of glycerol, is intrinsic loose and porous for the uptake of carbon.32 Thus, it has been chemically removed by using piranha solution in our experiment, and single layer walled TiO2 nanotube arrays were attained. As shown in inset images of Fig. 2b, TiO2 nanotubes clearly consist of only one layer in tube wall, accompanied by compactly integrated structure of nanotube array as that before piranha solution etching (Fig. 2a and b). On the basis of etching out of inner layer, hydrothermal treatment in strontium acetate solution was also applied to single layer walled TiO2 nanotube arrays. The same as double layer walled nanotube, no morphological failure was observed. The tube wall also became thicker probably due to the incorporation of strontium. As a consequence, single layer walled TiO2 nanotubes have been successfully obtained via chemical etching using piranha solution, its integrated nanotubular structure is also robust when subjected to hydrothermal treatment in Sr2+ containing solution.
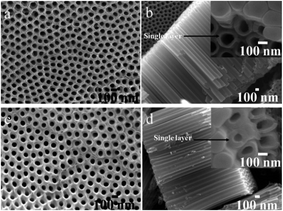 |
| | Fig. 2 SEM images of (a, b) as-synthesized TiO2 nanotube arrays (STNT) and (c, d) SrTiO3/TiO2 nanotube arrays (SSTNT) with single layer walled structure. | |
Fig. 3 shows the TEM/EDX results of double and single layer walled SrTiO3/TiO2 nanotubes. Initially, the loose inner layer of tube wall, which can be observed clearly for double layer walled nanotube shown in Fig. 3a, disappeared for single layer walled nanotube shown in Fig. 3c. This is in accordance with the SEM results of Fig. 1 and 2, and further proved the successful etching out of inner layer using piranha solution. Furthermore, elemental composition measurement has also been performed perpendicular to a single nanotube, and the EDX profiles are shown respectively in Fig. 3b and d. According to the EDX profiles, Ti, O, F and Sr exist for both double and single layer walled nanotubes, indicating the successful incorporation of strontium ions during hydrothermal process. Whereas, fluoride ions should come from the anodizing process, where TiF4, TiOF2 and pentafluoro-aquo-titanate can be formed and cause the uptake of fluoride inside nanotubes.33,34 This can also be confirmed in XPS spectra of as anodized double layer walled TiO2 nanotube arrays shown in Fig. S1.† Fluoride peak can be observed clearly in the wide scanning spectrum. Moreover, in Fig. 3b, it can be observed that the Sr content in the outer layer region is higher than that in the inner layer region, explaining that strontium was mostly accumulated in the outer layer other than the inner layer of tube wall. TEM/EDX mapping of Fig. S2f† further consolidates that strontium favours the outer layer of tube wall, wherein accumulation of Sr can be observed clearly inside. During hydrothermal treatment, dissolution of TiO2 and precipitation of SrTiO3 will occur according to the reactions below:35,36
| TiO2 + 2OH− + 2H2O → [Ti(OH)6]2− |
| Sr2+ + [Ti(OH)6]2− → SrTiO3 + 3H2O |
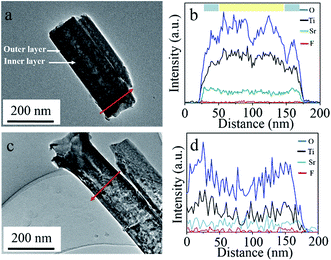 |
| | Fig. 3 TEM images and EDX spectra of (a, b) double and (c, d) single layer walled SrTiO3/TiO2 nanotube arrays.  : outer layer region, : outer layer region,  : inner layer region. : inner layer region. | |
As previous mentioned, the inner layer of double layer walled nanotubes suffered higher carbon contamination for glycerol decomposition, and thus content of TiO2 in the inner layer should be lower than that in the outer layer. Hence, based on above chemical reactions, SrTiO3 formation in the outer layer might be more sufficient than that in the inner layer, that is, strontium prefer accumulating in the outer layer of tube wall rather than the inner layer.
XRD analysis was conducted to investigate the crystal structures of annealed TiO2 and SrTiO3/TiO2 nanotube arrays. After annealing at 450 °C for 3 h, XRD patterns shown in Fig. 4a revealed that the crystal nature of both double and single layer walled TiO2 nanotube arrays crystallized into anatase phase with apparent anatase diffraction peaks. Differently, for the two samples which have been subjected to hydrothermal treatment in Sr2+ containing solution, additional diffraction peaks corresponding to perovskite SrTiO3 appeared (2θ = 32.5°), confirming that part of TiO2 nanotube was converted into SrTiO3. This was also confirmed in Fig. S5,† which demonstrates the XRD patterns of double layer walled TiO2 nanotube arrays with hydrothermal treatment in solutions of four different strontium acetate concentrations (0.02, 0.04, 0.06 and 0.08 mol L−1). Identical crystalline structure can be observed for all samples with characteristic peaks of titanium, anatase TiO2 and perovskite SrTiO3 in the XRD patterns. No other strontium containing phases were formed. XPS analysis was taken to further investigate the chemical composition of double layer walled SrTiO3/TiO2 nanotube arrays. The fully scanned spectrum showed the existence of Sr, Ti, O, C and F in the double layer walled SrTiO3/TiO2 nanotube arrays, while the C element could be the adventitious carbon based contaminant (Fig. S3†). The high resolution XPS spectra with scanning over the area of Sr 3d and F 1s were also measured and shown in Fig. 4b and c. In Fig. 4b, the spectrum of Sr 3d contains two peaks of Sr 3d5/2 and Sr 3d3/2 located at 132.2 eV and 134.1 eV respectively. The former peak can be assigned to perovskite SrTiO3 material, and the latter peak can be ascribed to SrO complexes.37,38 In Fig. 4c of XPS spectrum of F 1s, two contributions at 684.6 eV and 688.2 eV can be observed clearly. The peak at 684.6 eV is in good agreement with those reported for F− physically absorbed on the sample surface.39 The second peak at 688.2 eV corresponds to the doped fluoride in substitutional positions (e.g. TiO2−xFx, SrTiO3−xFx).40,41 This is comparable different from the XPS spectrum of F 1s for as anodized double layer walled TiO2 nanotube arrays (Fig. S1†). After anodization, only the peak located at 684.6 eV, which corresponds to physically absorbed fluoride, can be observed. This indicates that fluoride were doped into crystal lattice after hydrothermal and post-annealing treatment. Since the ions radius of fluoride (0.133 nm) is virtually identical to that of oxygen (0.132 nm), fluoride may occupy the oxygen sites in the lattice, and the fluoride doped SrTiO3/TiO2 nanotube arrays were formed. In one word, the XRD and XPS results concluded that SrTiO3/TiO2 nanotube arrays have been formed through hydrothermal treatment, and fluoride ions were also doped inside.
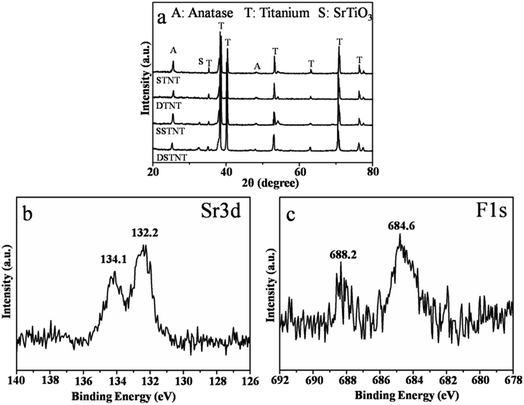 |
| | Fig. 4 (a) XRD patterns of annealed double and single layer walled TiO2 nanotube arrays with and without hydrothermal treatment; (b) and (c) high resolution XPS profiles of Sr 3d and F 1s of annealed double layer walled TiO2 nanotube arrays with hydrothermal treatment. | |
The photoelectric conversion performances of the four samples (STNT, DTNT, SSTNT and DSTNT) have been examined by measuring the photocurrent responses under chopped simulated solar light irradiation at a bias potential of 0.3 V. Fig. 5a represents the comparable results. For all the four samples, no significant photocurrent can be observed as soon as the irradiation of light turned off. When the light was turned on, the photocurrent densities for STNT, DTNT, SSTNT, DSTNT reached 12.5, 15.5, 30.5, and 40.5 μA cm−2 respectively, and the on–off cycles were reproducible. By comparison, the photocurrent density of double and single layer walled TiO2 nanotube arrays raised with the coupling of SrTiO3. In fact, the photocurrent appeared due to generation and separation of electron–hole pairs at the nanotube arrays/electrolyte interface.42 Firstly, under simulated solar light irradiation, TiO2 and SrTiO3 can both be excited to produce e−/h+ pairs. Since the conductive band (CB) of SrTiO3 is situated above the CB of TiO2, electrons in the CB of SrTiO3 will migrate to the CB of TiO2, while holes in the valence band (VB) of TiO2 will inversely migrate to the VB of SrTiO3.21 Thus, separation of photo-generated e−/h+ pairs could be efficiently promoted through coupling of SrTiO3, and photocurrent density for SrTiO3/TiO2 nanotube arrays increased compared to that for TiO2 nanotube arrays. Second, red shift of absorption edge has been observed for both double and single layer walled SrTiO3/TiO2 nanotube arrays (Fig. 5b). Different from double and single layer walled TiO2 nanotube arrays, there are clear response in the visible region for double and single layer walled SrTiO3/TiO2 nanotube arrays. The optical responses in the visible light region could be the doping of fluoride inside nanotube arrays. It has been reported that doping of fluoride may give rise to the modification of electronic structure around the CB edge of TiO2 and SrTiO3.43,44 Moreover, according to ref. 44 and 45, doping of fluoride inside SrTiO3 might induce the formation of Ti3+ ions, which can lead to high visible light absorption capability. Therefore, both samples of SSTNT and DSTNT demonstrated significant visible light sensitiveness (Fig. 5b). This visible light sensitiveness can also improve the photocurrent densities under simulated solar light irradiation for SrTiO3/TiO2 nanotube arrays (Fig. 4a). Further observation from Fig. 4a also indicates that photocurrent densities of nanotube arrays with double layer walled structure is higher than that of nanotube arrays with single layer walled structure. The enhanced surface area may be responsible for the prompted photocurrent densities. The tube wall of double layer walled nanotube contains two layers, and the inner wall is loose and porous. The porosity of tube wall can contribute to the enlarged surface area of nanotube arrays. This is also confirmed in Fig. 5c. The dye loading of DTNT and DSTNT are 49 and 47 nmol cm−2 respectively, which is higher than that of STNT and SSTNT (27 and 23 nmol cm−2). In Fig. S4,† BET adsorption–desorption isotherms also demonstrated the higher specific surface area of double layer walled SrTiO3/TiO2 nanotubes compared to single layer walled SrTiO3/TiO2 nanotubes (37.77 m2 g−1 > 32.74 m2 g−1). Due to the enlarged surface area, more active sites might be generated, and the photocurrent density will thus increased.46,47
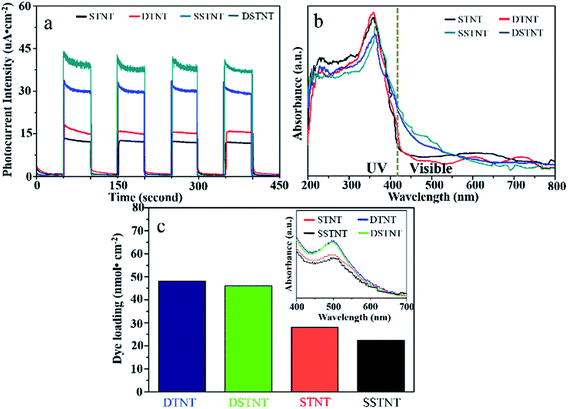 |
| | Fig. 5 (a) j–t curves upon chopped simulated solar light illumination at 0.3 V vs. Ag/AgCl reference electrode, (b) UV-visible absorption spectra and (c) dye loading measurements of annealed double and single walled TiO2 nanotube arrays with and without hydrothermal treatment. | |
As is well-known, photocatalytic properties of TiO2 is strongly related to the factors such as separation efficiency of e−/h+ pairs, specific surface area and efficiency of visible light utilization etc.48 Based on the above discussions on Fig. 5, improved photocatalytic properties of nanotube arrays can be expected, examination on the photocatalytic properties of nanotube arrays has been conducted. With regarding to the photocatalytic test, the maximum absorption peaks of MB at 664 nm were measured for evaluating the apparent rate constant of different samples following a first order kinetics (see details in Fig. S6†). Fig. 6a–c show the pseudo-first-order kinetic rate plots for the four samples under different light sources, the corresponding rate constants were determined by the slope of the decay fits and are given in Fig. 6d. Without the samples, degradation rates of MB are all minimum, indicating effective photocatalytic activity of nanotube arrays. Herein, photofading of MB is comparably faster under simulated solar light irradiation than that under UV light irradiation. The reason could be the higher light intensity of simulated solar light than that of UV light (25.8 mW cm2 > 1.1 mW cm2).49 Since pH value of MB solution is 9.1, nonelectronic reduction of MB+ by hydroxyl ions will occur and produce hydroxyl radicals under basic condition.50 The higher light intensity can promote the generation of hydroxyl radicals, which are strong oxidizing species.51,52 Therefore, photofading of methylene blue solution was faster under simulated solar light irradiation than that under UV light irradiation. With the existence of samples, rate constants for MB degradation over sample of DSTNT were calculated to be 0.13 h−1, 0.15 h−1 and 0.53 h−1 under UV, visible and simulated solar light irradiation respectively, which are the highest among the four samples. This can be attributed to the synergetic effects of suppressed recombination of e−/h+ pairs, improved surface area and visible light sensitization (Fig. 5). Due to the synergetic effects, more electrons and holes will form, migrate to the surface of DSTNT, and generate increased number of hydroxyl radicals (˙OH).48,53,54
| (SrTiO3/TiO2) + hv → (SrTiO3 + TiO2) (eCB− + hVB+) |
| MB + ˙OH → degradation products |
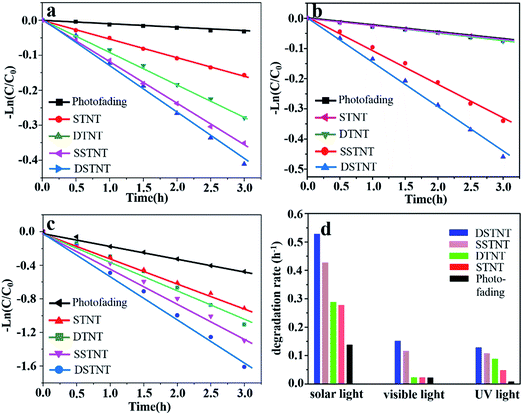 |
| | Fig. 6 Pseudo-first-order kinetic rate plots of the photocatalytic degradation of MB solution for various samples under (a) UV light, (b) visible light and (c) solar light irradiation; (d) degradation rates of MB solution for the four samples under different light irradiation. | |
The hydroxyl radicals, which are strong oxidizing agent, can decompose the MB to the final products. Finally, MB was most effectively degraded by the sample of DSTNT. While for other three samples (SSTNT, STNT and DTNT), the synergetic effect of improved specific surface area, visible light absorption and separation of electron–hole pairs cannot be realized, thus their photocatalytic activities decreased. For samples of STNT and DTNT, doping of fluoride inside nanotube arrays did not occur, both single and double layer walled TiO2 nanotube arrays are visible light insensitive (Fig. 5b), and demonstrated no photocatalytic activity under visible light irradiation. As shown in Fig. 6b and d, degradation rates of MB over samples of STNT and DTNT are the same as that without samples. For single layer walled structure, the specific surface area is lower than that of double layer walled structure. So samples of both STNT and SSTNT demonstrated lower photocatalytic activities than samples of SSTNT and DSTNT. It can also be noted that degradation rates of MB solution for all samples are higher under simulated solar light irradiation than that under ultraviolet light irradiation. With regarding to this result, one reason could be the higher intensity of simulated solar light. Since the photocatalytic efficiency of nanotube array is light intensity dependent, under higher intensity, a larger amount of hydroxyl radicals can be generated. Another reason could be the accelerated photolysis rate of MB solution under simulated solar light irradiation. As discussed above, nonelectronic reduction of MB+ by hydroxyl ions will be accelerated under higher light intensity. This may also generate more hydroxyl radicals. Therefore, MB solution was degraded faster under simulated solar light irradiation for all samples.
In addition to photocatalytic property, the hydroxylapatite formation ability of the as prepared samples was also tested. Fig. 7 shows the XRD patterns of the four samples (STNT, DTNT, SSTNT and DSTNT) after soaking in SBF for 18 days. The peaks with 2θ of 32.2°, which belong to hydroxylapatite, were detected for all the samples, indicating the successful formation of hydroxylapatite on the surface. Particularly, it is noteworthy that the intensity of hydroxylapatite peaks for the four samples are different. This can be ascribed to the different hydroxylapatite formation ability of the four samples. We further conducted SEM observation to examine the surface morphologies with hydroxylapatite formation, and the results are shown in Fig. 8. For the double and single layer walled TiO2 nanotube arrays, just some hydroxylapatite particles were observed on the surface (Fig. 8a and c), the porous structure of nanotube mouths can still be recognized clearly. Differently, the surface of another two samples (DSTNT and SSTNT) were fully covered by thick hydroxylapatite layer (Fig. 8b and d). To be more detailed, Fig. 8b shows many cracks of hydroxylapatite film, while the cracks disappeared in Fig. 8d. In other words, the hydroxylapatite layer could be denser for DSTNT than that for SSTNT. From above comparison, it can be concluded that, as the photocatalytic activity, the double layer walled SrTiO3/TiO2 nanotube arrays also showed the highest hydroxylapatite formation ability among the four samples. In fact, according to ref. 55 and 56, subtle dissolution of SrTiO3 can occur during SBF immersion test as follows:
| SrTiO3 + H2O → Sr2+ + TiO2 + 2OH− |
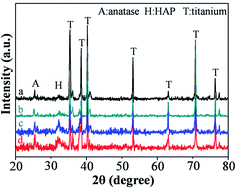 |
| | Fig. 7 XRD patterns of annealed double and single layer walled TiO2 nanotube arrays with and without hydrothermal treatment after soaking in SBF for 18 days. (a) STNT, (b) DTNT, (c) SSTNT and (d) DSTNT. | |
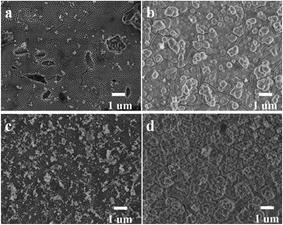 |
| | Fig. 8 SEM images for the samples of (a) STNT, (b) SSTNT, (c) DTNT and (d) DSTNT after soaking in SBF for 18 days. | |
This indicates that SrTiO3 can behave as insoluble TiO2 and partially soluble SrO in the aqueous solution. Therefore, for the formation hydroxylapatite layer, Ca2+ is firstly adsorbed around sample surface of negative charges for the isoelectric point of TiO2 at pH = 6.2, and then HPO42− groups are caught by the hydroxyl groups such as Ti–OH which work as inducers for hydroxylapatite formation. Herein, for the double layer walled SrTiO3/TiO2 nanotube arrays, the OH− concentration at the vicinity of sample surface will increase due to the dissolution of SrTiO3.57 It has also been reported that fluoride doping can generate more hydroxyl groups for the charge imbalance between −1 F ions and −2 oxygen sites.40 Fluoride also has higher affinity in respect to oxygen. The existing hydrogen atoms of the OH− group in hydroxyapatite will be tightly bonded to the nearby F− anions.58 This can improve the chemical stability of hydroxylapatite. The above factors can promote the formation of hydroxylapatite. Moreover, for the porosity of tube wall, double layer walled SrTiO3/TiO2 nanotube arrays has rougher surface, this may also contribute to a larger number of reactive initiation sites and promote the hydroxylapatite formation.59 It has also been reported that the piezoelectricity of SrTiO3 can also facilitate the formation of hydroxyapatite.60 The stress inside nanotube array could induce negative polarization of compounds surface.61,62 Thus, adsorption of charge compensatory Ca2+ ions will be accelerated, and the hydroxylapatite formation ability is improved.63 Considering above discussions, the hydroxylapatite formation ability is highest for double layer walled SrTiO3/TiO2 nanotube arrays, while other three samples are inefficient for hydroxylapatite formation.
4. Conclusion
In summary, through hydrothermal treatment in strontium acetate containing solution, we have successfully prepared fluoride doped SrTiO3/TiO2 nanotube arrays with both double and single layer walled structure. It was found that the preferred accumulation of strontium occurred in the outer layer of tube wall for double layer walled TiO2 nanotube. Due to the fluoride doped inside, both double and single layer walled SrTiO3/TiO2 nanotube arrays demonstrated absorption of visible light. For the formation of hetero-junction between TiO2 and perovskite-type SrTiO3, separation of photogenerated e−/h+ pairs has been efficiently improved. In addition, dye loading test indicated a higher specific surface area of double layer walled nanotube arrays than that of single layer walled nanotube arrays. Owning to the synergetic effect of above three factors, fluoride doped double layer walled SrTiO3/TiO2 nanotube arrays exhibited the highest photocatalytic activities. The degradation rates of methylene blue over fluoride doped double layer walled SrTiO3/TiO2 nanotube arrays are 0.13 h−1, 0.26 h−1 and 0.53 h−1 respectively under ultraviolet, visible and simulated solar light irradiation. Formation of SrTiO3, fluoride doping and double layer walled structure can also stimulate the growth of hydroxylapatite on the surface of nanotube arrays by producing a larger number of hydroxyl ions, hydroxyl groups and initiation sites. Thus the fluoride doped double layer walled SrTiO3/TiO2 nanotube arrays also showed highest hydroxylapatite formation ability for the biomedical applications. The general concept reported in this article can be extended to the fabrication of other perovskite-type titanate nanotube arrays for applications such as photocatalysis, biomedicine and nanoscale electronics.
Conflicts of interest
There are no conflicts to declare.
Acknowledgements
This work was supported by the National Natural Science Foundation of China (Grant No. 51602292), Shanxi Province Science Foundation for Youths (Grant No. 201701D221087) and the starting fund for scientific research of North University of China (Grant No. 130082).
References
- V. Zwilling, E. Darque-Ceretti and A. Boutry-Forveille, Electrochim. Acta, 1999, 45, 921–929 CrossRef CAS.
- J. Xing, H. Li, Z. Xia, J. Chen, Y. Zhang and L. Zhong, Ind. Eng. Chem. Res., 2014, 53, 10667–10672 CrossRef CAS.
- N. K. Shrestha, J. M. Macak, F. Schmidt-Stein, R. Hahn, C. T. Mierke, B. Fabry and P. Schmuki, Angew. Chem., 2008, 120, 1–5 CrossRef.
- W. Guo, X. Xue, S. Wang, C. Lin and Z. L. Wang, Nano Lett., 2012, 12, 2520–2523 CrossRef CAS PubMed.
- S. Berger, A. Ghicov, Y. C. Nah and P. Schmuki, Langmuir, 2009, 25, 4841–4844 CrossRef CAS PubMed.
- J. M. Macak, M. Zlamal, J. Krysa and P. Schmuki, Small, 2007, 2, 300–304 CrossRef PubMed.
- C. V. Wilmowsky, S. Bauer, R. Lutz, M. Meisel, F. W. Neukam, T. Toyoshima, P. Schmuki, E. Nkenke and K. A. Schlegel, J. Biomed. Mater. Res., Part B, 2009, 89, 165–171 CrossRef PubMed.
- Y. Y. Song, F. Schmidt-Stein, S. Berger and P. Schmuki, Small, 2010, 6, 1180–1184 CrossRef CAS PubMed.
- K. Lee, A. Mazare and P. Schmuki, Chem. Rev., 2014, 114, 9385–9454 CrossRef CAS PubMed.
- I. Paramasivam, H. Jha, N. Liu and P. Schmuki, Small, 2012, 8(20), 3073–3103 CrossRef CAS PubMed.
- H. G. Yun, J. H. Park, B. S. Bae and M. G. Kang, J. Mater. Chem., 2011, 21, 3558–3561 RSC.
- K. S. Raja, M. Misra and K. Paramguru, Mater. Lett., 2005, 59, 2137–2141 CrossRef CAS.
- X. Luan, D. Guan and Y. Wang, J. Phys. Chem. C, 2012, 116, 14257–14263 CAS.
- X. Zhang, L. Wang, C. Liu, Y. Ding, S. Zhang, Y. Zeng, Y. Liu and S. Luo, J. Hazard. Mater., 2016, 313, 244–252 CrossRef CAS PubMed.
- L. Hu, C. C. Fong, X. Zhang, L. L. Chan, P. K. S. Lam, P. K. Chu, K. Y. Wong and M. Yang, Environ. Sci. Technol., 2016, 50, 4430–4438 CrossRef CAS PubMed.
- M. Z. Ge, C. Y. Cao, S. H. Li, Y. X. Tang, L. N. Wang, N. Qi, J. Y. Huang, K. Q. Zhang, S. S. Al-Deyab and Y. K. Lai, Nanoscale, 2016, 8, 5226–5234 RSC.
- G. G. Bessegato, J. C. Cardoso and M. V. B. Zanoni, Catal. Today, 2015, 240, 100–106 CrossRef CAS.
- K. F. Huo, X. M. Zhang, H. R. Wang, L. Z. Zhao, X. Y. Liu and P. K. Chu, Biomaterials, 2013, 34, 3467–3478 CrossRef CAS PubMed.
- L. Z. Zhao, H. R. Wang, K. F. Huo, X. M. Zhang, W. Wang, Y. M. Zhang, Z. F. Wu and P. K. Chu, Biomaterials, 2013, 34, 19–29 CrossRef PubMed.
- X. Zhang, B. Gao, L. Hu, L. Li, W. Jin, K. Huo and P. K. Chu, CrystEngComm, 2014, 16, 10280–10285 RSC.
- J. Ng, S. Xu, X. Zhang, H. Y. Yang and D. D. Sun, Adv. Funct. Mater., 2010, 20, 4287–4294 CrossRef CAS.
- X. Zhang, K. Huo, L. Hu and P. K. Chu, J. Am. Chem. Soc., 2010, 93, 2771–2778 CAS.
- H. M. Kim, H. Takadama, T. Kokubo, S. Nishiguchi and T. Nakamura, Biomaterials, 2000, 21, 353–358 CrossRef CAS PubMed.
- Y. Zhang, Y. Han and L. Zhang, J. Mater. Sci. Technol., 2016, 32, 930–936 Search PubMed.
- Y. Wang, D. Zhang, C. Wen and Y. Li, ACS Appl. Mater. Interfaces, 2015, 16018–16026 CAS.
- F. Riboni, N. T. Nguyen, S. So and P. Schmuki, Nanoscale Horiz., 2016, 1, 445–466 RSC.
- C. Xue, T. Yonezawa, M. T. Nguyen and X. Lu, Langmuir, 2015, 31, 1575–1580 CrossRef CAS PubMed.
- Y. Liu, K. Mu, G. Yang, H. Peng, F. Shen, L. Wang, S. H. Deng, X. Zhang and Y. Zhang, New J. Chem., 2015, 39, 3923–3928 RSC.
- K. F. Huo, H. R. Wang, X. M. Zhang, Y. Cao and P. K. Chu, ChemPlusChem, 2012, 77, 323–329 CrossRef CAS.
- C. Xue, T. Narushima, Y. Ishida, T. Tokunaga and T. Yonezawa, ACS Appl. Mater. Interfaces, 2014, 6, 19924–19932 CAS.
- K. Okada, Electrochemical Oxidation of Glycerol in a Proton-Exchange-Membrane Reactor, The University of Michigan, 2013 Search PubMed.
- C. Xue, S. Hu, W. Liu, Q. Chang, T. Yonezawa and J. Yang, Funct. Mater. Lett., 2017, 10, 1750019–1750023 CrossRef CAS.
- A. Valota, D. J. LeClere, P. Skeldon, M. Curioni, T. Hashimoto, S. Berger, J. Kunze, P. Schmuki and G. E. Thompson, Electrochim. Acta, 2009, 54, 4321–4327 CrossRef CAS.
- C. Xue, T. Narushima and T. Yonezawa, J. Inorg. Organomet. Polym. Mater., 2013, 23, 239–242 CrossRef CAS.
- Y. Xin, J. Jiang, K. Huo, T. Hu and P. K. Chu, ACS Nano, 2009, 3, 3228–3234 CrossRef CAS PubMed.
- S. Zhang, J. Liu, Y. Han, B. Chen and X. Li, Mater. Sci. Eng., B, 2004, 110, 11–17 CrossRef.
- H. Bai, J. Juay, Z. Liu, X. Song, S. S. Lee and D. D. Sun, Appl. Catal., B, 2012, 125, 367–374 CrossRef CAS.
- W. D. Yang, J. Mater. Sci., 1999, 34, 3533–3544 CrossRef CAS.
- J. C. Yu, J. Yu, W. Ho, Z. Jiang and L. Zhang, Chem. Mater., 2002, 14, 3808–3816 CrossRef CAS.
- J. K. Zhou, L. Lv, J. Yu, H. L. Li, P. Z. Guo, H. Sun and X. S. Zhao, J. Phys. Chem. C, 2008, 112, 5316–5321 CAS.
- J. Wang, S. Yin, Q. Zhang, F. Saito and T. Sato, Solid State Ionics, 2004, 172, 191–195 CrossRef CAS.
- J. G. Yu, G. P. Dai and B. B. Huang, J. Phys. Chem. C, 2009, 113, 16394 CAS.
- T. Yamaki, T. Umebayashi, T. Sumita, S. Yamamoto, M. Maekawa, A. Kawasuso and H. Itoh, Nucl. Instrum. Methods Phys. Res., Sect. B, 2003, 206, 254–258 CrossRef CAS.
- H. W. Kang and S. B. Park, Chem. Eng. Sci., 2013, 100, 384–391 CrossRef CAS.
- J. Wang, S. Yin, Q. Zhang, F. Saito and T. Sato, J. Mater. Sci., 2004, 39, 715–717 CrossRef CAS.
- S. Sofiane and M. Bilel, J. Photochem. Photobiol., A, 2016, 324, 126–133 CrossRef CAS.
- N. T. Nguyen, S. Ozkan, I. Hwang, A. Mazare and P. Schmuki, Nanoscale, 2016, 8, 16868–16873 RSC.
- G. Žerjav, M. S. Arshad, P. Djinović, I. Junkar, J. Kovač, J. Zavašnik and A. Pintar, Nanoscale, 2017, 9, 4578–4592 RSC.
- T. Soltani and M. H. Entezari, J. Mol. Catal. A: Chem., 2013, 377, 197–203 CrossRef CAS.
- M. Misran, D. Matheus, P. Valente and A. Hope, Aust. J. Chem., 1994, 47, 209–216 CrossRef CAS.
- H. Gnaser, M. R. Savina, W. F. Calaway, C. E. Tripa, I. V. Vervovkin and M. J. Pellin, Int. J. Mass Spectrom., 2005, 245, 61–67 CrossRef CAS.
- R. Azmat and F. Uddin, Chin. J. Chem., 2009, 27, 1237–1243 CrossRef CAS.
- J. Zhang, Y. Wang, C. Yu, X. Shu, L. Jiang, J. Cui, Z. Chen, T. Xie and Y. Wu, New J. Chem., 2014, 38, 4975–4984 RSC.
- T. Cao, Y. Li, C. Wang, C. Shao and Y. Liu, Langmuir, 2011, 27, 2946–2952 CrossRef CAS PubMed.
- P. Li, I. Kangasniemi, K. de Groot and T. Kokubo, J. Am. Ceram. Soc., 1994, 77, 1307–1312 CrossRef CAS.
- Y. Xin, J. Jiang, K. Huo, T. Hu and P. K. Chu, ACS Nano, 2009, 3, 3228–3234 CrossRef CAS PubMed.
- T. Miyazaki, H. M. Kim, T. Kokubo, C. Ohtsuki, H. Kato and T. Makamura, Biomaterials, 2002, 23, 827–832 CrossRef CAS.
- Y. Chen and X. Miao, Ceram. Int., 2004, 30, 1961–1965 CrossRef CAS.
- H. Tsuchiya, J. M. Macak, L. Muller, J. Kunze, F. Muller, P. Greil, S. Virtanen and P. Schmuki, J. Biomed. Mater. Res., Part A, 2010, 77, 534–541 Search PubMed.
- J. Zhai, Q. Wang, J. Zeng, J. Chen, X. Yi, Z. Shi, G. Tian, P. Yu and C. Ning, RSC Adv., 2017, 7, 32974–32981 RSC.
- A. A. Marino and R. O. Becker, Nature, 1970, 228, 473–474 CrossRef CAS PubMed.
- H. M. Ouyang, G. T. Fei, Y. Zhang, H. Su, Z. Jin, S. H. Xu and L. D. Zhang, J. Mater. Chem. C, 2013, 1, 7498–7506 RSC.
- S. Itoch, S. Nakamura, M. Nakamura, K. Shinomiya and K. Yamashita, Biomaterials, 2006, 27, 5572–5579 CrossRef PubMed.
Footnote |
| † Electronic supplementary information (ESI) available. See DOI: 10.1039/c7ra07741f |
|
| This journal is © The Royal Society of Chemistry 2017 |
Click here to see how this site uses Cookies. View our privacy policy here.  Open Access Article
 *a,
Shengliang Hu
 a,
Qing Changa,
Ying Lia,
Xi Liua and
Jinlong Yangab
![[thin space (1/6-em)]](https://www.rsc.org/images/entities/char_2009.gif) :
:![[thin space (1/6-em)]](https://www.rsc.org/images/entities/char_2009.gif) H2O2 = 3
H2O2 = 3![[thin space (1/6-em)]](https://www.rsc.org/images/entities/char_2009.gif) :
:![[thin space (1/6-em)]](https://www.rsc.org/images/entities/char_2009.gif) 1, volume ratio) for 330 s at 70 °C, then washed with purified water and dried under ambient air condition.
1, volume ratio) for 330 s at 70 °C, then washed with purified water and dried under ambient air condition.


 : outer layer region,
  : inner layer region.


