
 Open Access Article
 This Open Access Article is licensed under a
 Creative Commons Attribution 3.0 Unported Licence
Cofactor induced dissociation of the multifunctional multisubunit EcoR124I investigated using electromobility shift assays, AFM and SPR
James Youella,
Aneta E. Sikora a,
Štěpánka Vejsadováa,
Marie Weiserovab,
James R. Smith*c and
Keith Firmana
a,
Štěpánka Vejsadováa,
Marie Weiserovab,
James R. Smith*c and
Keith Firmana
aSchool of Biological Sciences, University of Portsmouth, King Henry Building, King Henry I Street, Portsmouth PO1 2DY, UK
bInstitute of Microbiology, ASCR, v.v.i., Videnska 1083, 142 20 Prague 4, Czech Republic
cSchool of Pharmacy and Biomedical Sciences, University of Portsmouth, St Michael's Building, White Swan Road, Portsmouth PO1 2DT, UK. E-mail: james.smith@port.ac.uk; Fax: +44 (0)23 9284 3565; Tel: +44 (0)23 9284 2556
First published on 8th August 2017
Abstract
We have applied three techniques to the study of subunit assembly of the Type IC Restriction–Modification enzyme EcoR124I. This fully functional enzyme EcoR124I consists of a complex of the three subunits HsdR, HsdM and HsdS in a R2M2S1 stoichiometry, but is known to dissociate readily, releasing free HsdR and producing first an R1-complex and then the core, DNA-binding methyltransferase (M2S1) complex. Analysis of the assembly pathway of this enzyme has previously employed gel retardation and Surface Plasmon Resonance (SPR), but the studies to date have not included the cofactors required for full enzyme activity. In this paper, we have also used atomic force microscopy (AFM)-based molecular volume measurements, and have analysed the effect of the cofactors ATP and AdoMet on enzyme stability and subunit assembly. We compare the data obtained from all three techniques and we show that they all give consistent results, but inherent differences in the methodologies provide additional information useful for the study of subunit assembly.
1. Introduction
Restriction and Modification (R–M) systems are simple control systems for protecting bacteria from infection by bacteriophages.1 They accomplish this through DNA cleavage (restriction) of incoming DNA by a restriction endonuclease, but protect their own DNA from such cleavage through site-specific DNA methylation (modification) at the target recognition sequence of the endonuclease (REase). These functions, however, are opposites and restriction activity must be prevented in the absence of modification.Type I R–M enzymes are multifunctional, multisubunit enzymes capable of both of restriction and modification within the one enzyme. The fully active enzyme requires Mg2+, ATP and S-adenosyl methionine (AdoMet) as cofactors. They are unusual amongst the various classes and types of restriction enzymes in that they produce random-sized DNA fragments following ATP-dependent DNA translocation and subsequent DNA cleavage, which occurs following blockage of the translocation activity.2–4 Therefore, these enzymes are also complex molecular machines that can read the methylation status of DNA and use this to switch between DNA-methylation and DNA-cleavage activity;5 this switch is critical to control of the two opposing functions of restriction and modification.
The enzyme is composed of three subunits:6,7 HsdR – responsible for restriction activity, ATP and Mg2+ binding and molecular motor activity; HsdM – responsible for binding the cofactor and methyl-group donor AdoMet; and HsdS – responsible for DNA specificity and DNA binding, which assembles as an R2M2S1 complex. HsdS and HsdM can also produce a very stable,8 separate DNA methyltransferase (MTase) of stoichiometry M2S1. EcoR124I is unusual9 and readily dissociates into a more stable R1-complex and free HsdR, this dissociation may be a means for ensuring temporal control of restriction versus modification in vivo.10 The resultant R1-complex lacks the DNA cleavage capability, but retains methylation activity.
The cofactors ATP and AdoMet appear to act as allosteric effectors during DNA-binding, enabling reading of the methylation status prior to initiation of translocation.5 This process is very complex because the REase must discriminate the methylation of DNA before undergoing an allosteric switch, involving a conformational change to the REase, that also switches the function of the enzyme between MTase (for hemimethylated substrates) and REase (for unmethylated substrates). During this process, the REase must flip out one adenine within the recognition sequence11 and compare the methylation status to the adenine on the opposite strand, which is also flipped out of the DNA helix. For REcoKI, the allosteric role of AdoMet appears to involve switching the REase from non-specific to specific DNA binding;12 although, this has not been confirmed for REcoR124I as the enzyme co-purifies with AdoMet and the only effect of AdoMet reported for this enzyme is a slight increase in DNA-cleavage activity in vitro.7 ATP appears to be involved in initiation of DNA translocation and an analysis, using a non-hydrolysable analogue (ATP-γ-S) to ‘freeze’ this initial complex, showed that the first step in translocation involves an ATP-dependent melting of the DNA adjacent to the binding site, producing a bulge of ssDNA allowing the enzyme to overcome problems associated with the persistence length of DNA.13
During translocation, HsdR can readily dissociate from the MTase,14,15 which remains bound to the recognition sequence, and can re-bind and thus reinitiate motor activity.14,16 This dissociation is possible for both the R2-complex and R1-complex, but requires DNA ends on linear DNA17 while, in an interesting contrast, cleavage of circular DNA does not result in dissociation of HsdR and the subunit appears to be irreversibly bound to the cleaved DNA.18
Therefore, Type I R–M enzymes are ideal systems to study protein–protein interactions and how changes in subunit stoichiometry govern function of the enzyme. This provides an ideal model system to compare methods for analysis of such interactions and the importance of molecular recognition as a means of controlling enzyme function. In this paper, we describe the influence of the cofactors on the structural integrity of the EcoR124I REase using three techniques: Electromobility Shift Assays (EMSA), Surface Plasmon Resonance (SPR) and Atomic Force Microscopy (AFM)-based molecular volume measurements. The latter have allowed us to both evaluate the potential of molecular volume measurement as a means of studying protein–protein interactions and to compare the reliability of the different methods that are frequently used to study protein–protein interactions.
Much of the published work involving DNA-binding enzymes has used EMSA, or gel retardation, to analyse the DNA-binding events. Janscák et al.,9 however, showed that EMSA could also discriminate the different species of the subunit assembly pathway of EcoR124I in a “super-shift” assay. AFM can be used to image protein and DNA complexes and combinations of the two. It can also be used for molecular volume measurement as a means of identifying such complexes. Volume measurements have become a reliable method to obtain the stoichiometries of protein–protein assemblies19 and protein–protein association constants.20 Precise measurements of molecular dimensions of proteins are still very challenging due to weak attachment to surfaces, inherent elasticity of the biological materials, tip convolution effects, orientation of proteins on a surface and the electrostatic interactions between macromolecules and the tip.21 The molecular volume method, however, was used to study the Type I R–M enzyme EcoKI,22 while Neaves et al.23 also studied the influence of ATP-γ-S on EcoKI and showed dimerisation and the existence of expanding loops of the DNA bound to the complex, indicative of the translocation process. SPR represents a real-time method for identifying specific molecular recognition and interactions, but surface attachment of proteins and non-specific interactions remains a problem. Surface attachment of DNA, however, is relatively simple and assembly of protein complexes on this DNA can be easily measured in a manner that is reminiscent of EMSA, but, in contrast, the method makes use of dynamic, real-time measurement.
2. Materials and methods
2.1 Bacterial strains and plasmids
MTase was produced from JM109(DE3)[pJS4M], where the recombinant expression plasmid has been previously described (Patel et al., 1992) and REase from JM109(DE3)[pBGSR124].7 Plasmid pCFD30–PUC18 carrying a single recognition site for EcoR124I was used as the DNA substrate for cleavage assays used to monitor REase function. Antibiotics were used at the following final concentrations: ampicillin (150 μg mL−1); kanamycin (70 μg mL−1).2.2 Protein purification
Wild-type MTase was overproduced in JM109(DE3) from plasmid pJS4M,24 as previously described. The HsdR subunit was produced in E. coli JM109(DE3)[pBGSR124] and purified, as described.25 The molar concentration of purified proteins was determined from the absorbance at 280 nm using an extinction coefficient calculated as a sum of contributions of tyrosine and tryptophan residues in the predicted amino acid sequences (wt MTase, E280 = 169![[thin space (1/6-em)]](https://www.rsc.org/images/entities/char_2009.gif) 380 M−1 cm−1; HsdR subunit, E280 = 98100 M−1 cm−1).
380 M−1 cm−1; HsdR subunit, E280 = 98100 M−1 cm−1).
2.3 DNA cleavage assay
Cleavage activity of the reconstituted wt endonuclease was used to monitor REase function and was carried out using gel electrophoresis of covalently closed plasmid DNA (pCFD30 with EcoR124I recognition sequence) that was converted to linear DNA by the functional REase, as previously described.262.4 EMSA assay
DNA binding reactions were performed in a volume of 10 μL in presence of binding buffer (50 mM Tris–HCl (pH 8.0), 50 mM NaCl, 10 mM MgCl2, 1 mM DTT). The fluorescein end-labelled 30 mer oligoduplex containing a central EcoR124I site (5′ CCG GAT CCG TCG ACC TCG AAT TCT GCA CGG 3′) at a final concentration of 200 nM was incubated with different concentrations of previously reconstituted REase, MTase and with a range of different ratios of MTase/HsdR mixtures at RT for 20 min. Unbound DNA and DNA–protein complexes were separated on 6% non-denaturing polyacrylamide gel, run at 4 °C at 100 V in TAE buffer (40 mM Tris–acetate pH 8.0, 1 mM EDTA). After electrophoresis, gels were scanned using a Fujifilm FLA-5000 Phosphoimager. Data were prepared from a number (>5) of gels and represents an average of the DNA-binding characteristics of the EcoR124I assembly subunit-assembly complexes; this allowed the amounts of MTase, R1-complex and R2-complex to be determined. The histogram allowed a rapid analysis of changes in the stability of the complexes of the assembly pathway of the enzyme under the standard conditions used for assembly.2.5 AFM studies
AFM studies were carried out using a MultiMode/NanoScope IV Scanning Probe Microscope (Digital Instruments, Santa Barbara, CA, USA) using the J-scanner (max. xy = 200 μm). AFM imaging was performed in air (T = 22 °C; RH = 21%) in TappingMode® using silicon cantilevers with integrated tips k = 2.5–10 N m−1, R ∼ 10 nm; RMS amplitude = 0.8 V; Model: NSG01, NT-MDT, Russia.:1 followed by a 5 min incubation at 37 °C. The mixture (5 μL) was deposited on the mica surface, followed by 2 min incubation, rinsing with pure water and dried with N2.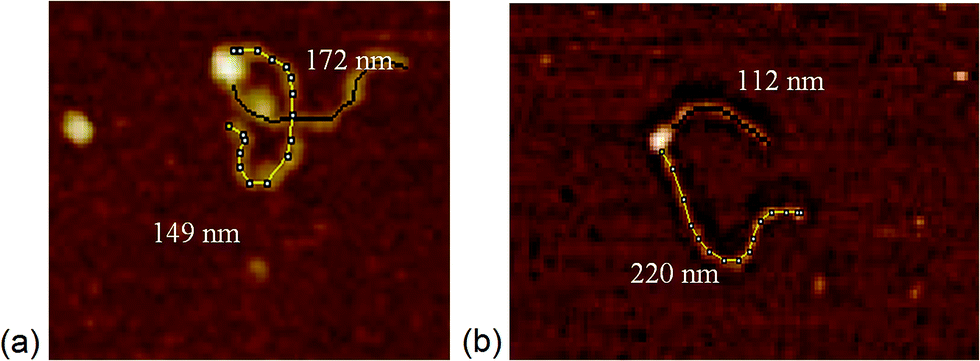 | ||
| Fig. 1 Length measurements of the arms of DNA determined with bound MTase. DNA (1 kB) with the recognition binding site (a) in the middle, and (b) at 1/3 of the DNA length. | ||
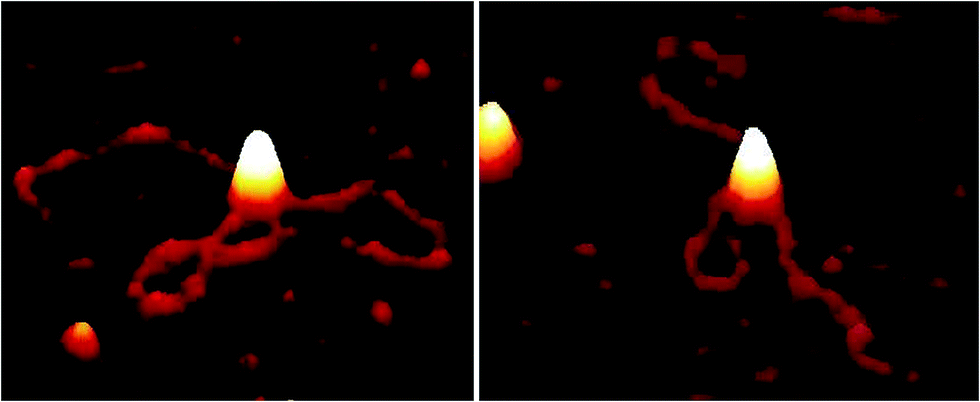 | ||
| Fig. 2 AFM images showing EcoR124I motor activity, resulting in translocation with looping of DNA (1 kB) in the presence of ATP (0.5 mM) after incubation (30 s) on PLL pre-treated mica. | ||
 | (1) |
 | (2) |
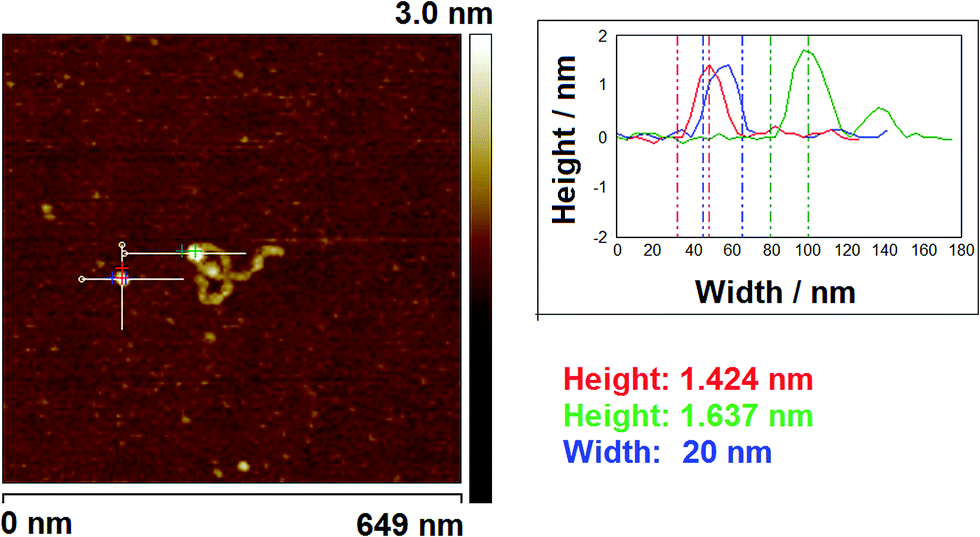 | ||
| Fig. 3 A typical AFM image of a specifically-bound protein–DNA complex deposited on mica pre-treated with PLL and an unbound protein (649 nm × 649 nm; z-scale 3 nm), showing transect method of obtaining height and width measurements. | ||
2.6 SPR analysis of subunit assembly
Subunit assembly and the effect of small molecules on the assembly of EcoR124I was analysed using a Biacore™ T100 SPR instrument using a predefined streptavidin (SA) sensor chip. The SA chip was activated with three 60 second consecutive injections of 1 M NaCl, 50 mM NaOH. This was then followed with 1 μM injections of biotin tagged 30 mer oligoduplex, described above, until a response unit (RU) level of 100 RU had been reached. Subsequent experiments were conducted in the presence of binding buffer (50 mM Tris–HCl (pH 8.0), 50 mM NaCl, 10 mM MgCl2, 1 mM DTT) at a flow rate of 30 μL min−1. The REase holoenzyme was assembled by mixing MTase (100 nM) with HsdR (500 nM) in binding buffer and incubated at room temperature for 20 min; this was then stored at 4 °C. All experiments were conducted with an initial injection of REase for 60 s to bind the REase to the 30 mer oligoduplex followed by a 120 s dissociation period to allow removal of non-specifically bound REase. Following this, specific cofactors were injected for 60 s with a 120 s dissociation period to determine the effects on the REase complex. This was followed by a further injection of fresh HsdR for 60 s to show that the REase complex could be re-assembled.3. Results
3.1 EMSA studies of the effect of the cofactors on the stability of EcoR124I REase (dissociation of the enzyme)
We reconstituted the EcoR124I REase in vitro by mixing MTase and HsdR at a molar ratio of 2:1 and a series of dilutions of this REase were analysed by EMSA in a manner identical to those experiments carried out by Janscák et al.9 While dissociation of the enzyme was carried out by Janscák et al.,7,9 we measured dissociation in the absence and presence of the cofactors ATP and AdoMet using EMSA (Fig. 4). Both AdoMet and ATP were found to influence either the stability of the complex and/or its DNA binding activities. AdoMet was found to have only a slight effect on the DNA binding of the enzyme, with the appearance of free oligoduplex at 40 nM REase rather than 10 nM REase in the absence of this cofactor. In contrast, addition of ATP and AdoMet was found to have a significant effect on both the stability of the enzyme, rapidly dissociating the R2-complex into R1-complex at 200 nM REase and even free MTase at ∼100 nM concentration of REase. At the same time, ATP reduces the DNA binding of the complex, with free oligoduplex appearing at 40 nM concentration of reconstituted enzyme. There is little doubt from the above data that ATP is having an effect on the assembly pathway of the EcoR124I enzyme, rather than simply altering affinity for the target sequence, as was observed with EcoKI.12 This effect can be further investigated through a study of the influence of the cofactors on the assembly of known mutations of the EcoR124I enzyme, which are altered in their subunit assembly pathway. One such mutant has been previously described26 and involves a single amino acid change at Trp212Arg, which was shown to prevent normal assembly of the EcoR124I enzyme in the absence of DNA. It is thought the mutation affects the correct alignment of the subunits prior to DNA binding, but that DNA-binding can “overcome” this problem through the conformational change within the MTase that occurs on DNA binding.29 This conformational change is known to involve a major shift in the alignment of the HsdM subunits,29,30 which in turn is thought to enable HsdR to bind in this mutant protein.
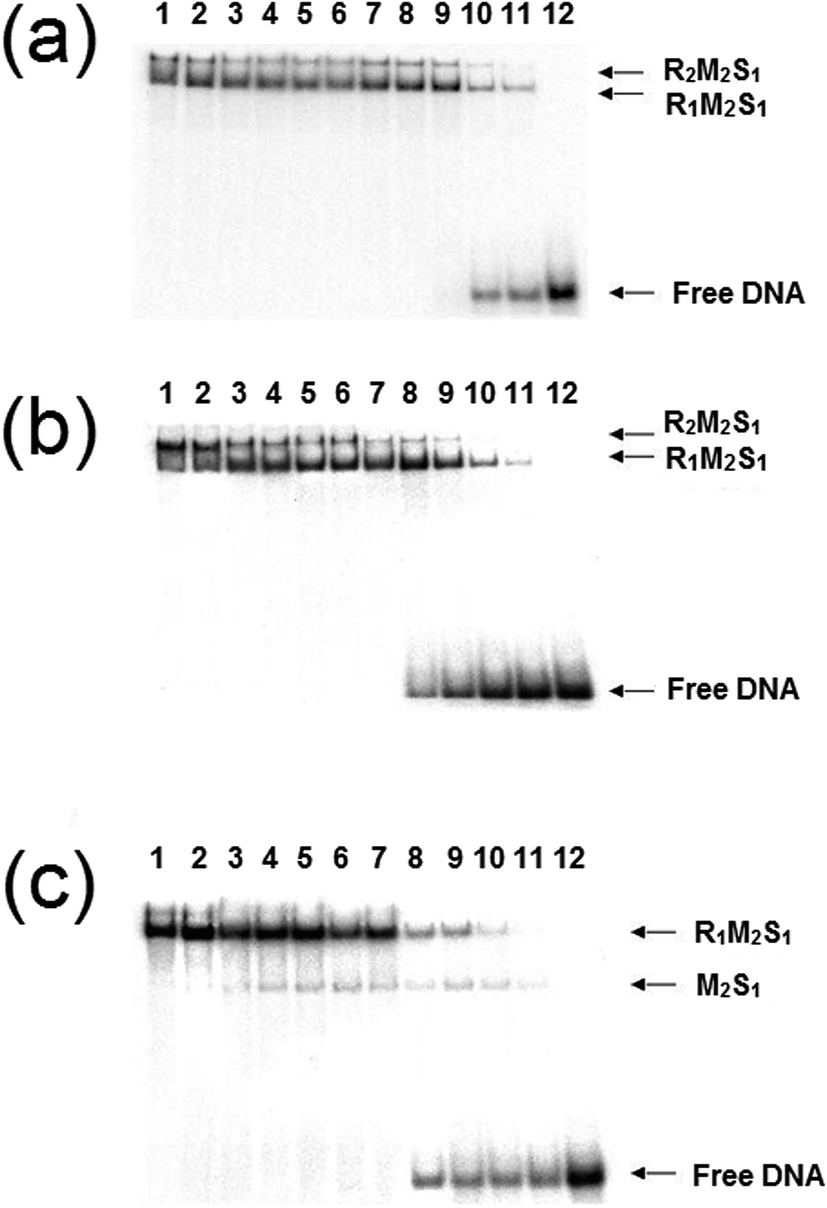 | ||
| Fig. 4 Dissociation of EcoR124I endonuclease in the presence of cofactors. The endonuclease was reconstituted by mixing HsdR and MTase at a molar ratio of 2:1. A series of dilutions of this mixture were then incubated with DNA (20 nM) and analysed by gel retardation. Each gel is identical except for the added cofactors: (a) no cofactors, (b) AdoMet was added at 100 μM, and (c) AdoMet at 100 μM with ATP (2 mM). Lanes 1–12 correspond to protein concentrations of 1000, 500, 200, 150, 100, 80, 60, 40, 20, 10, 5, 0 nM, respectively. | ||
The analysis of the influence of the cofactors on the stability of the EcoR124I (HsdS Trp212Arg) mutant enzyme was next performed (Fig. 5). While AdoMet does not influence the dissociation significantly (reflecting the situation with the wild-type enzyme), the presence of ATP and AdoMet has a dramatic effect with no observable R2-complex even at the highest concentrations of EcoR124I (HsdS Trp212Arg) used. Therefore, when the subunit assembly has been significantly altered by a point mutation, ATP is observed to shift the equilibrium in favour of the R1-complex. ATP also significantly lowered the DNA binding affinity of EcoR124I (HsdS Trp212Arg) with free oligoduplex present even at 200 nM enzyme (Fig. 5). Therefore, the effect of ATP, observed above with the wild-type reconstituted enzyme, is enhanced in the EcoR124 (HsdS Trp212Arg) mutant. The effect on DNA-binding may be the reason for the increased instability, undoing the effect that DNA-binding has on R2-complex formation.
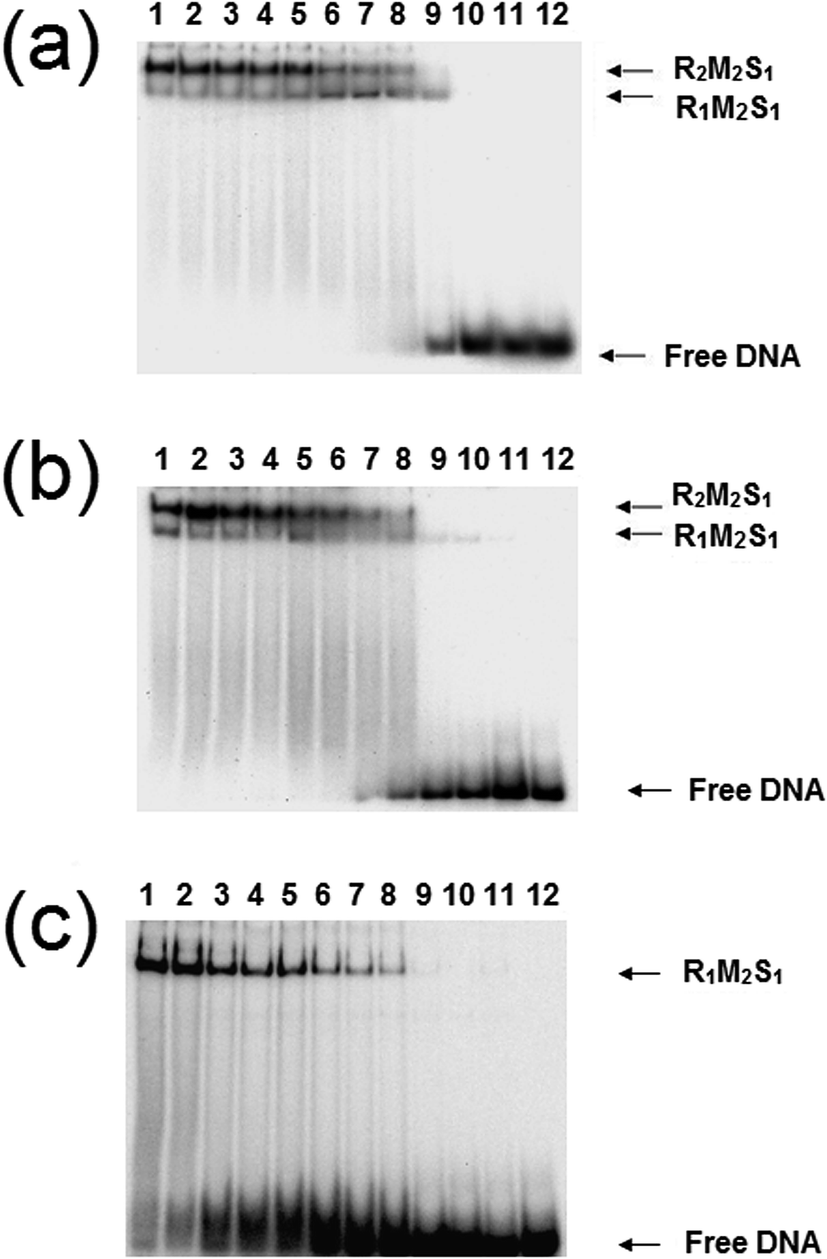 | ||
| Fig. 5 Dissociation of the EcoR124 (HsdS Trp212Arg) mutant enzyme. Details as for Fig. 4, but using the EcoR124I (HsdS Trp212Arg) mutant protein. | ||
3.2 EMSA studies on the effect of cofactors on DNA binding and subunit assembly
The results in the previous section showed the effect of cofactors on enzyme dissociation, but the ability to reconstitute the EcoR124I enzyme in vitro (which has been shown not to change the enzyme activity17) also allows the determination of the effect of these cofactors on subunit assembly during this reconstitution. This was done using a titration experiment of MTase with HsdR, followed by EMSA (Fig. 6). R1-complex reaches a maximum concentration at 200 nM concentration of HsdR, with R2-complex first seen at HsdR concentrations just below 200 nM.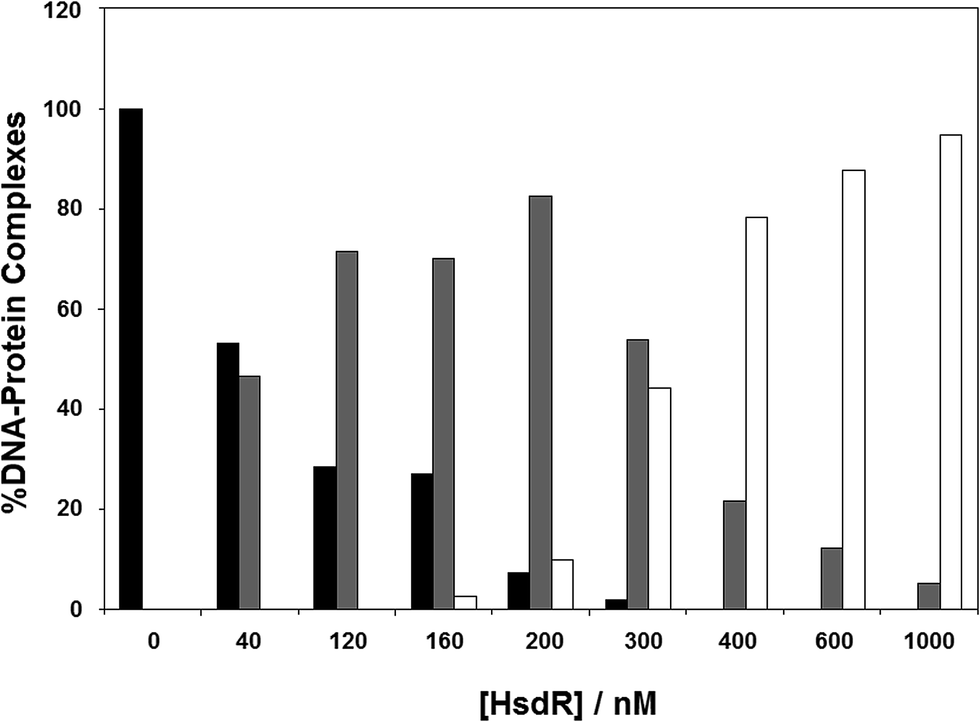 | ||
| Fig. 6 Assembly of EcoR124I holoenzyme in vitro. To analyse gel shift experiments, band intensities were estimated using Scion Image (Scion Corporation). Background values were estimated and averaged. These values were then used to normalise band intensities for each separate gel shift. The data used to plot each graph was the average of at least five experimental datasets. The intensity of the band produced by the DNA–protein complexes were normalised to 100% for the MTase + DNA alone and the intensity of the three protein–DNA complexes (as detailed in Fig. 4) were determined as a percentage of the MTase + DNA. The DNA used was a fluorescein-labelled, 30 bp oligoduplex containing a single recognition sequence for EcoR124I,38 at a final concentration of 200 nM. The appropriate ratio of MTase (200 nM) to HsdR was prepared in a reaction volume of 10 μL binding buffer, incubated at room temperature for 20 min, and then this was mixed with 200 nM final concentration DNA (1:1 ratio to MTase), incubated a further 10 min at room temperature and then loaded onto 6% native PAGE for analysis. Black bar = MTase–DNA; grey bar = R1M2S1–DNA; white bar = R2M2S1–DNA. | ||
The influence of ATP on the assembly of the enzyme across a range of ATP concentrations (1–10 mM) is shown in Fig. 7. It is apparent even at 1 mM ATP (Fig. 7a) that there is a change in the shape of the histogram for formation of the R1-complex, with this complex being stabilised with increasing HsdR concentrations at the cost of the percentage of R2-complex produced. This effect is increased slightly at 2 mM ATP (Fig. 7b), and by 10 mM ATP (Fig. 7c), the percentage formation of R1-complex far outweighs R2-complex formation even at 400 nM HsdR (where, in the absence of ATP, R1-complex formation represented only 20% of the complex). Therefore, it can be concluded that ATP destabilises the enzyme (R2-complex) in studies involving both dissociation (dilution) and subunit assembly and confirms the observations made using translocation measurements where ATP-dependent dissociation was frequently observed.14 This is significantly different from the effect of ATP on the enzyme EcoKI assayed using EMSA, but it is known that the EcoKI holoenzyme is very stable and shows little dissociation of the HsdR complex even under extreme dilution.31,32
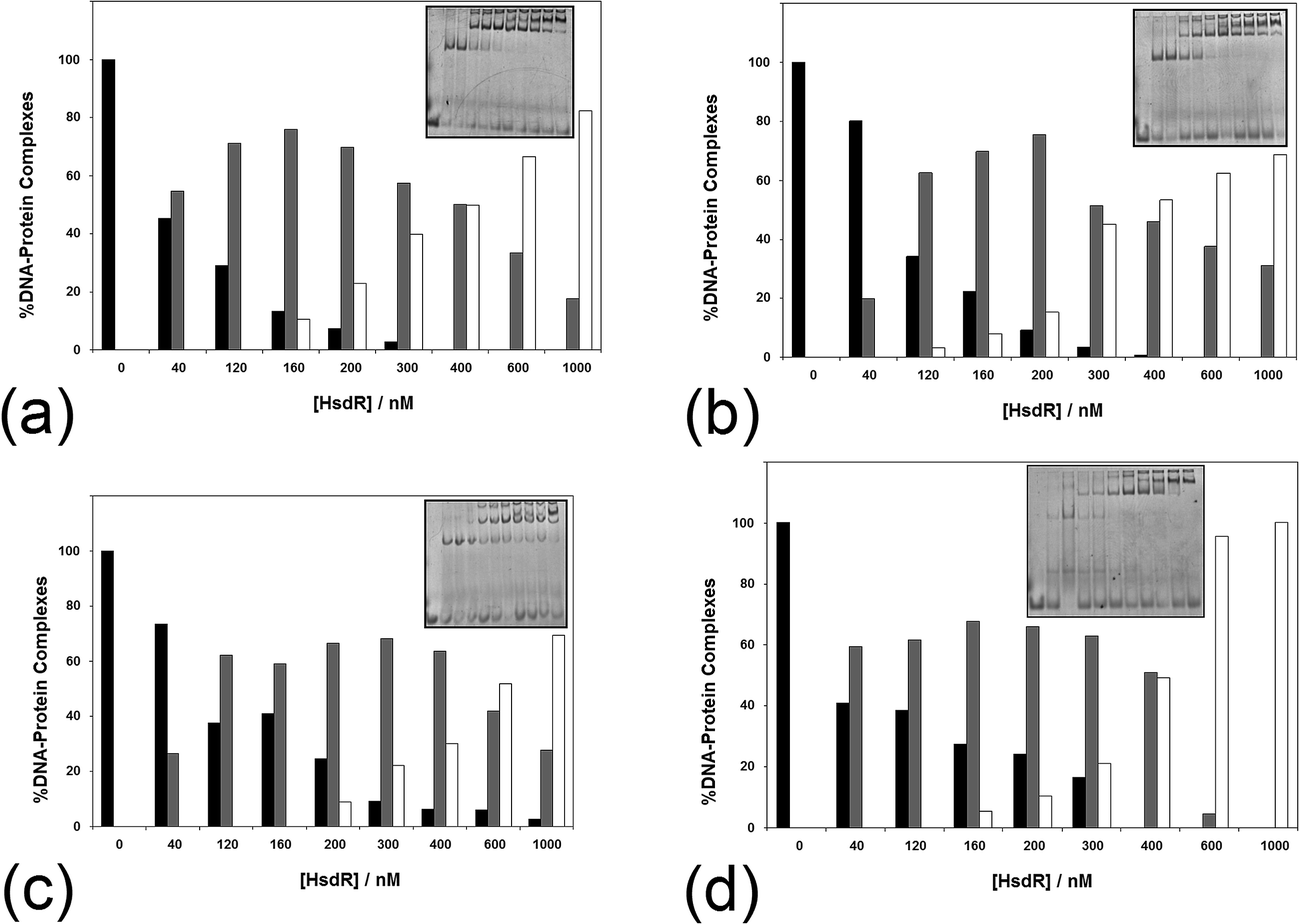 | ||
| Fig. 7 The effect of (a–c) ATP and (d) AdoMet on the stability of the EcoR124I holoenzyme. The analysis of a series of >5 native gel retardation experiments was carried out as described in Fig. 2, except (a–c) the cofactor ATP was added to the mixture of MTase and HsdR at (a) 1 mM, (b) 2 mM and (c) 10 mM final concentration to each reaction mixture, and (d) the cofactor AdoMet was added to the mixture of MTase and HsdR at a concentration of 100 μM. Inset in each figure is an example gel. Black bar = MTase–DNA; grey bar = R1M2S1–DNA; white bar = R2M2S1–DNA. | ||
The influence of the other cofactor AdoMet on the stability of EcoR124I was also investigated (Fig. 7d). AdoMet (100 μM) was found to also increase the stability of the R1-complex at the expense of R2-complex formation. The question arises as to whether other nucleotides, or closely related analogues, would also destabilise the EcoR124I enzyme, including non-hydrolysable analogues of ATP and the product of ATP hydrolysis–ADP. ADP also reduces the stability of the R2-complex, producing increased percentage of R1-complex across a wider range of HsdR concentrations than that seen in the absence of the nucleotide (data not shown). However, the effect of the non-hydrolysable analogues 5′-adenylylimido-diphosphate (AMP-pnp) and ATP-γ-S (data not shown) is less clear with some indication of increased stability of the R1-complex, but this is much less pronounced than for ATP and ADP. GTP, TTP and AMP were found to have no or very little effect on enzyme stability (data not shown). The lack of a clear effect for the non-hydrolysable analogues of ATP may reflect the peculiar situation for the enzyme bound to a 30 bp oligoduplex (in the gel retardation system), where translocation is not possible because of the short length of the DNA and the resulting complex in the gel may be viewed as a stalled complex, which has been shown to readily dissociate HsdR.14 However, the non-hydrolysable analogues of ATP can only form an initiation complex13 that is not capable of translocation and is likely to have a different conformation to the stalled complex, which may not allow dissociation of HsdR.
3.3 AFM studies using measurement of molecular volume
AFM has been widely used for visualisation of proteins and DNA–protein complexes.13,33–35 To determine the oligomeric state of proteins in large DNA–protein assemblies, accurate volume analysis of proteins in the AFM images is required. Therefore, we investigated the application of this technique, with and without cofactors, which allowed a comparison with data obtained using EMSA analysis. One advantage of using AFM volume measurements is that realistic DNA substrates can be used and this provides an important contrast to both EMSA and the SPR technique detailed later.| Vm/nm3 | n | |
|---|---|---|
| a Volume of HsdR (R124I), MTase, MTase–DNA, R1 complex, R1-DNA complex, R2-DNA complexes obtained from AFM measurements of dimensions (see 2.5). Means and standard deviations are shown; n = number of molecules measured. | ||
| HsdR (R124I) | 215 ± 19 | 25 |
| MTase | 235 ± 10 | 30 |
| MTase–DNA complex | 253 ± 20 | 30 |
| R1 complex | 503 ± 33 | 25 |
| R1-DNA complex | 534 ± 33 | 25 |
| R2-DNA complex | 686 ± 51 | 7 |
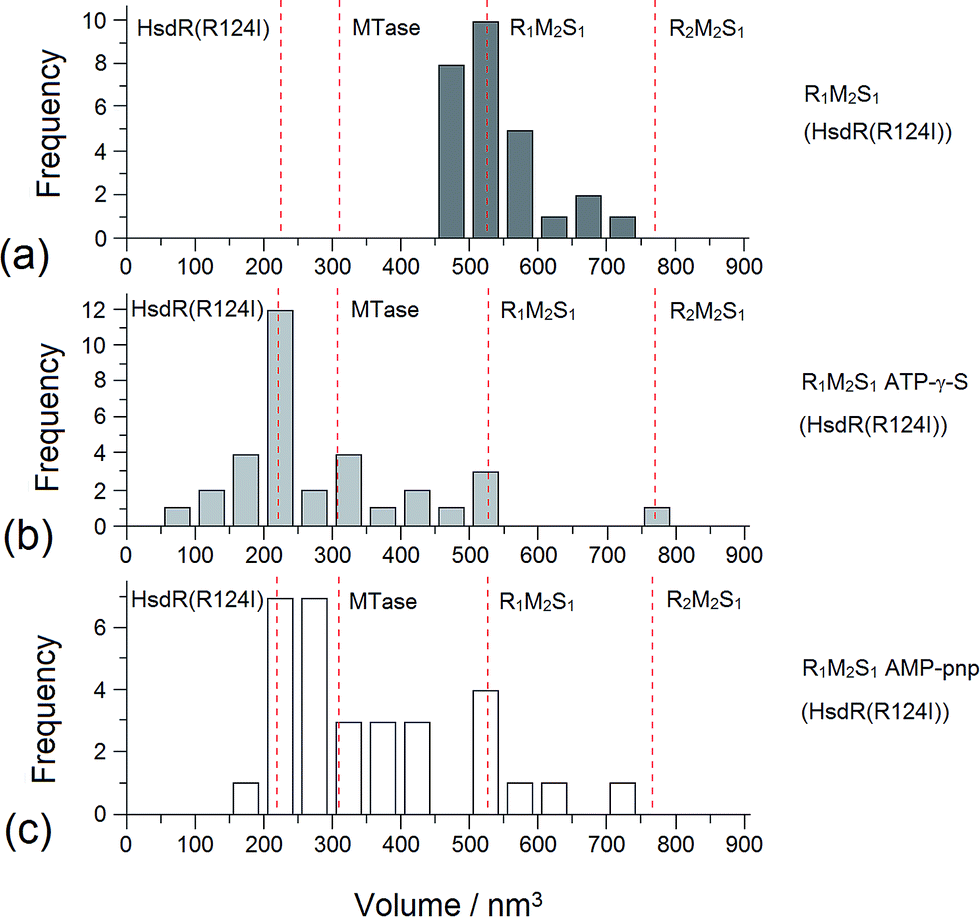 | ||
| Fig. 8 Distribution of AFM molecular volume measurements for the EcoR124I R1 complex. Distribution of Vm of MTase–HsdR (R124I) (R1-complexes) (a) before and (b) after the addition of cofactors ATP-γ-S and (c) AMP-pnp. The vertical dotted lines show the calculated volumes for specific protein complexes. | ||
Addition of ATP confirmed the ability of the enzyme to translocate the DNA (Fig. 2), but at no point was dimerisation, as seen for EcoKI, observed for EcoR124I (data not shown). Interestingly, in this situation, where translocation was observed, there was little evidence for dissociation of the HsdR subunit. This contrasts markedly to the situation observed in the equilibrium situation represented by EMSA, where no translocation is possible due to the limited length of the DNA substrate used, but where a stalled complex may be present. With the observations of Simons and Szczelkun,17 the situation may reflect that such complexes are caught midway through translocation (and only recognised as translocating complexes because of loop formation) and “fixed” in such a state by surface attachment. Volume measurement of the enzyme in these translocating complexes showed the presence of R1-complexes only, suggesting that at the concentrations used (to enable visualisation of single molecule complexes) dissociation of R2-complexes was almost complete.
The addition of ATP-γ-S, where an initiation complex is formed,13 produced a decrease in the number of imaged R1 and R2-complexes, suggesting induced dissociation of HsdR from the complex confirming the observations with EMSA. Comparison with the calculated Vm confirmed the presence of MTase bound to DNA in the majority of the complexes observed. Interestingly, more DNA–R1-complexes were seen in the presence of AMP-pnp, which may indicate a slower process of dissociation with this ATP analogue.
3.4 SPR analysis of the effect of cofactors in real time
SPR has been used to measure the dissociation of HsdR from the EcoR124I R–M complex.36 Therefore, the application of this method was extended to investigate the effect of cofactors and their derivatives on the stability of the EcoR124I enzyme. As with EMSA, the DNA substrates that can be used with this method are limited in size and do not allow translocation events to be observed.In these experiments, the EcoR124I enzyme was pre-formed in solution and then bound to a 30 bp oligoduplex, immobilised onto the surface of the SPR chip used in each system. This analysis simplifies the data obtained as the complex, that is first measured, bound to the DNA, is the R2-complex and it is relatively easy to measure the effect of ATP on the dissociation of this complex, from the DNA. The sensorgrams show rapid assembly of the R2-complex onto the oligoduplex, followed by a slower dissociation of this bound complex due to the salt wash. Upon injection of ATP (10 μM), there was a small but very rapid dissociation of bound complex, which produced a smaller complex that lasted for the 60 s period of injection of ATP (Fig. 9a). After the ATP injection stopped, however, there was a return to the expected level of bound complex on the DNA, as predicted in the absence of ATP (a size suggested by extrapolation of the dissociation curve before addition of ATP). This suggests a sudden change in the bound complex that results in a smaller species, as measured by SPR, which still underwent dissociation of HsdR at the same rate as the complex without ATP, but when ATP was removed it continued the expected dissociation of HsdR. Addition of fresh HsdR (500 nM as initially used to produce the R2-complex) raised the height of the sensorgram trace, above the level observed before injection of ATP (Fig. 9a, H). This suggested that ATP had increased dissociation of the R2-complex, but that HsdR could still re-assemble onto the DNA bound complex. Therefore, these data confirm the observations made during the EMSA analysis that the cofactor ATP induces dissociation of the DNA-bound enzyme, releasing free HsdR and producing increased amounts of R1-complex. However, as with EMSA studies, SPR analysis using 30 bp oligoduplexes provides an unusual DNA substrate for the EcoR124I complex as ATP should initiate translocation, but on this short DNA molecule translocation is not possible and the complex is likely to be a stalled complex and the nature of the DNA-bound complex is uncertain.37 Further analysis of the effect of ATP analogues was carried out using SPR and the non-hydrolysable analogues ATP-γ-S and AMP-pnp. Upon injection of ATP-γ-S, there was a rapid dissociation of the DNA-bound complex, which lasted for the duration of the ATP-γ-S injection, but after the injection had stopped, the trace did not return to the expected height of the trace before injection (Fig. 9b). Therefore, the dissociated complex is different from that observed with ATP. However, injection of HsdR (Fig. 9b, H) did restore the height of the trace indicating re-formation of R2-complex. Therefore, ATP-γ-S has a much more pronounced effect on the stability of the bound complex than is observed in the gel retardation analysis and that seen with ATP. This would suggest a significant kinetic component to the assembly of the R2-complex, which is not observed in the gel retardation analysis, an equilibrium experiment, and that the dissociation of HsdR is more cofactor sensitive in the initiation complex (treated with ATP-γ-S) than it is in the stalled complex. These data were supported from the AFM-based volume measurements, where ATP-γ-S was also shown to lead to rapid dissociation of the observed complexes.
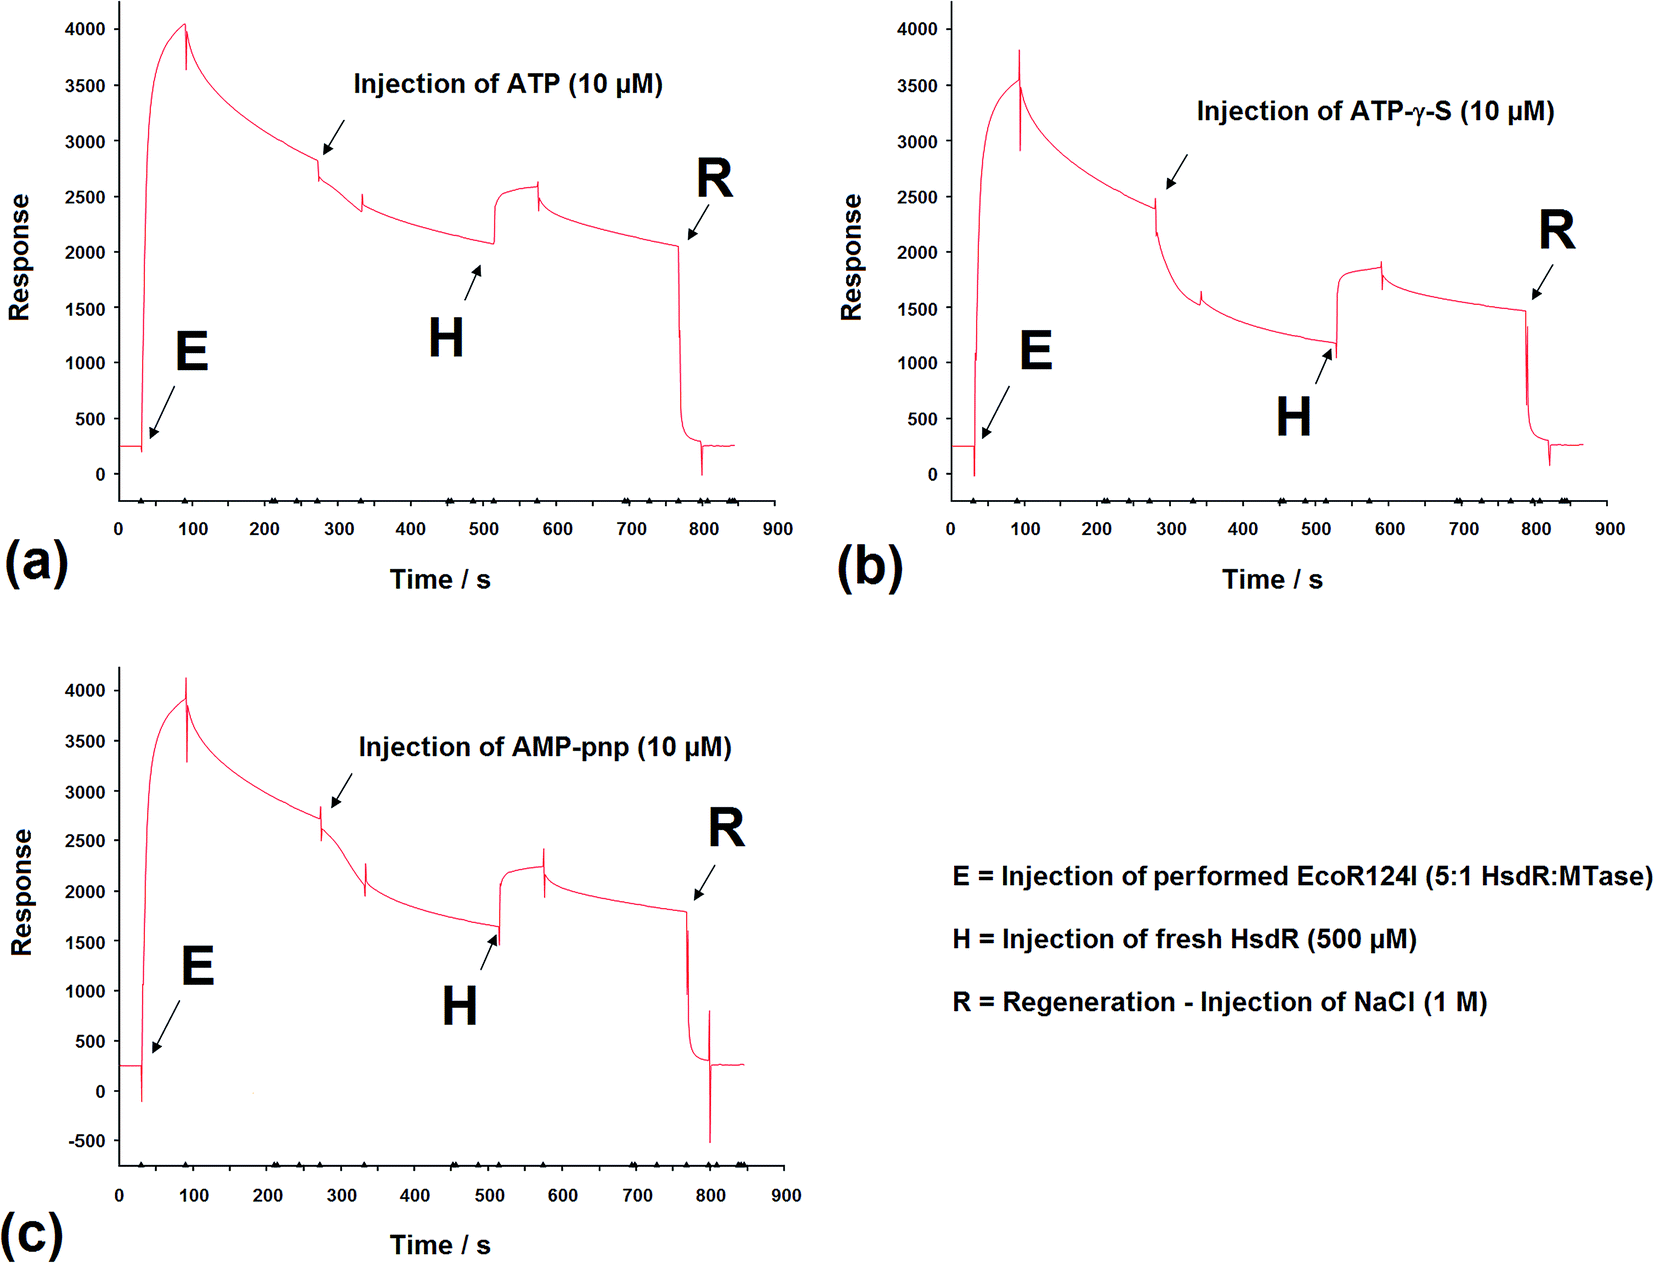 | ||
| Fig. 9 The effect of (a) ATP, (b) ATP-γ-S, and (c) and AMP-pnp, on subunit assembly measured by SPR. Sensorgrams depicting the binding of preformed EcoR124I holoenzyme onto the specific EcoR124I 30 mer DNA oligoduplex attached to a Biacore SA chip. Subsequent injections of (a) ATP, (b) ATP-γ-S, and (c) and AMP-pnp, release bound HsdR, which was rebound following a further HsdR injection (H). Injections except R = 30 μL min−1 for 60 s, R = 30 μL min−1 for 30 s. | ||
The non-hydrolysable ATP analogue, AMP-pnp, showed a more complex dissociation curve, following injection of AMP-pnp, which involved a slow initial response followed by a more rapid dissociation (recovered by addition of HsdR; Fig. 9c). The slow initial response is reminiscent of a sigmoidal curve, which are associated with cooperative effects, suggesting a conformational change associated with binding this analogue of ATP, which is followed by gradual dissociation. This may reflect a difference in the mode of action of the two ATP analogues, where one cofactor (AMP-pnp) allows a significant conformational change in the structure of the enzyme complex, while the other (ATP-γ-S) freezes the initiation complex preventing any conformational changes in the enzyme. These data are also supported by the AFM volume measurements where dissociation was a less frequent event in the presence of AMP-pnp compared to the effect of ATP-γ-S.
4. Discussion
We have employed three technologies to investigate the influence of cofactors on assembly and DNA binding of EcoR124I. Gel retardation is an equilibrium analysis and does not allow analysis of the kinetics of subunit assembly; it is also dependent upon the enzyme binding a short DNA substrate. SPR is a dynamic analysis technique, however, and can differentiate kinetic steps in the processes analysed; it also requires a short DNA substrate for surface immobilisation of the enzyme. AFM molecular volume measurements are also an equilibrium methodology, although dynamic events, such as DNA translocation, can be observed in the images obtained,13 the method can make use of natural-length DNA substrates overcoming any problems associated with the conformation of the enzyme bound to a short DNA substrate. The question, which we hope to address, is “are the results obtained comparable” and “which method provides the most information”?The gel retardation analysis shows that AdoMet has only a slight effect on the stability of the EcoR124I enzyme, while ATP and the non-hydrolysable analogues have a pronounced effect, destabilising the R2-complex, which also reduced DNA binding – probably due to reduced non-specific contacts in the absence of one HsdR subunit. Interestingly, SPR shows that the influence of ATP on the stability of the R2-complex is less pronounced, suggesting that this may be a slow process, which, in the SPR, would take significant time to become apparent, but has already occurred at the time of loading a gel in a gel retardation analysis. The sensitivity of dissociation, to the presence of ATP, is likely to reflect the nature of the complex under study, which, on a 30 bp oligoduplex and after addition of ATP, is equivalent to a stalled complex – a translocating complex that has not cleaved DNA. The stalled complex is known to undergo a slow dissociation of HsdR.14 Seidel et al.14 have also shown that the dissociation of EcoR124I into R1-complex and free HsdR differs significantly in the presence and absence of ATP, which they suggested was likely to reflect a conformational change following translocation and that this effect is not present in the initiation complex prior to addition of ATP. This complex situation is also reflected in our data, where non-hydrolysable analogues of ATP, that are known to trap the enzyme in an initiation complex, show rapid effects not seen with ATP, which involve dissociation of HsdR. Interestingly, the two non-hydrolysable analogues used ATP-γ-S and AMP-pnp show significantly different affects with AMP-pnp showing a slower initial dissociation involving a two-step process that might involve significant slow conformational changes prior to dissociation of HsdR. The AFM molecular volume measurements with the non-hydrolysable analogies of ATP support the data obtained by gel retardation and SPR, but in the presence of ATP, DNA translocation was observed. This supports the above argument that the length of the DNA substrate may significantly influence the conformation and stability of the bound enzyme and that dissociation of HsdR is a result of stalling of the complex.
In conclusion, the three techniques seem equally reliable in determining major effects involving changes in protein–protein interactions, but each can offer additional observations of more subtle differences. One obvious drawback of AFM volume measurement is that images of translocating complexes are “fixed” upon surface attachment for visualisation, which influences the numbers that show dissociation of a subunit. However, it is clear that these techniques are valuable tools for the study of molecular recognition amongst proteins.
Funding
This project was supported in part by the European Union funded project Mol Switch (IST-2001-38036) to KF. MW was also supported by funds provided by The Grant Agency of the Czech Republic (204/07/0325) and by Institutional Research Concept No. AV0Z5020903.Acknowledgements
Štěpánka Vejsadová would like to thank Finance SouthEast for the award of a SePOC funding which initiated this work. Aneta Sikora was supported by a PhD bursary from the University of Portsmouth.References
- S. Lederberg, Virology, 1965, 27, 378 CrossRef CAS PubMed.
- S. Sistla and D. N. Rao, Crit. Rev. Biochem. Mol. Biol., 2004, 39, 1 CrossRef CAS PubMed.
- W. A. Loenen, Nucleic Acids Res., 2003, 31, 7059 CrossRef CAS PubMed.
- N. E. Murray, Microbiol. Mol. Biol. Rev., 2000, 64, 412 CrossRef CAS PubMed.
- R. Yuan, T. A. Bickle, W. Ebbers and C. Brack, Nature, 1975, 256, 556 CrossRef CAS PubMed.
- D. T. F. Dryden, G. D. Davies, I. Martin, L. M. Powell, N. E. Murray, D. J. Ellis, T. Berge, J. M. Edwardson and R. M. Henderson, The assembly of the EcoKI type I DNA restriction/modification enzyme and its interaction with DNA, in Biochem. Soc. Trans., ed. G. G. Kneale, 1999, University of Glasgow, pp. 691–696 Search PubMed.
- P. Janscák, A. Abadjieva and K. Firman, J. Mol. Biol., 1996, 257, 977 CrossRef PubMed.
- I. Taylor, J. Patel, K. Firman and G. G. Kneale, Purification and biochemical characterisation of the EcoR124 modification methylase, Nucleic Acids Res., 1992, 20, 179 CrossRef CAS PubMed.
- P. Janscák, D. Dryden and K. Firman, Nucleic Acids Res., 1998, 26, 4439 CrossRef.
- K. Firman, C. Dutta, M. Weiserova and P. Janscák, Mol. Biol. Today, 2000, 1, 1 Search PubMed.
- D. R. Mernagh, I. A. Taylor and G. G. Kneale, Biochem. J., 1998, 336, 719 CrossRef CAS PubMed.
- L. M. Powell, D. T. F. Dryden and N. E. Murray, J. Mol. Biol., 1998, 283, 963 CrossRef CAS PubMed.
- J. van Noort, T. van der Heijden, C. F. Dutta, K. Firman and C. Dekker, Nucleic Acids Res., 2004, 32, 6540 CrossRef CAS PubMed.
- R. Seidel, J. G. P. Bloom, J. van Noort, C. F. Dutta, N. H. Dekker, K. Firman, M. D. Szczelkun and C. Dekker, Eur. Mol. Biol. Organ. J., 2005, 24, 4188 CrossRef CAS PubMed.
- L. K. Stanley, R. Seidel, C. van der Scheer, N. H. Dekker, M. D. Szczelkun and C. Dekker, Eur. Mol. Biol. Organ. J., 2006, 25, 2230 CrossRef CAS PubMed.
- P. R. Bianco and E. M. Hurley, J. Mol. Biol., 2005, 352, 837 CrossRef CAS PubMed.
- M. Simons and M. D. Szczelkun, Nucleic Acids Res., 2011, 39, 7656 CrossRef CAS PubMed.
- G. A. Roberts, L. P. Cooper, J. H. White, T. J. Su, J. T. Zipprich, P. Geary, C. Kennedy and D. T. F. Dryden, Nucleic Acids Res., 2011, 39, 7667 CrossRef CAS PubMed.
- S. W. Schneider, J. Larmer, R. M. Henderson and H. Oberleithner, Pflügers Archiv, 1998, 435, 362 CrossRef CAS PubMed.
- G. C. Ratcliff and D. A. Erie, J. Am. Chem. Soc., 2001, 123, 5632 CrossRef CAS PubMed.
- D. J. Muller and A. Engel, Biophys. J., 1997, 73, 1633 CrossRef CAS PubMed.
- M. Rhee and M. A. Burns, Trends Biotechnol., 2006, 24, 580 CrossRef CAS PubMed.
- K. J. Neaves, L. P. Cooper, J. H. White, S. M. Carnally, D. T. F. Dryden, J. M. Edwardson and R. M. Henderson, Nucleic Acids Res., 2009, 37, 2053 CrossRef CAS PubMed.
- J. Patel, I. Taylor, C. F. Dutta, G. G. Kneale and K. Firman, Gene, 1992, 112, 21 CrossRef CAS PubMed.
- V. Zinkevich, L. Popova, V. Kryukov, A. Abadjieva, I. Bogdarina, P. Janscák and K. Firman, Nucleic Acids Res., 1997, 25, 503 CrossRef CAS PubMed.
- M. Weiserová, C. F. Dutta and K. Firman, J. Mol. Biol., 2000, 304, 301 CrossRef PubMed.
- A. E. Sikora, J. R. Smith, S. A. Campbell and K. Firman, Soft Matter, 2012, 8, 6358 RSC.
- R. D. Edstrom, M. H. Meinke, X. Yang, R. Yang, V. Elings and D. F. Evans, Biophys. J., 1990, 58, 1437 CrossRef CAS PubMed.
- I. A. Taylor, K. G. Davis, D. Watts and G. G. Kneale, DNA binding induces a major structural transition in a type I methyltransferase, Eur. Mol. Biol. Organ. J., 1994, 13, 5772 CAS.
- A. Obarska, A. Blundell, M. Feder, Š. Vejsadová, E. Šišáková, M. Weiserová, J. M. Bujnicki and K. Firman, Nucleic Acids Res., 2006, 34, 1992 CrossRef CAS PubMed.
- D. T. F. Dryden, L. P. Cooper, P. H. Thorpe and O. Byron, Biochemistry, 1997, 36, 1065 CrossRef CAS PubMed.
- L. M. Powell, B. A. Connolly and D. T. F. Dryden, J. Mol. Biol., 1998, 283, 947 CrossRef CAS PubMed.
- M. L. Bennink, D. N. Nikova, K. O. van der Werf and J. Greve, Anal. Chim. Acta, 2003, 479, 3 CrossRef CAS.
- T. Berge, D. J. Ellis, D. T. Dryden, J. M. Edwardson and R. M. Henderson, Biophys. J., 2000, 79, 479 CrossRef CAS PubMed.
- Y. L. Lyubchenko, B. L. Jacobs, S. M. Lindsay and A. Stasiak, Scanning Microsc., 1995, 9, 705 CAS.
- D. R. Mernagh, P. Janscák, K. Firman and G. G. Kneale, Biol. Chem., 1998, 379, 497 CrossRef CAS PubMed.
- E. Jindrova, S. Schmid-Nuoffer, F. Hamburger, P. Janscák and T. A. Bickle, Nucleic Acids Res., 2005, 33, 1760 CrossRef CAS PubMed.
- I. Taylor, D. Watts and G. G. Kneale, Nucleic Acids Res., 1993, 21, 4929 CrossRef CAS PubMed.
| This journal is © The Royal Society of Chemistry 2017 |