 Open Access Article
Creative Commons Attribution 3.0 Unported Licence
Physical, antioxidant and antimicrobial properties of modified peanut protein isolate based films incorporating thymol
Tianchen Zhong ,
Yue Liang,
Shan Jiang,
Lulu Yang,
Yimo Shi,
Siwen Guo and
Chunhong Zhang*
College of Food, Shenyang Agricultural University, No. 120 Dongling Road, Shenhe District, Shenyang City 110866, China. E-mail: zhangchsy@163.com; Tel: +86 13840404132
First published on 25th August 2017
Abstract
An active film made from modified peanut protein isolate (PPI) and incorporating thymol (TML) was developed. The physical, antioxidant and antimicrobial properties of modified PPI based films containing TML at 0.5, 1, 1.5, and 2% (w/v) were examined. Incorporation of TML decreased the water vapor permeability, tensile strength (TS) and percentage of elongation at break (E) of the film. TML incorporation decreased the transparency and made the film darker, but increased the total phenolic content and antioxidant capacity. Antimicrobial activity was significantly increased by adding TML; Staphylococcus aureus and Lactobacillus plantarum were more susceptible than Escherichia coli and Pseudomonas aeruginosa. These results suggest that edible, modified PPI films incorporating an appropriate amount of TML have the potential to preserve food products, which offers a way to use PPI in active food packaging.
1 Introduction
As environmental pollution issues caused by non-biodegradable plastic material receive increasing attention, edible and biodegradable films come to the fore. This type of packaging reduces the use of synthetic materials, and has the potential to extend shelf-life and enhance the quality of food.1 Edible and biodegradable packaging materials are usually based on proteins, polysaccharides and liquids, or a combination of these, which are natural and sustainable.2Proteins play an important role in film-forming agents due to their superior physical and mechanical properties, as well as their nutritional value.3,4 Peanut is an important oil crop in the US and worldwide. Peanut meal is an under-used, low-priced byproduct of the peanut oil industry, and is primarily used for animal feed.5 Peanut protein isolate (PPI), extracted from peanut meal, has a higher protein content and better functional properties than other peanut protein products, which could be used to develop films.6 However, because of their significant hydrophilicity and poor mechanical properties compared with synthetic films, the properties of peanut protein films must be improved. Chemical, physical and enzymatic treatments of proteins and addition of plasticizers are methods that have been widely and successfully used to improve the mechanical properties of protein films.7
Because of the requirements of consumers regarding the quality, safety and preservative-free nature of food, active compounds, like antioxidants and/or antimicrobial agents, have been added to edible and biodegradable films.8–11 Some studies have demonstrated that some essential oils and their components, which are extracted from various aromatic plants, have strong antioxidant and antimicrobial properties.12–14 Therefore, they have been incorporated into edible films to act against food-borne pathogens and increase the shelf-life of food. Thymol (TML), which is a major component of essential oils from oregano and thyme, has shown wide-spectrum antimicrobial activity against Gram-negative and Gram-positive bacteria, as well as fungi.15,16 TML is classified as GRAS (generally recognized as safe), and it is used as a safe food additive in the United States and Europe.17 TML was successfully added into chitosan/polyethylene, polylactic acid, zein nanofibers and polypropylene to make antimicrobial and antioxidant films.18–21
Increasing research has been undertaken into edible antimicrobial films based on soy protein, chitosan and zein.22–24 However, few edible antimicrobial films based on PPI have been developed. This work was undertaken to optimize the constituents of PPI film using transglutaminase (TG) for improvement of its mechanical properties. The study also aimed to evaluate the physical, mechanical, antioxidant, and antimicrobial properties of modified PPI films containing different concentrations of TML.
2 Material and methods
2.1 Materials
Defatted peanut meals were provided by Qingdao longevity food Co., Ltd (Shandong, China). Thymol (99.5%), 2,2-diphenyl-1-picrylhydrazyl (DPPH) radical, polyoxyethylene sorbitan mono-oleate (Tween 80), glycerol were obtained from Sigma-Aldrich (St. Louis, MO, USA). Transglutaminase (TG), 3713 U g−1 powder, was provided by Dongsheng Food Technology Co., Ltd. (Taizhou, China). The other reagents were purchased from Sinopharm Chemical Reagent Co., Ltd., China.2.2 Preparation of peanut protein isolate (PPI)
PPI was prepared from the defatted peanut meal according to the method of Liu et al.25 with slight modifications. Defatted peanut meal was totally dispersed in a 10-fold volume of deionized water, and the pH was adjusted to 9.0 with 1 N NaOH, and stirred at 65 °C in a water bath for 30 min, then centrifuged in a CR21G high-speed centrifuge (Hitachi Co., Japan) at 8000 × g for 20 min to remove the insoluble material. The supernatants were acidified to pH 4.5 with 1 N HCl and centrifuged at 8000 × g for 10 min. The precipitates were rewashed until pH was adjusted to 7.0, and then freeze-dried to obtain PPI.2.3 Preparation of modified PPI
8% (w/v) PPI solution was dispersed in distilled water, the pH was adjusted to 9.0 and then the solution was heated to 70 °C for 60 min. After cooling down to room temperature, TG was added to the solution at a ratio of 5 U g−1 of protein. Then the mixture solution was thoroughly stirred for 30 min in a thermostatic water bath at 50 °C. After that, the reaction was stopped by placing the solution in a water bath at 85 °C for 20 min, and then cooled to 30–40 °C to obtain the modified PPI.2.4 Preparation of edible films
Film solution was prepared by casting. Glycerol was added as a plasticizer at 15% of the protein. Then, tween 80 at 0.2% (v/v) was added as an emulsifier to assist TML dissolution. After that, thymol (TML) was separately added to the solution at various concentrations of 0% (control), 0.5%, 1%, 1.5% and 2% (w/v) while homogenized (IKA, T25 basic, Germany) at 13![[thin space (1/6-em)]](https://www.rsc.org/images/entities/char_2009.gif) 000 rpm for 5 min to obtain emulsions. The film-forming solutions were degassed under vacuum for 10 min to remove air bubbles. The final film-forming solutions were poured in framed square glass plates (15 × 15 cm2) and dried at 65 °C for 3 h. The dried films were peeled off and conditioned in a ventilated climatic chamber (KBF 240 Binder, ODIL, France) at 25 °C and 55% relative humidity before testing. Thicknesses of films were measured with a digital micrometer (no. 293-5, Mitutoyo, Japan) and the average was taken 120 ± 5 μm.
000 rpm for 5 min to obtain emulsions. The film-forming solutions were degassed under vacuum for 10 min to remove air bubbles. The final film-forming solutions were poured in framed square glass plates (15 × 15 cm2) and dried at 65 °C for 3 h. The dried films were peeled off and conditioned in a ventilated climatic chamber (KBF 240 Binder, ODIL, France) at 25 °C and 55% relative humidity before testing. Thicknesses of films were measured with a digital micrometer (no. 293-5, Mitutoyo, Japan) and the average was taken 120 ± 5 μm.
2.5 Film analysis
where Δm/Δt is the weight loss of moisture per unit of time (g s−1), A is the film area exposed to the moisture transfer (1.08 × 10⁻³ m2), e is the film thickness (m), and ΔP is the water vapor pressure difference across the two sides of the film specimen (kPa). Three replicates for each film were carried out.
where Abs600 is the value of absorbance at 600 nm and x is the film thickness (mm).
2.5.5.1 Microbial strains. Escherichia coli (ATCC 25922), Staphylococcus aureus (ATCC 29213), Lactobacillus plantarum (ATCC 4008) and Pseudomonas aeruginosa (ATCC 27853) were used in this study.
2.5.5.2 Determination of minimal inhibitory concentration (MIC) and minimal bactericidal concentration (MBC) of TML in an in vitro condition. The MIC and MBC of TML against four studied microorganisms (E. coli, S aureus, P. aeruginosa and L. plantarum) were determined in vitro using broth microdilution method.28–30 Serial dilutions of antimicrobial agents (3000; 1500; 1250; 1000; 750; 625; 500; 375; 312.5; 250 mg l−1) were prepared in sterile TSB for the bacteria (E. coli, S aureus, P. aeruginosa), and in sterile MRS for the bacteria (L. plantarum). A control tube without antimicrobial agents was inoculated to test microbial growth and another tube containing only broth medium was ensure no possible contaminations. MIC is defined as the lowest concentration (mg l−1) of TML at which the growth of the microorganism is prevented, and MBC is defined as the lowest concentration (mg l−1) of TML at which the incubated microorganism is killed.
2.5.5.3 Antimicrobial properties of the films. To determine the antimicrobial properties of the films, the agar diffusion method was used. The nutrient agar medium in Petri dish was inoculated with 100 μL 105 to 106 cfu ml−1 bacteria. The prepared films were cut into 10 mm diameter discs using a hole-puncher and then placed on inoculated agar. L. plantarum was incubated in MRS broth at 28 °C for 24 h. E. coli, S. aureus and P. aeruginosa were incubated in tryptic soy broth at 37 °C for 24 h. The diameter of the inhibition zone was measured in mm using a caliper.22
2.6 Statistical analysis
All experimental designs were performed in triplicate and data were analyzed by variance (ANOVA) using SPSS (version 12.1, SPSS, Chicago, IL, USA). Values are expressed as means ± SD. Statistical significance between means was determined using Duncan's multiple range tests and the significant difference between treatments set at the 95% confidence level.3 Results and discussion
3.1 Mechanical properties
Fig. 1 shows stress–strain curves of films. Notably, film containing TML was more rigid than the control film. This behavior was possibly due to TML having low affinity toward water. Table 1 summarizes the results of incorporating TML in different proportions on the mechanical properties of modified PPI films. The incorporation of TML at low concentration (0.5% w/v) resulted in increased TS and E compared with the control (p > 0.05). However, TML incorporation above 1% concentration resulted in a significant decrease of the TS and E of the film (p < 0.05). Since TML formed a non-miscible emulsified phase, the protein chains segregated to constitute a protein-rich phase. We suggested that the addition of a low concentration of TML to the modified PPI film matrix would favor protein–protein interactions. According to previous study, adding higher concentration of hydrophobic agents to a film may result in lower flexibility and resistance to fracture due to the structure with less mobility,33 which may explain why film incorporating TML above 1% concentration had decreased TS and E. Similar results were also obtained for whey edible protein films with added almond and walnut oils,34 and TML was added to novel nanobiocomposite films based on poly(lactic acid).35 The results showed the observed mechanical changes were not dramatic decreased, and that adding low content of TML did not interfere with the applicability of the developed films.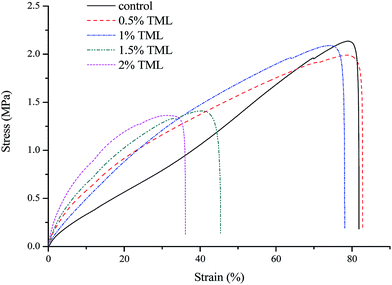 | ||
| Fig. 1 Stress–strain curves of modified PPI films incorporated with different amounts of thymol (TML). | ||
| TML (% w/v) | Tensile strength (MPa) | E (%) | WVP (g mm kPa−1 h−1 m−2) |
|---|---|---|---|
| a Values are given as mean ± standard deviation. Different letters in the same column indicate significantly different (p < 0.05) when analyzed by Duncan's new multiple range test. | |||
| 0 (control) | 2.17 ± 0.04a | 82.80 ± 2.76a | 2.10 ± 0.10a |
| 0.5 | 2.22 ± 0.03a | 84.45 ± 1.90a | 1.61 ± 0.08b |
| 1 | 2.17 ± 0.03a | 78.91 ± 1.81a | 1.48 ± 0.06b |
| 1.5 | 1.52 ± 0.06b | 44.77 ± 4.68b | 1.17 ± 0.08c |
| 2 | 1.26 ± 0.16c | 37.72 ± 3.07c | 1.15 ± 0.08c |
3.2 Water vapour permeability (WVP)
The addition of TML into modified PPI film led to lower WVP values than the control film, and a decreasing tendency of WVP with increasing TML concentration was also observed. This result may be explained by the hydrophobic nature of TML, which affects the hydrophilic/hydrophobic balance of the film.36 Similar results were found in PLA-based films containing TML, and chitosan films incorporated with carvacrol.37,38 However, other works found that the addition of essential oils caused no changes in WVP,39,40 or that the addition of essential oils improved WVP.36,41 Therefore, it cannot be assumed that the WVP values of edible films are reduced easily by adding hydrophobic constituents into the film matrix. Since the primary function of food packaging is to avoid or reduce moisture transfer between the surrounding atmosphere and the food, the WVP should be as low as possible. Our results indicated that modified PPI film with TML could potentially be used for food packaging by enhancing water resistance.3.3 Opacity and color parameters
Color and opacity are important factors that influence consumers in buying a food product. The color and opacity parameters of each film are shown in Table 2. Compared to the control film, films incorporating TML were less transparent since the opacity increased. The opacity of the film samples significantly increased with increasing TML concentration (p < 0.05). This finding is in agreement with Ramos et al.42 It could be ascribed to the presence of polyphenols in the films.43| TML (% w/v) | Opacity (A mm−1) | Color | ||
|---|---|---|---|---|
| L* | a* | b* | ||
| a Values are given as mean ± standard deviation. Different letters in the same column indicate significantly different (p < 0.05) when analyzed by Duncan's new multiple range test. | ||||
| 0 (control) | 1.52 ± 0.05d | 77.68 ± 0.81a | 4.19 ± 0.18ab | 21.47 ± 0.82bc |
| 0.5 | 2.76 ± 0.08c | 81.48 ± 1.31a | 2.79 ± 0.07b | 19.08 ± 0.69c |
| 1 | 3.07 ± 0.13b | 78.70 ± 1.90a | 3.09 ± 0.49b | 23.94 ± 0.66b |
| 1.5 | 3.11 ± 0.03b | 79.07 ± 3.41a | 3.07 ± 1.30b | 22.64 ± 2.81b |
| 2 | 3.44 ± 0.02a | 72.51 ± 4.69b | 5.59 ± 1.34a | 29.13 ± 0.58a |
There was no significant difference among L*, a* and b* values of the modified PPI films containing TML, except for the film containing 2% (w/v) TML, which had a lower L* and higher b* value (p < 0.05), indicating that the film became yellowish and darker. These results suggested that adding low concentrations of TML did not influence the film color, but incorporating high concentrations of TML could change the color of the film. Similar tendencies in color have been reported that incorporating 3% (v/v) ZEO in starch films decreased L* and increased b*.44 Although essential oils can affect the optical properties of film, they might have advantages as antioxidants due to the yellowish color protecting food products from light.39 According to data obtained in this study, modified PPI film added TML should be acceptable for use as see-through packaging.
3.4 Antimicrobial activity of TML
The antimicrobial activity of TML was assessed against four bacteria by determining the minimal inhibitory concentration (MIC) and minimal bactericidal concentration (MBC) values. As Table 3 shows, the MICs of TML toward Gram-positive bacteria (250–500 mg l−1) were lower than those toward Gram-negative bacteria (500–650 mg l−1). Regarding MBC, P. aeruginosa and E. coli needed the same concentration to kill bacterial cells (3000 mg l−1), while L. plantarum and S. aureus needed 1250 and 1000 mg l−1 respectively. Therefore, TML was more effective against the Gram-positive L. plantarum and S. aureus than against the Gram-negative E. coli and P. aeruginosa in terms of both MIC and MBC values. This may be because the cell wall structures of these bacteria are different, the cell walls of Gram-negative bacteria include lipopolysaccharides, which may restrict active components from reaching the cytoplasmic membrane.45,46 The results are different from those of Guarda et al.,47 who reported TML had the same antimicrobial activity against S. aureus and E. coli (MIC = 250 ppm). According to Atef et al.,48 TML was more effective against E. coli than P. aeruginosa and S. aureus based on MBC value. These differences may be due to the use of different methods to obtain TML and/or differences in protocols of the antimicrobial measurements.| Bacteria | MIC (mg l−1) | MBC (mg l−1) |
|---|---|---|
| E. coli | 500 | 3000 |
| S. aureus | 250 | 1000 |
| P. aeruginosa | 650 | 3000 |
| L. plantarum | 500 | 1250 |
3.5 Antimicrobial properties
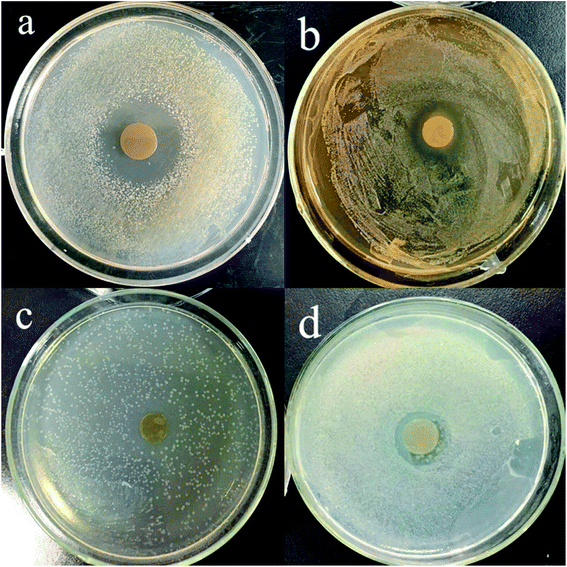
Inhibition zone diameters of modified PPI based edible film disks containing various concentrations of TML (0, 0.5, 1, 1.5 and 2%) against test bacteria are shown in Table 4. No inhibition zone was observed for the control film (without TML). Adding TML into films led to inhibition of all test bacteria even at the minimum concentration (0.5%) applied into the film formulation. As the concentration increased, the zones of inhibition increased significantly in a concentration-dependent manner (p < 0.05). Fig. 2 shows the inhibition zones obtained with modified PPI films containing 2% TML against S. aureus, L. plantarum, E. coli and P. aeruginosa. At all concentrations assayed, S. aureus showed the largest inhibition zones (p < 0.05) with values between 22.23 and 32.62 mm (including the film disc), followed by L. plantarum and E. coli with statistically significant differences (p < 0.05) between them. P. aeruginosa was the most resistant bacterium (p < 0.05), with inhibition zones 13.01–19.55 mm (including the film disc). The results were in agreement with previous reports that Gram-positive bacteria are more sensitive than Gram-negative bacteria to essential oils and their components.12,48 It was reported that pullulan films containing TML gave rise to their largest inhibition haloes for Gram-positive bacteria (B. subtilis and S. aureus) and their smallest inhibition haloes for Gram-negative bacteria (E. coli and S. enteritidis).49 It was also reported that polypropylene films containing TML were more effective against S. aureus than E. coli.50| TML (% w/v) | Inhibition zone (mm) | |||
|---|---|---|---|---|
| E. coli | S. aureus | P. aeruginosa | L. plantarum | |
| a Values are given as mean ± standard deviation. Different letters in the same column indicate significantly different (p < 0.05) when analyzed by Duncan's new multiple range test. ND, not detected. | ||||
| 0 (control) | ND | ND | ND | ND |
| 0.5 | 13.73 ± 0.65c | 22.23 ± 0.23c | 13.01 ± 0.53c | 16.19 ± 0.22d |
| 1 | 16.93 ± 0.49b | 22.48 ± 0.54c | 16.55 ± 0.24b | 16.85 ± 0.27c |
| 1.5 | 20.13 ± 0.49a | 29.59 ± 0.57b | 19.55 ± 0.09a | 19.56 ± 0.20c |
| 2 | 20.79 ± 0.38a | 32.62 ± 0.45a | 20.05 ± 0.47a | 21.17 ± 0.26a |
The mechanism of the inhibitory effect of TML on the growth of various microorganisms is not completely known, but several studies have shown that the antimicrobial activity of TML involves inner and outer membrane disruption, and interaction with intracellular targets and membrane proteins. The interactions affect cell membrane permeability, evidenced by cellular uptake of ethidium bromide, loss of membrane potential, ATP, leakage of potassium ions, and carboxyfluorescein.16,51,52
It should be also noted that the inhibitory effect of TML included in film matrices was lower than that of pure TML, which may due to partial loss of volatile compounds during film manufacturing.36 However, our results show that TML can be successfully immobilized in modified PPI films and consequently released, thereby inhibiting target microorganisms.
3.6 Total phenolic content (TPC) and antioxidant activity
The TPC and antioxidant activity values of modified PPI films are shown in Fig. 3 and 4. Phenolic compounds are suggested to be the most active antioxidant extracts from plants.53 The total phenolic content and antioxidant activity of some medicinal plant infusions were analyzed, which showed a significant linear correlation between total phenolic content and antioxidant activity.54,55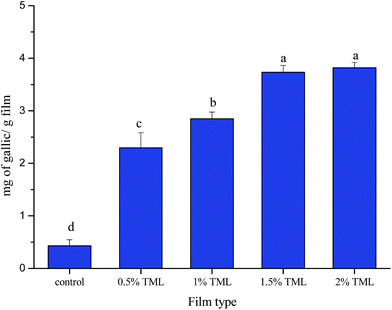 | ||
| Fig. 3 Total phenolics contents of modified PPI films incorporated with different amounts of thymol (TML). Different letters indicate a statistically significant difference (P < 0.05). | ||
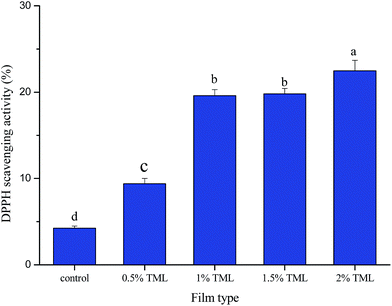 | ||
| Fig. 4 DPPH scavenging activity of PPI modified films incorporated with different amounts of thymol (TML). Different letters indicate a statistically significant difference (P < 0.05). | ||
In the present study, total phenolic activity varied from 0.43 to 3.82 mg gallic acid per g film, and antioxidant activity changed from 4.25 to 22.47%. The results showed that TPC in the modified PPI films significantly increased (p < 0.05) with increasing TML concentration. As expected, the antioxidant activity of the films increased progressively with addition of TML. The highest TPC and antioxidant activity was found in the film containing 2% TML, the values were 8.88-times and 5.29-times greater than those in the control film, respectively. Previous studies have also found that TML has antioxidant activity, and the addition of TML to film matrix conferred antioxidant ability on the film.56,57 The present study confirms those findings.
3.7 Fourier transform infrared (FTIR) spectra analysis
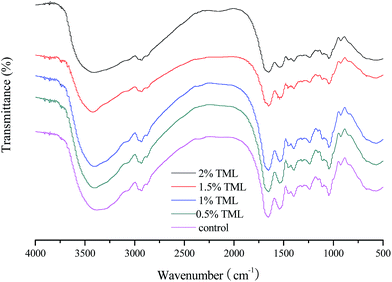
The FTIR spectra of modified PPI-based films with and without TML showed similar major peaks, but the amplitudes of the peaks varied depending on the amount of TML incorporated (Fig. 5). The absorption bands at 3650–3200 cm−1 and 2930 cm−1 correspond to the stretching vibration of free hydroxyl and the stretching vibration of C–H, respectively. The characteristic bands of the film at approximately 1654, 1542, and 1241 cm−1 are assigned to the amide-I (C![[double bond, length as m-dash]](https://www.rsc.org/images/entities/char_e001.gif) O stretching), amide-II (N–H bending) and amide-III (N–H bending and C–N stretching) bands, respectively. The band observed at 1044 cm−1 arises from an –OH group, mainly from glycerol added as a plasticizer.58
O stretching), amide-II (N–H bending) and amide-III (N–H bending and C–N stretching) bands, respectively. The band observed at 1044 cm−1 arises from an –OH group, mainly from glycerol added as a plasticizer.58
It can be seen from the FTIR spectra that as the amount of TML progressively added, the absorbance associated with –OH group (3650–3200 cm−1) and N–H bending (amide-II at 1542 cm−1 and amide-III at 1241 cm−1) vibrations gradually decreased, which could be due to a particular arrangement in the films resulting from the interaction of TML with hydroxyl and amino groups in modified PPI. This result could explain to some degree the mechanical properties and WVP of the films with TML incorporated.
3.8 Films morphology
Fig. 6 shows micrographs of the film surfaces. The control film had a smooth and continuous structure. As compared to control film, the presence of TML made the film slightly rougher. Though TML caused discontinuities in the film matrix, the surface showed dense structure associated with TML as a hydrophobic agent. Similar results were observed for chitosan films with added cinnamon essential oil, and chitosan films with added carvacrol and grape seed extract.59,60 Pores can be seen in Fig. 5d, which might due to the evaporation of TML during dehydration.61 We postulate that the film microstructure could be related to the lower WVP of films containing TML compared with the control film.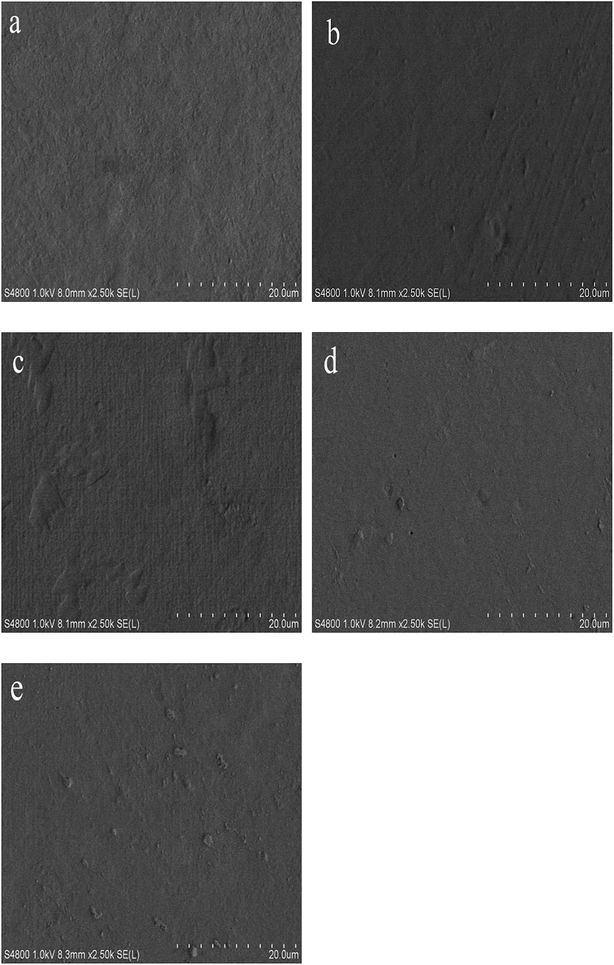 | ||
| Fig. 6 Scanning electron micrographs of the surface of modified PPI films incorporated with different amounts of thymol (TML): (a) control, (b) 0.5% TML, (c) 1% TML, (d) 1.5% TML, (e)2% TML. | ||
4 Conclusions
The incorporation of thymol into modified peanut protein isolate matrix was successfully performed to obtain biodegradable films. Modification of PPI film by adding thymol (TML) significantly improved (i.e. lowered) water vapor permeability, and increased antioxidant and antimicrobial activity. Addition of a low concentration of TML did not affect the mechanical properties of the film or its color, although high concentrations of TML negatively affected film mechanical properties and made the films darker. Based on our results, modified peanut protein isolate films incorporating TML have the potential to be used in the food industry as antimicrobial and antioxidant packaging materials.Conflicts of interest
There are no conflicts to declare.Acknowledgements
This work was supported by the Liaoning Provincial Nature Science Foundation of China (2013020067).References
- M. A. Rojas-Graü, R. Soliva-Fortuny and O. Martín-Belloso, Trends Food Sci. Technol., 2009, 20, 438–447 CrossRef.
- S. F. Hosseini, M. Rezaei, M. Zandi and F. Farahmandghavi, Ind. Crops Prod., 2015, 67, 403–413 CrossRef CAS.
- X. Li, N. Ji, C. Qiu, M. Xia, L. Xiong and Q. Sun, Ind. Crops Prod., 2015, 77, 565–574 CrossRef CAS.
- C. Na, Y. Fu and J. He, Food Hydrocolloids, 2007, 21, 1153–1162 CrossRef.
- G. Su, J. Ren, Y. Bao, C. Cui and M. Zhao, Food Chem., 2011, 126, 1306–1311 CrossRef CAS.
- H. Wu, Q. Wang, T. Ma and J. Ren, Food Res. Int., 2009, 42, 343–348 CrossRef CAS.
- M. Wihodo and C. I. Moraru, J. Food Eng., 2013, 114, 292–302 CrossRef CAS.
- M. P. Arrieta, M. A. Peltzer, J. López, M. D. C. Garrigós, A. J. M. Valente and A. Jiménez, J. Food Eng., 2014, 121, 94–101 CrossRef CAS.
- X. Liu, Z. Liu, L. Wang, S. Zhang and H. Zhang, RSC Adv., 2017, 7, 13707–13713 RSC.
- A. Valdés, A. C. Mellinas, M. Ramos, N. Burgos, A. Jiménez and M. C. Garrigós, RSC Adv., 2015, 5, 40324–40335 RSC.
- M. Masoomi, M. Tavangar and S. M. R. Razavi, RSC Adv., 2015, 5, 79200–79206 RSC.
- S. Burt, Int. J. Food Microbiol., 2004, 94, 223–253 CrossRef CAS PubMed.
- R. Chizzola, H. Michitsch and C. Franz, J. Agric. Food Chem., 2008, 56, 6897–6904 CrossRef CAS PubMed.
- K. Feng, P. Wen, H. Yang, N. Li, W. Y. Lou, M. H. Zong and H. Wu, RSC Adv., 2017, 7, 1572–1580 RSC.
- P. S. Chavan and S. G. Tupe, Food Control, 2014, 46, 115–120 CrossRef CAS.
- R. J. W. Lambert, P. N. Skandamis, P. J. Coote and G. J. E. Nychas, J. Appl. Microbiol., 2001, 91, 453–462 CrossRef CAS PubMed.
- P. Suppakul, J. Miltz, K. Sonneveld and S. W. Bigger, J. Food Sci., 2003, 68, 408–420 CrossRef CAS.
- S. Koosehgol, M. Ebrahimianhosseinabadi, M. Alizadeh and A. Zamanian, Mater. Sci. Eng., C, 2017, 79, 66–75 CrossRef CAS PubMed.
- K. Boonruang, N. Kerddonfag, W. Chinsirikul, E. J. Mitcham and V. Chonhenchob, Food Control, 2017, 78, 85–93 CrossRef CAS.
- Z. Aytac, S. Ipek, E. Durgun, T. Tekinay and T. Uyar, Food Chem., 2017, 233, 117–124 CrossRef CAS PubMed.
- M. Ramos, A. Beltrán, M. Peltzer, A. J. M. Valente and M. D. C. Garrigós, LWT–Food Sci. Technol., 2014, 58, 470–477 CrossRef CAS.
- E. Zehra Karagöz, Y. Gökçe Polat, C. Betül Kodal and C. Kezban, Meat Sci., 2010, 86, 283–288 CrossRef PubMed.
- T. Li, W. Hu, J. Li, X. Zhang, J. Zhu and X. Li, Food Control, 2012, 25, 101–106 CrossRef CAS.
- M. Moradi, H. Tajik, S. M. R. Rohani and A. Mahmoudian, LWT–Food Sci. Technol., 2016, 72, 37–43 CrossRef CAS.
- Y. Liu, G. Zhao, M. Zhao, J. Ren and B. Yang, Food Chem., 2012, 131, 901–906 CrossRef CAS.
- T. H. Mchugh, R. Avenabustillos and J. M. Krochta, J. Food Sci., 2006, 58, 899–903 CrossRef.
- J. P. Maran, V. Sivakumar, R. Sridhar and K. Thirugnanasambandham, Carbohydr. Polym., 2013, 92, 1335 CrossRef CAS PubMed.
- M. Turgis, K. D. Vu, C. Dupont and M. Lacroix, Food Res. Int., 2012, 48, 696–702 CrossRef CAS.
- D. Dussault, K. D. Vu and M. Lacroix, Meat Sci., 2014, 96, 514–520 CrossRef CAS PubMed.
- S. Shankar, L. Jaiswal, S. Periasamy, K. S. Ham and J. W. Rhim, RSC Adv., 2016, 6, 67340–67352 RSC.
- E. A. Ainsworth and K. M. Gillespie, Nat. Protoc., 2007, 2, 875–877 CrossRef CAS PubMed.
- S. Ubonrat and H. Brucer, Food Hydrocolloids, 2010, 24, 770–775 CrossRef.
- S. N. L. Laura, V. MaríA, G. L. N. Chelo, C. Amparo and C. F. Maite, Food Hydrocolloids, 2009, 23, 2102–2109 CrossRef.
- S. Galus and J. Kadzińska, Food Hydrocolloids, 2016, 52, 78–86 CrossRef CAS.
- M. Ramos, A. Jiménez, M. Peltzer and M. C. Garrigós, Food Chem., 2014, 162, 149–155 CrossRef CAS PubMed.
- S. Benavides, R. Villalobos-Carvajal and J. E. Reyes, J. Food Eng., 2012, 110, 232–239 CrossRef CAS.
- M. Ramos, E. Fortunati, M. Peltzer, A. Jimenez, J. M. Kenny and M. C. Garrigós, Polym. Degrad. Stab., 2016, 132, 2–10 CrossRef CAS.
- M. A. López-Mata, S. Ruizcruz, N. P. Silva-Beltrán, J. J. Ornelaspaz, P. B. Zamudioflores and S. E. Burruelibarra, Molecules, 2013, 18, 13735 CrossRef PubMed.
- P. Klangmuang and R. Sothornvit, Food Hydrocolloids, 2016, 61, 609–616 CrossRef CAS.
- L. Atarés, R. Pérezmasiá and A. Chiralt, J. Food Eng., 2011, 104, 649–656 CrossRef.
- S. F. Hosseini, M. Rezaei, M. Zandi and F. Farahmandghavi, Ind. Crops Prod., 2015, 67, 403–413 CrossRef CAS.
- M. Ramos, E. Fortunati, M. Peltzer, A. Jimenez, J. M. Kenny and M. C. Garrigós, Polym. Degrad. Stab., 2016, 132, 2–10 CrossRef CAS.
- G. Yuan, H. Lv, B. Yang, X. Chen and H. Sun, Molecules, 2015, 20, 11034–11045 CrossRef CAS PubMed.
- M. Ghasemlou, N. Aliheidari, R. Fahmi, S. Shojaee-Aliabadi, B. Keshavarz, M. J. Cran and R. Khaksar, Carbohydr. Polym., 2013, 98, 1117–1126 CrossRef CAS PubMed.
- M. Vaara, Microbiol. Rev., 1992, 56, 395–411 CAS.
- B. Ouattara, R. E. Simard, R. A. Holley, J. P. Piette and A. Bégin, Int. J. Food Microbiol., 1997, 37, 155 CrossRef CAS PubMed.
- A. Guarda, J. F. Rubilar, J. Miltz and M. J. Galotto, Int. J. Food Microbiol., 2011, 146, 144 CrossRef CAS PubMed.
- M. Atef, M. Rezaei and R. Behrooz, Food Hydrocolloids, 2015, 45, 150–157 CrossRef CAS.
- M. Gniewosz and A. Synowiec, Flavour Fragrance J., 2011, 26, 389–395 CrossRef CAS.
- M. Ramos, A. Jiménez, M. Peltzer and M. C. Garrigós, J. Food Eng., 2012, 109, 513–519 CrossRef CAS.
- J. Xu, F. Zhou, B. P. Ji, R. S. Pei and N. Xu, Lett. Appl. Microbiol., 2008, 47, 174 CrossRef CAS PubMed.
- B. J. Juven, J. Kanner, F. Schved and H. Weisslowicz, J. Appl. Bacteriol., 1994, 76, 626–631 CrossRef CAS PubMed.
- W. Bors, C. Michel and K. Stettmaier, Methods Enzymol., 2001, 335, 166 CAS.
- Y. M. Pan, K. Wang, S. Huang, H. S. Wang, X. M. Mu, C. H. He, X. W. Ji, J. Zhang and F. J. Huang, Food Chem., 2008, 106, 1264–1270 CrossRef CAS.
- C. C. Huang, H. F. Wang, C. H. Chen, Y. J. Chen and K. H. Yih, J. Cosmet. Sci., 2011, 62, 393 CAS.
- G. Kavoosi, S. M. Dadfar and A. M. Purfard, J. Food Sci., 2013, 78, E244 CrossRef CAS PubMed.
- M. Davoodi, G. Kavoosi and R. Shakeri, Int. J. Biol. Macromol., 2017, 104, 173–179 CrossRef CAS PubMed.
- M. S. Hoque, S. Benjakul and T. Prodpran, J. Food Eng., 2010, 96, 66–73 CrossRef CAS.
- O. Seyedmahdi, R. Masoud, R. Seyedhadi and H. Seyedmohamadhashem, J. Biotechnol., 2010, 122, 161–166 Search PubMed.
- J. F. Rubilar, C. Rms, H. D. Silva, A. A. Vicente, I. Khmelinskii and M. C. Vieira, J. Food Eng., 2013, 115, 466–474 CrossRef CAS.
- M. Jouki, S. A. Mortazavi, F. T. Yazdi and A. Koocheki, Carbohydr. Polym., 2014, 99, 537–546 CrossRef CAS PubMed.
| This journal is © The Royal Society of Chemistry 2017 |


