
 Open Access Article
 This Open Access Article is licensed under a
 Creative Commons Attribution 3.0 Unported Licence
Phytochemical content, cellular antioxidant activity and antiproliferative activity of Adinandra nitida tea (Shiyacha) infusion subjected to in vitro gastrointestinal digestion†
Yongsheng Chen *ab,
Xiang Mac,
Xiong Fub and
Rian Yan*a
*ab,
Xiang Mac,
Xiong Fub and
Rian Yan*a
aDepartment of Food Science and Engineering, Jinan University, 601 Huangpu Avenue West, 510632, Guangzhou, China
bSchool of Food Science and Engineering, South China University of Technology, 381 Wushan Road, 510641, Guangzhou, China
cResearch School of Chemistry, Institute of Advanced Studies, The Australian National University, Canberra, ACT 2601, Australia
First published on 30th October 2017
Abstract
Adinandra nitida tea (Shiyacha) is a traditional eminent and flourishing tea with a long history in Southeast Asia. However, transformation of phytochemicals of A. nitida tea infusion during in vitro simulated digestions is vague. Herein, we investigated cellular antioxidant and antiproliferative activity of phytochemicals obtained from A. nitida tea infusion subjected to in vitro gastrointestinal conditions. Phenolic, flavonoid, flavonol, and anthocyanin contents found in A. nitida tea infusion were evaluated by normal colorimetric methods. Subsequently, the main compounds were determined by high-performance liquid chromatography. The antioxidant activity was evaluated based on peroxyl radical scavenging capacity (PSC), oxygen radical absorbance capacity (ORAC), and cellular antioxidant activity (CAA). The antiproliferative activity towards Caco-2 cells was determined by the cell methylene blue colorimetric assay. It was found that in simulated gastrointestinal fluids, the contents of phenolics and flavonols increased, whereas the contents of flavonoids and anthocyanins decreased. Moreover, the content of (−)-epigallocatechin and camellianin B increased, whereas that of L-epicatechin, quercitrin, and camellianin A decreased. Furthermore, the oxygen radical scavenging capacity and cellular antioxidant activity values increased, whereas the PSC values decreased. Most importantly, the gastrointestinal fluids of A. nitida tea infusion exhibited a strong antiproliferative activity towards Caco-2 cells and affected caspase 3/9 signaling pathway, and apoptosis induction might serve as the underlying mechanism for this antiproliferative activity. It can be concluded that A. nitida tea infusion may act as a potential intracellular antioxidant and colon cancer cell proliferation inhibitor.
Introduction
As is well known, gastrointestinal digestion can change the bioavailability of nutrients, for example, it makes some food components bioavailable for intestinal absorption;1 in general, digestion, absorption, and metabolism in body transform the bioavailability of food ingredients. Therefore, besides search and characterization of phytochemicals, investigation of the bioactive properties of phytochemicals in food is of significant importance. Theoretically, the best approaches to evaluate these properties involve animal models and studies in humans; however, exploration studies on bioavailability in humans or animals are highly sophisticated, costly, and time-consuming. By contrast, in vitro gastrointestinal models are facile, economic, and reliable and have gained extensive attention; moreover, recently, different successful applications of these models have been reported. Helal et al. confirmed the release of phenol from coating films, and this phenol remained biologically active during the in vitro digestion process.2 Lamothe et al. evaluated the interaction effects of green tea extract on the digestibility of different dairy matrices in a simulated gastrointestinal environment.3Non-camellia teas are common commercial beverage materials. Owing to their antioxidant, hypotensive, antibacterial, and hypolipidemic activities, non-camellia teas have received increasing interest.4 Adinandra nitida tea, a kind of non-camellia tea, has prevailed in South East Asia for hundreds of years, and its consumption is still increasing. Similarly, it has been reported that A. nitida tea possesses many bioactive properties: it reduces blood pressure and exhibits anti-inflammatory, antibacterial, antitumor, analgesic, and antitoxic effects.5 Camellianin A is an important bioactive constituent of A. nitida and easily metabolized into camellianin B, which has been proved in rat.6 Camellianin A has been reported to inhibit the proliferation of HepG2 and MCF-7 cells; moreover, it not only induces the increase of G0/G1 cell population, but also leads to cell apoptosis.7 To the best of our knowledge, although many studies have stated the effects of in vitro gastrointestinal digestion on the bioactivity of various tea products, there are very few studies on the beneficial effects of gastrointestinal digestion on the bioavailability of A. nitida tea compounds.
In this study, we explored the transformation of the phytochemicals in A. nitida tea by an in vitro model under simulated physiological conditions (pH, temperature, and gastric and pancreatic enzymes). Subsequently, changes in the five main individual flavonoid compounds of A. nitida tea infusion as well as the cellular antioxidant activity of A. nitida tea infusion after gastrointestinal digestion were studied. Subsequently, HepG2 cell model and Caco-2 cells were employed to study the antioxidant and antiproliferative activity of the phytochemicals of A. nitida tea infusion before and after digestion. This study shows the bioavailability of A. nitida tea infusion compounds under simulated digestion conditions and provides a basis for the further development of A. nitida tea-based functional foods.
Results and discussion
Phytochemical degradation after digestion
To the best of our knowledge, enzymatic digestion is an effective way to release phenolic compounds from food since enzymes can hydrolyze the linkages between phenolic compounds and other moieties or degrade wall polysaccharides.8As presented in Fig. 1(1), initially, the total phenolic content in A. nitida tea was 121.31 ± 2.50 mg GAE/g of DW. By contrast, after the DW samples were subjected to simulated gastric digestion in vitro, the total phenolic content increased to 137.41 ± 1.98 mg GAE/g of DW samples, increasing by 16.10 mg GAE/g of DW (a 13.27% increase). In addition, there was a significant increase in the total phenolic content to 169.55 ± 1.00 mg GAE/g of DW (a 39.76% increase) after 2 h of intestinal digestion. This can be ascribed to the fact that phenolics may be released under the action of enzymes in the gastrointestinal environment.9,10 Chen et al. also found that after simulated digestion, the total phenolic content in ice tea (Master Kong) and ice tea (Unified) significantly increased (P < 0.05).11
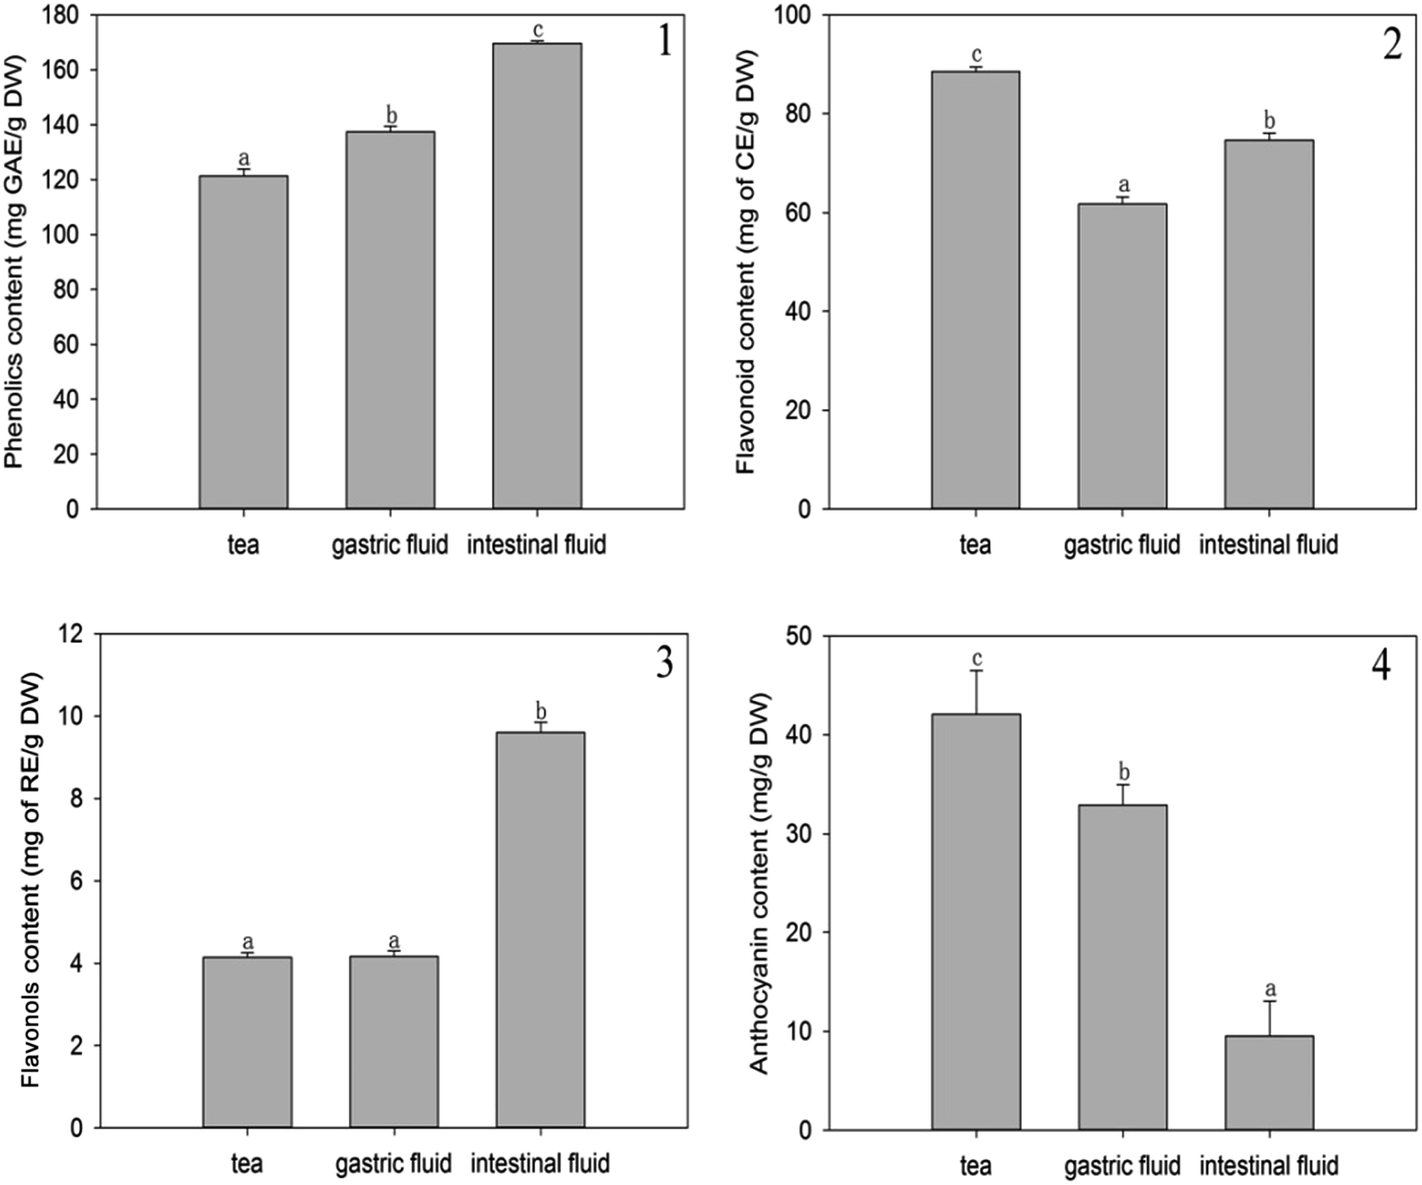 | ||
| Fig. 1 Phenolic content (1), flavonoid content (2), flavonol content (3), and anthocyanin content (4) of A. nitida tea after in vitro digestion. | ||
As shown in Fig. 1(2), unlike the case for phenolics, simulated digestion led to a decrease in the flavonoid content. Originally, the total flavonoid content in A. nitida tea was 88.51 ± 0.88 mg CE/g of DW, but after in vitro simulated gastric digestion, the total flavonoid content decreased to 61.72 ± 1.47 mg CE/g of DW samples (a decrease of 26.79 mg CE/g of DW). Similarly, after 2 h of intestinal digestion, the total flavonoid content decreased by 15.67% to 74.64 ± 1.46 mg CE/g DW. Most flavonoids in A. nitida tea are generally glycosides12 and hydrolyzed in the gastrointestinal model; this may reduce the solubility of the end-product and lead to a lower flavonoid content as determined by the total flavonoid assay. Weathers et al.13 also found that the total flavonoid content was lower in the in vitro gastrointestinal models, and similarly, the flavonoid content in the intestinal stage was higher than that in the gastric stage.
It has been reported that the content of flavanols hardly changes in in vitro digestive models neither in the gastric portion nor in the small intestinal phase;14 however, in our study, according to Fig. 1(3), incubation followed by intestinal digestion significantly increased the content of flavanols more than double from 4.14 ± 0.11 to 9.60 ± 0.25 mg RE/g of DW. By contrast, gastric digestion had a slight impact on flavanol content, which exhibited a mere increase of 0.02 mg RE/g DW. The difference between the gastric and intestinal stages may be attributed to the breakdown of polymer network formed by flavanols bounding to polysaccharides or proteins by pancreatin in intestine.15 This in turn results in the release of flavanols.
As demonstrated in Fig. 1(4), the anthocyanin content decreased from 42.08 ± 4.42 to 32.90 ± 2.06 mg g−1 of DW after gastric digestion. In the subsequent intestinal digestion, there was a significant decrease in the anthocyanin content, which was less than a quarter of the original content (9.50 ± 3.57 mg g−1). This can be attributed to the fact that anthocyanins are sensitive to simulated digestion conditions, especially to the alkaline environment of the intestinal medium.16 Similarly, Mosele et al. found that the anthocyanin content in Arbutus unedo decreased after in vitro digestion.17
Analysis of the main components
The main components in A. nitida tea were analyzed, and the results are listed in Fig. 2. It is clear that the effect of simulated digestion on the content of the main components varies. With regard to EGC, its content increased significantly by 2.68 mg g−1 during gastric digestion and by 6.02 mg g−1 during intestinal digestion. By contrast, although EC content decreased slightly after simulated digestion, it was still the richest component. Similarly, Record et al.18 reported that EC content in green or black tea bags decreased after in vitro gastric and intestinal digestion. However, Yoshino et al.19 found that EGC was rapidly degraded, whereas EC was relatively stable in the small intestine of mice. Camellianin B content increased in intestinal fluid to 28.20 ± 3.19 mg g−1 (a nearly 7-fold increase). Previous studies have shown that camellianin B is the major metabolite of camellianin A and easily transforms from camellianin A in vitro.20 Consequently, the content of camellianin B increases. Interestingly, the two types of digestion had different impacts on the camellianin A content: an increase of 6.95 mg g−1 was observed after gastric digestion, whereas a decrease of 14.49 mg g−1 was observed after intestinal digestion. In addition, the quercitrin content remained lowest regardless of the type of digestion.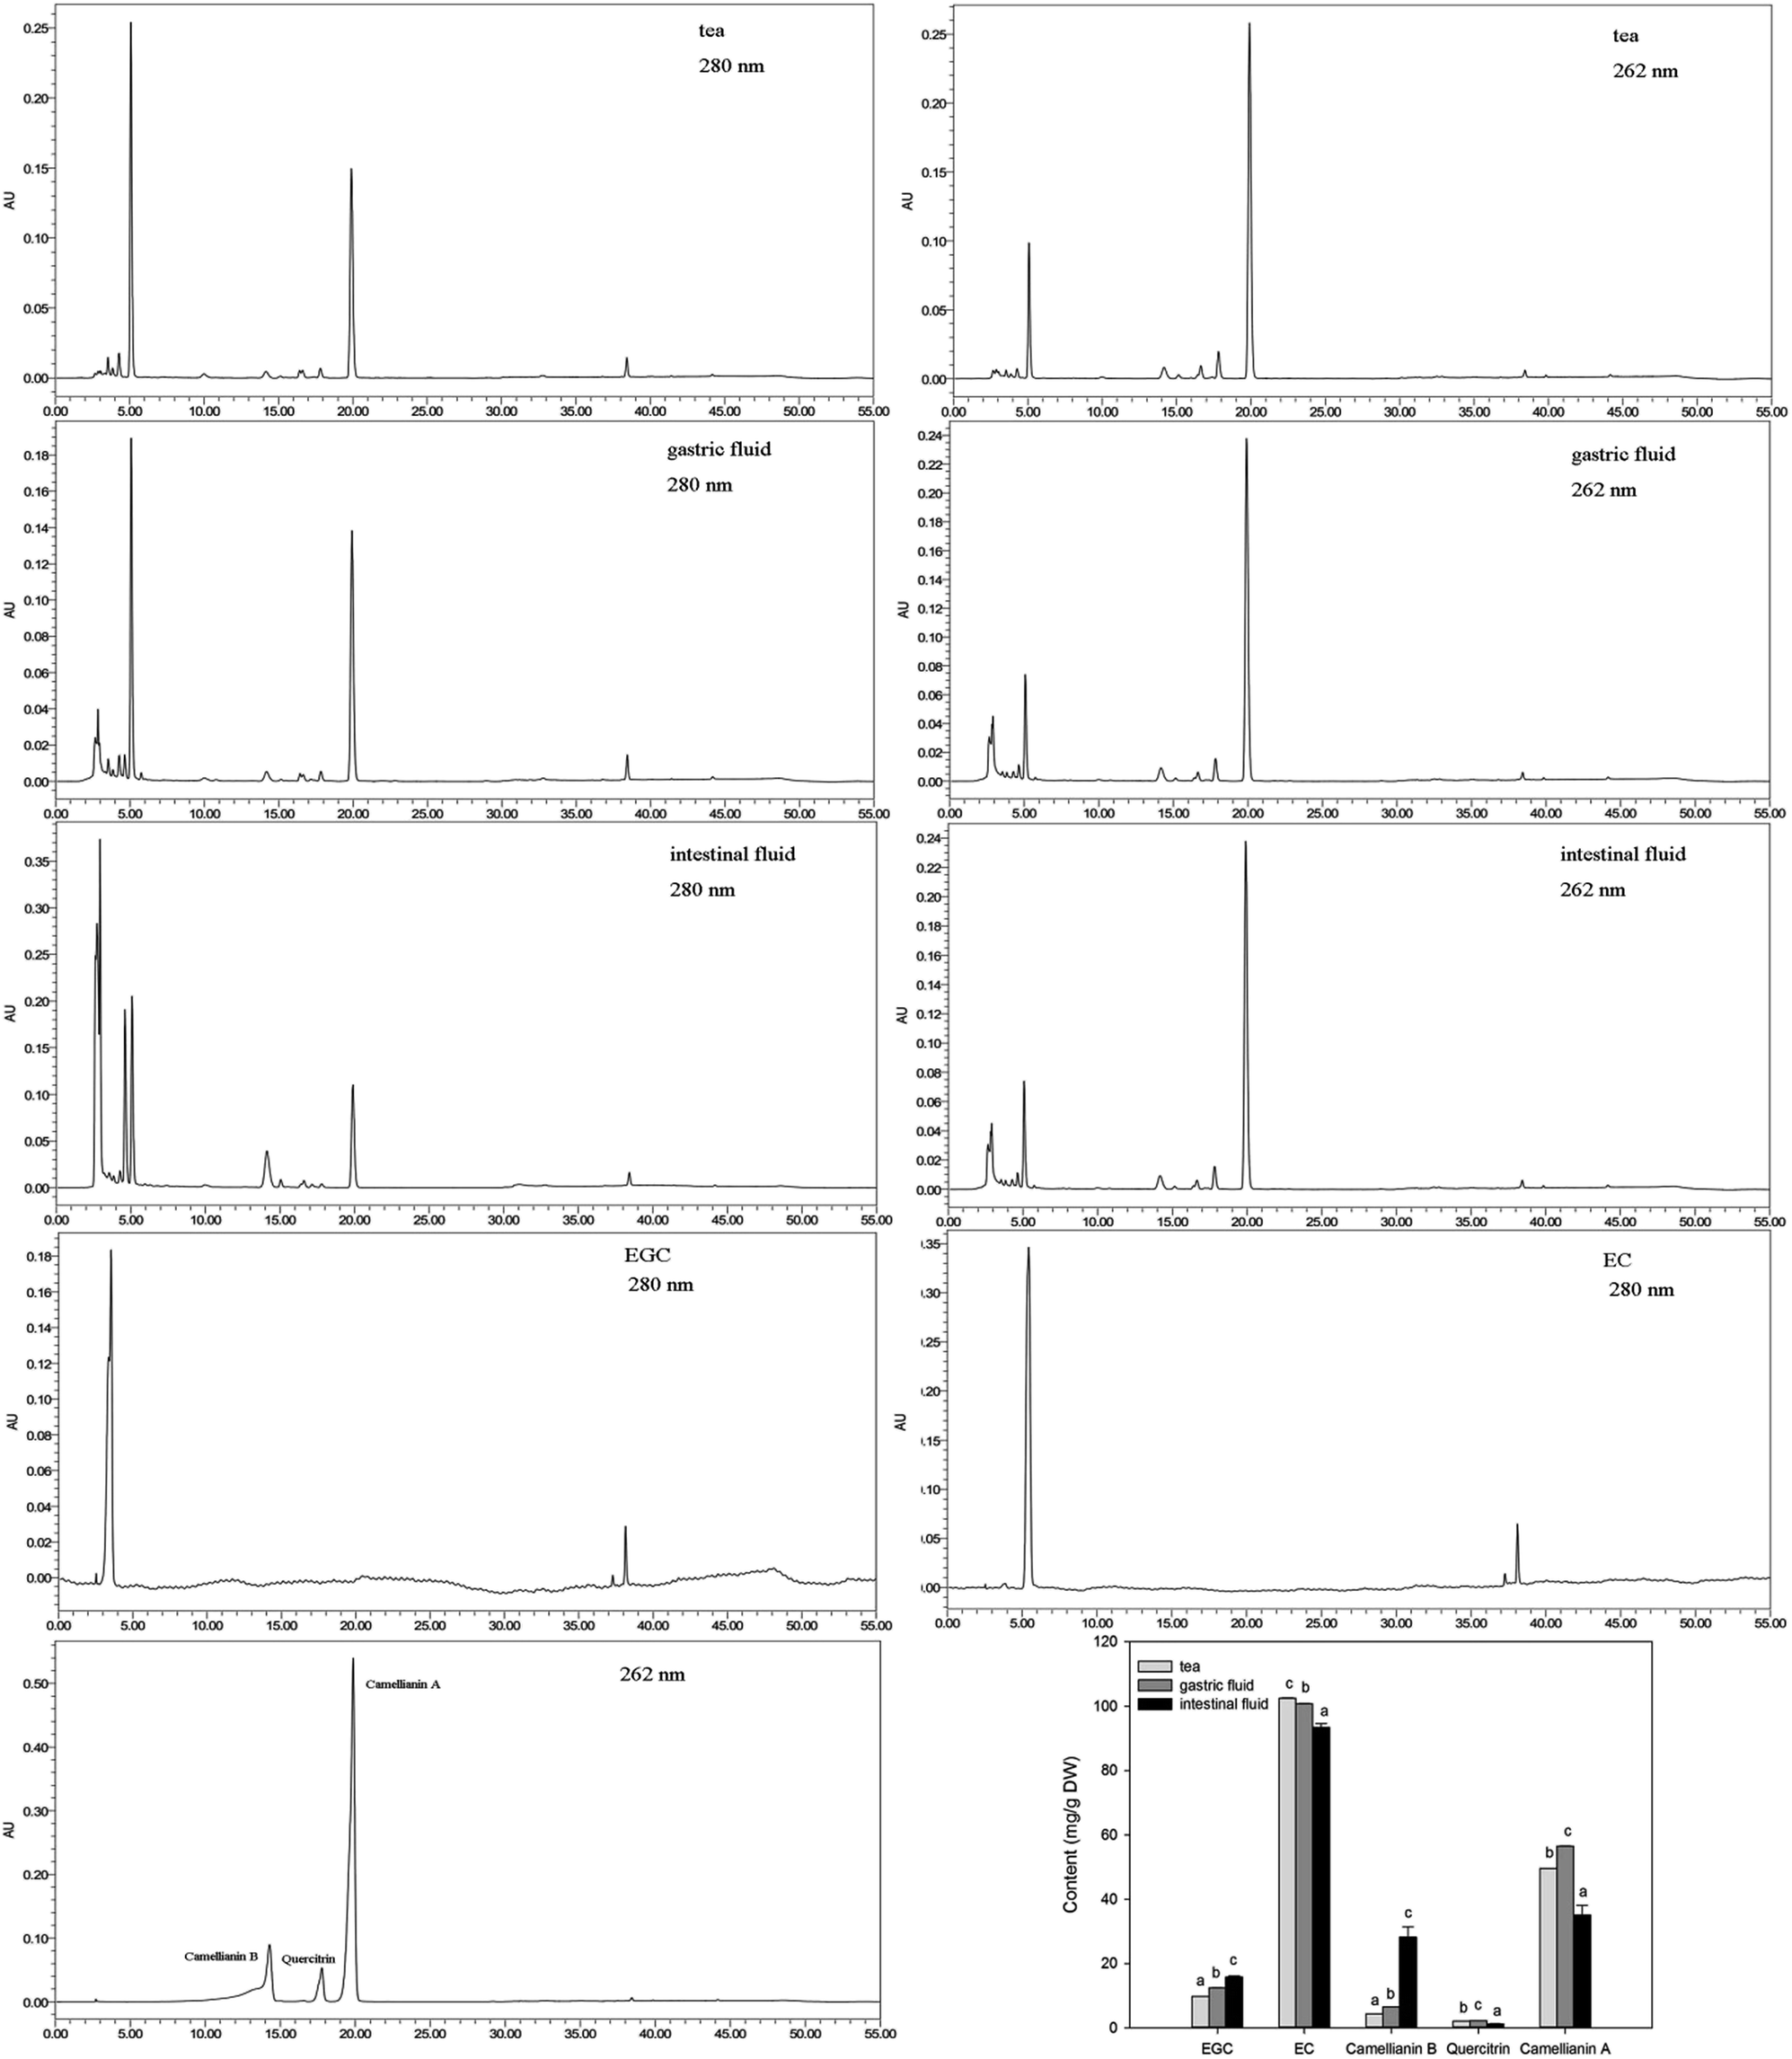 | ||
| Fig. 2 HPLC profile of the main components in A. nitida tea after in vitro digestion. | ||
Changes in the antioxidant activity of A. nitida tea after digestion
The changes in the antioxidant activity of A. nitida tea were evaluated based on the PSC, ORAC, and CAA values after simulated digestion (Fig. 3). The PSC, ORAC, and CAA values were determined in a buffered media (pH 7.4) similar to that of the human body; therefore, these values were reliable to investigate the changes in antioxidant activity after in vitro digestion without any interference due to pH variation.21–23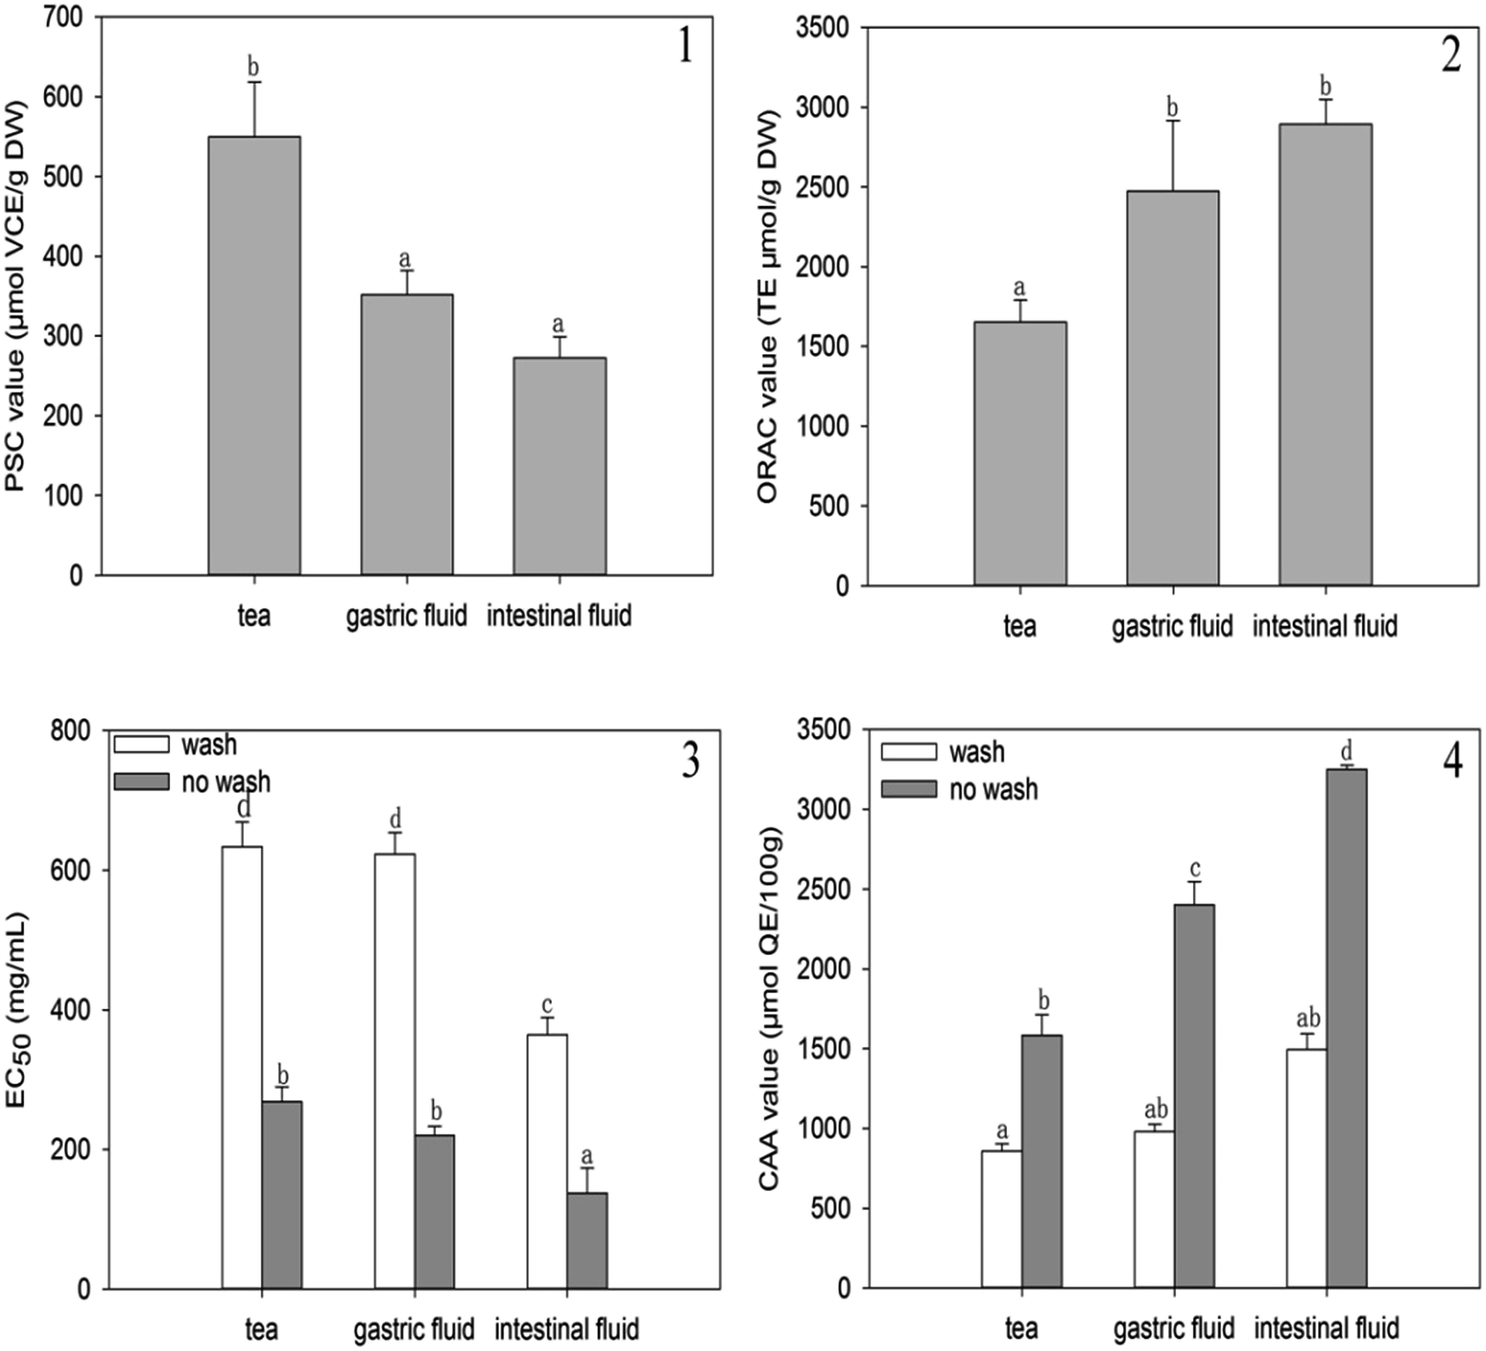 | ||
| Fig. 3 PSC values (1), ORAC values (2), EC50 (3), and CAA values (4) of A. nitida tea after in vitro digestion. | ||
In Fig. 3(1), it can be seen that the PSC value of A. nitida tea decreases after gastrointestinal digestion. In particular, the PSC antioxidant activity significantly decreased after intestinal digestion by over one half (277.17 μmol of VCE/g of sample DW) as compared to that of the untreated tea juice. The decreased PSC antioxidant activity suggests that after digestion, the compounds in A. nitida tea inhibit DCFH oxidation to a lesser extent due to a decreased peroxyl radical scavenging ability. Similarly, based on the PSC values, Krul et al.24 found that the antioxidant activity of green tea and black tea decreased in an in vitro gastrointestinal model. In fact, phenols may be degraded, thus losing some of their biological properties.1,25
ORAC value was also obtained to analyze changes in the antioxidant activity of A. nitida tea during the digestion process. As shown in Fig. 3(2), the ORAC antioxidant activity of A. nitida tea increased after simulated gastric and intestinal digestion; this suggested that A. nitida tea after digestion contained more phytochemicals for the absorption of oxygen radicals. Chen et al. reported that the ABTS antioxidant activity of jasmine honey tea juices increased in an in vitro digestion model.11 Free radicals are associated with the etiology of certain chronic diseases, and dietary antioxidants play a vital role in regulating the level of free radicals in the body. However, since the total in vitro antioxidant activity does not reflect the cellular physiological conditions and does not take the bioavailability and metabolism issues into consideration,26 the intracellular antioxidant activity of phytochemicals is more relevant. Therefore, the changes in intracellular antioxidant activity were investigated before and after digestion. To determine the level of A. nitida tea uptake by the cell and the permeability through the cell membrane, we determined the CAA values with and without washing the cells with PBS. As shown by the EC50 values (Fig. 3(3)) and the CAA values (Fig. 3(4)), both digestion processes induced similar effects in the ORAC assay. CAA increased for all samples after both acidic gastric and alkaline intestinal digestion. However, a more significant increase was observed after alkaline intestinal digestion for the sample without PBS wash, and a CAA value higher than twice as compared to that of the non-treated tea infusion was obtained.
These results indicate that the phytochemicals of A. nitida tea were more effectively adsorbed to the cell membrane in an intestinal environment. Similarly, Faller found that Feijoada27 whole meal had a higher CAA value after in vitro digestion than that without in vitro digestion.
Antioxidant activity and correlations with phytochemicals
Previous studies have stated that phenolics are generally distributed in tea, fruits, and vegetables and are the most important antioxidants.5,28 As listed in Table 1, the antioxidant activities measured by PSC, ORAC, and CAA assays displayed distinctively positive correlations with the phenolic content (r = 1.000, P = 0), close to those of Canadian lentil cultivars.29 Similarly, Chen et al. also reported the highly positive linear correlations between total polyphenol content and antioxidant activity (based on the ABTS and FRAP values).11 Remarkable correlations between flavonol content and increase in antioxidant activity were found with the ORAC values (r = 1.000, P = 0) as well as the CAA values (r = 1.000, P = 0). When the changes in antioxidant activity were studied via the PSC assay, a good correlation with total flavonoid content (r = 0.500, P = 0.667) was found, and a remarkable correlation with total anthocyanin content (r = 1.000, P = 0) was observed. By contrast, PSC value had a negative correlation with total flavonol content (r = −1.000, P = 0); with regard to the ORAC values, these were negatively correlated with the total flavonoid content (r = −0.500, P = 0.667) and the total anthocyanin content (r = −1.000, P = 0). Similarly, negative correlations were found between the CAA values and total flavonoid content (r = −0.500, P = 0.667) and total anthocyanin content (r = −1.000, P = 0). Therefore, based on the results shown in Table 1, the lack of positive correlation between the PSC assay results with those of the ORAC and CAA assays may be attributed to the presence of flavonoids, flavonols, and anthocyanins.| Phenolics | Flavonoids | Flavanols | Anthocyanins | PSC | ORAC | CAA (wash) | CAA (no wash) | |
|---|---|---|---|---|---|---|---|---|
| Phenolics | 1.000 | 0.500 | 1.000** | −1.000** | 1.000** | 1.000** | 1.000** | 1.000** |
| Flavonoids | 1.000 | −0.500 | 0.500 | 0.500 | −0.500 | −0.500 | −0.500 | |
| Flavanols | 1.000 | −1.000** | −1.000** | 1.000** | 1.000** | 1.000** | ||
| Anthocyanins | 1.000 | 1.000** | −1.000** | −1.000** | −1.000** | |||
| PSC | 1.000 | −1.000** | −1.000** | −1.000** | ||||
| ORAC | 1.000 | 1.000** | 1.000** | |||||
| CAA (wash) | 1.000 | 1.000** | ||||||
| CAA (no wash) | 1.000 |
Changes in proliferation during digestion
Colon plays a key role in the intestinal absorption of food components or drugs; however, the risk of colon cancer is high in males. Thus, exploration of phytochemicals in food that can inhibit human colon carcinoma cells is of great research interest. The in vitro antiproliferative activity of A. nitida tea compounds before and after digestion towards Caco-2 cells was evaluated. While non-treated tea infusion showed the weakest activity, tea infusion after both gastric and intestinal digestion exhibited an improved antiproliferative activity (Fig. 4). Particularly, the intestinal fluid had the strongest antiproliferative activity (EC50 = 312.31 μg mL−1), followed by the gastric fluid (EC50 = 3586.4 μg mL−1). Existing studies have explored the relationship between food phytochemicals and relative cancer risk. Cilla found that phenolic compounds obtained from grape-orange-apricot fruit beverages digests inhibited the proliferation of Caco-2 cells; this led to inhibition of the cell cycle in the S-phase and a decrease in the levels of both B1 and D1 cyclins.30 Chen proposed that polyphenols of blackberry after in vitro simulated gastrointestinal digestion exhibited positive effects on ameliorating ethyl carbamate-induced toxicity in Caco-2 cells.31 From our results, it may be inferred that through gastrointestinal digestion, A. nitida tea may become more capable of preventing colon cancer.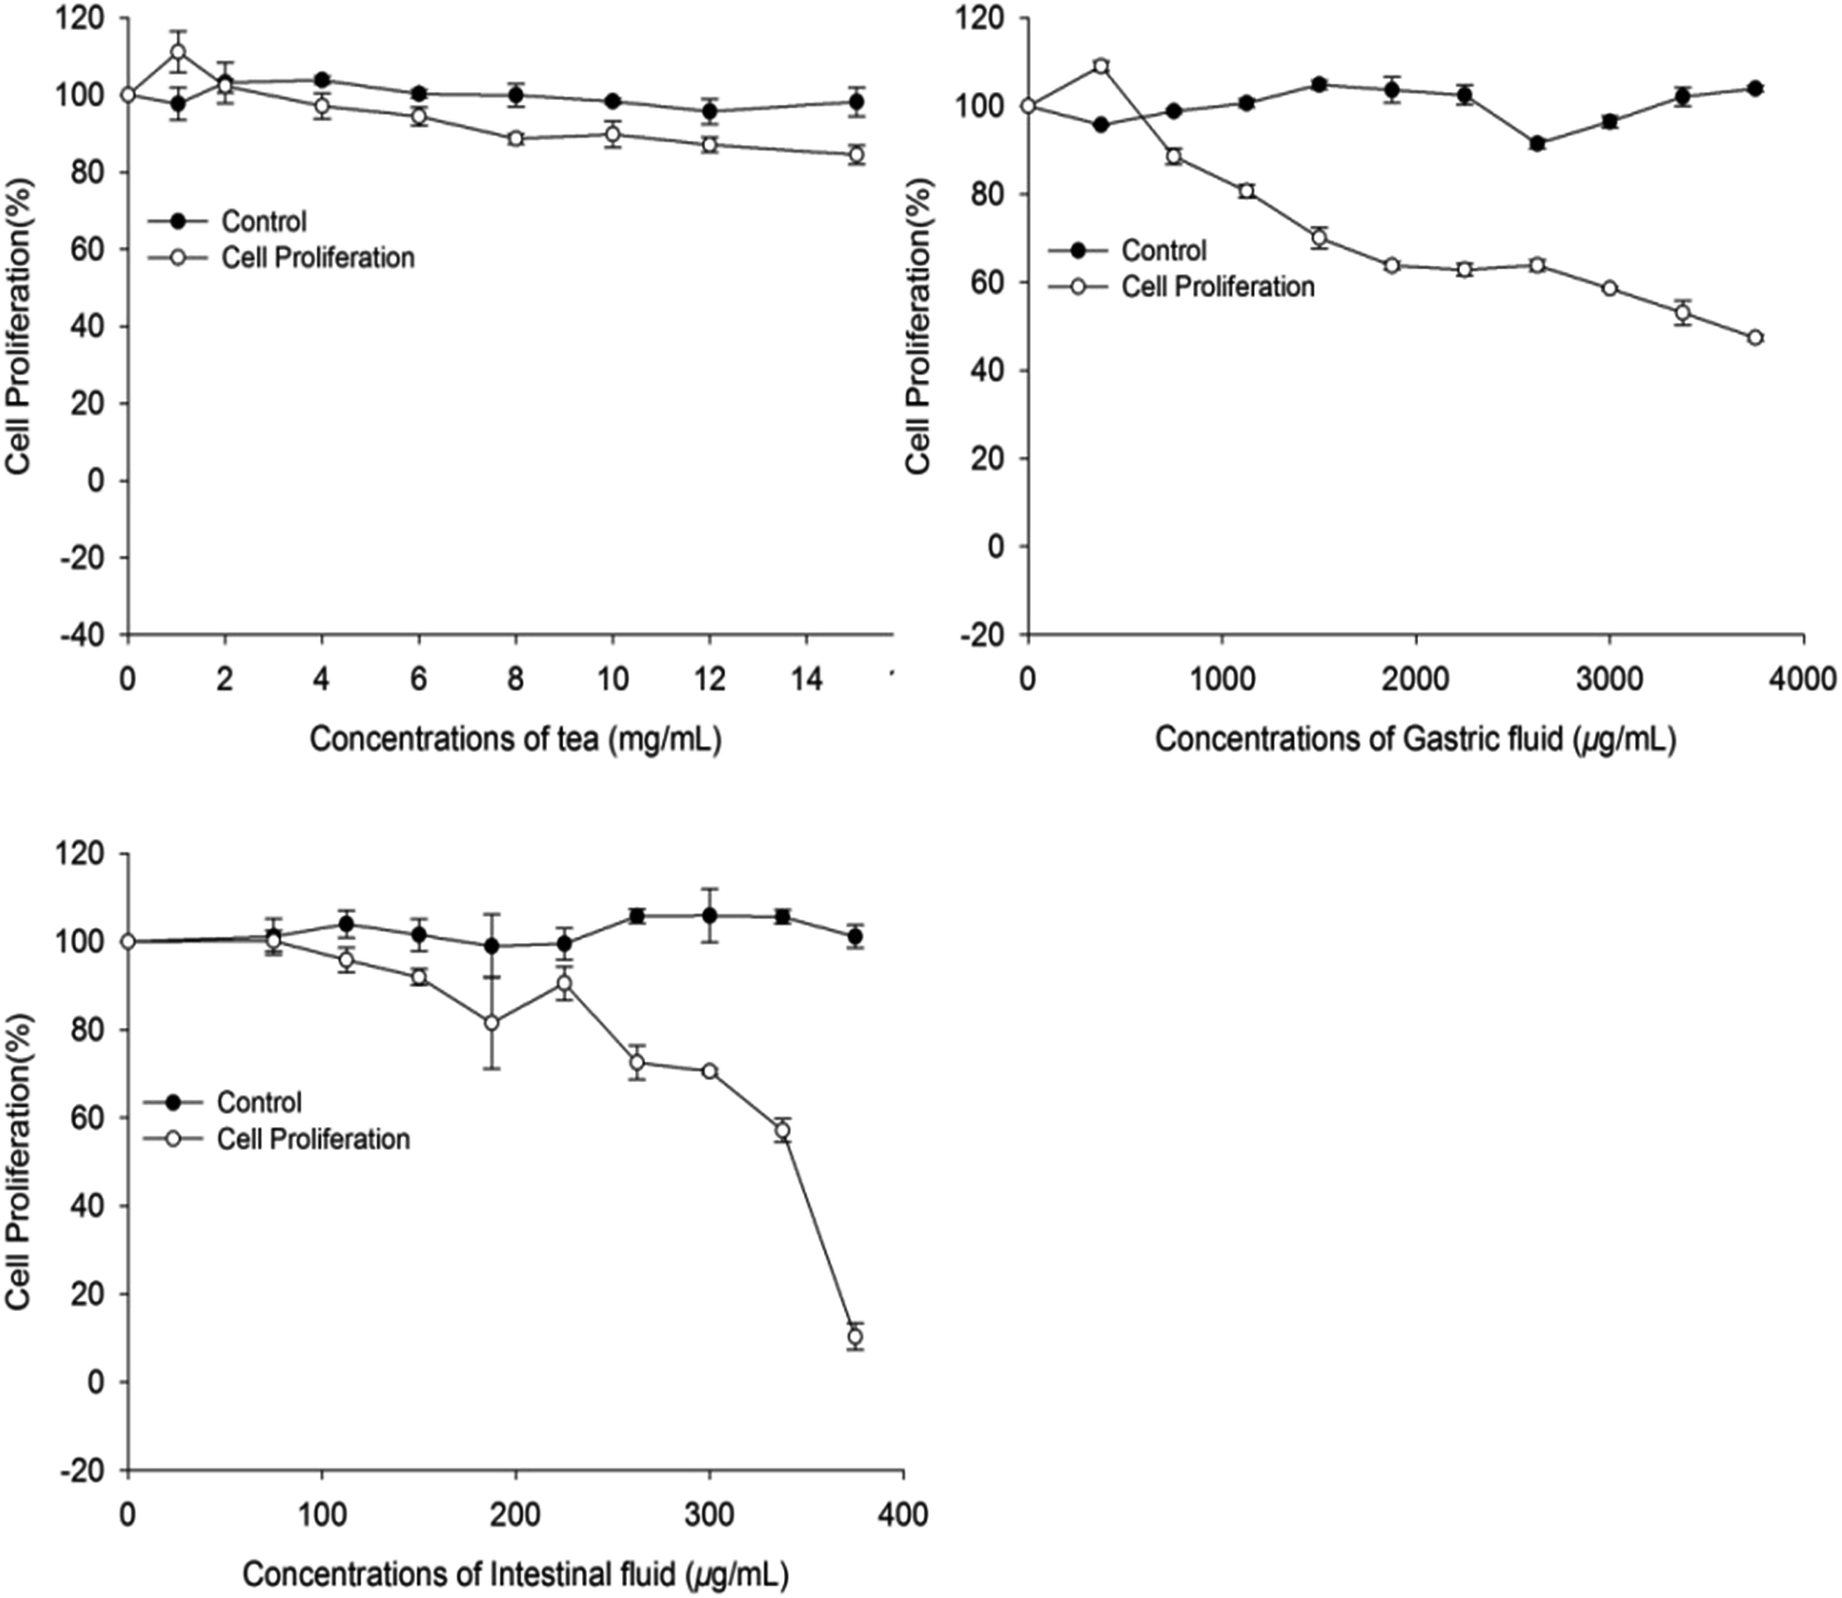 | ||
| Fig. 4 Percent inhibition of Caco-2 cell proliferation by A. nitida tea after in vitro digestion. | ||
Cell apoptosis by fluorescence microscopy and flow cytometry
Recent studies have reported that natural phytochemicals, such as phenols32 and polysaccharides,33 can inhibit proliferation and induce apoptosis in tumor cells. In our study, the intestinal fluid demonstrated a strong antiproliferative activity towards Caco-2 cells. To better confirm whether the inhibition of Caco-2 cell proliferation was associated with the induction of apoptosis, the role of intestinal digested fluids in Caco-2 cell death was investigated by flow cytometry with Annexin V-FITC and PI stains. As revealed in Fig. 5 and 6, the ratio of apoptotic cells, including early and late apoptotic cells, was 5.29% for non-treated cells. After treating the cells with intestinal digestion fluid at different concentrations, the percentages of early apoptotic cells increased from 5.55% to 6.21% in a dose-dependent manner. At the selected concentrations, the late apoptotic cell percentage for treated cells barely changed when compared with that of the non-treated group. As shown in Fig. 5 and 6, intestinal digestion fluid presented antiproliferative activity towards Caco-2 cells, and the cell apoptosis data demonstrated that the intestinal digestion fluid could induce early apoptosis in Caco-2 cells. | ||
| Fig. 5 Effect of A. nitida tea intestinal fluid on the apoptosis of Caco-2 cells studied using a fluorescence microscope. Color code: green, stained with Annexin V-FITC, early apoptotic cells; red: stained with PI, late apoptotic cells or necrotic cells; normal cells were not stained with Annexin V-FITC or PI. | ||
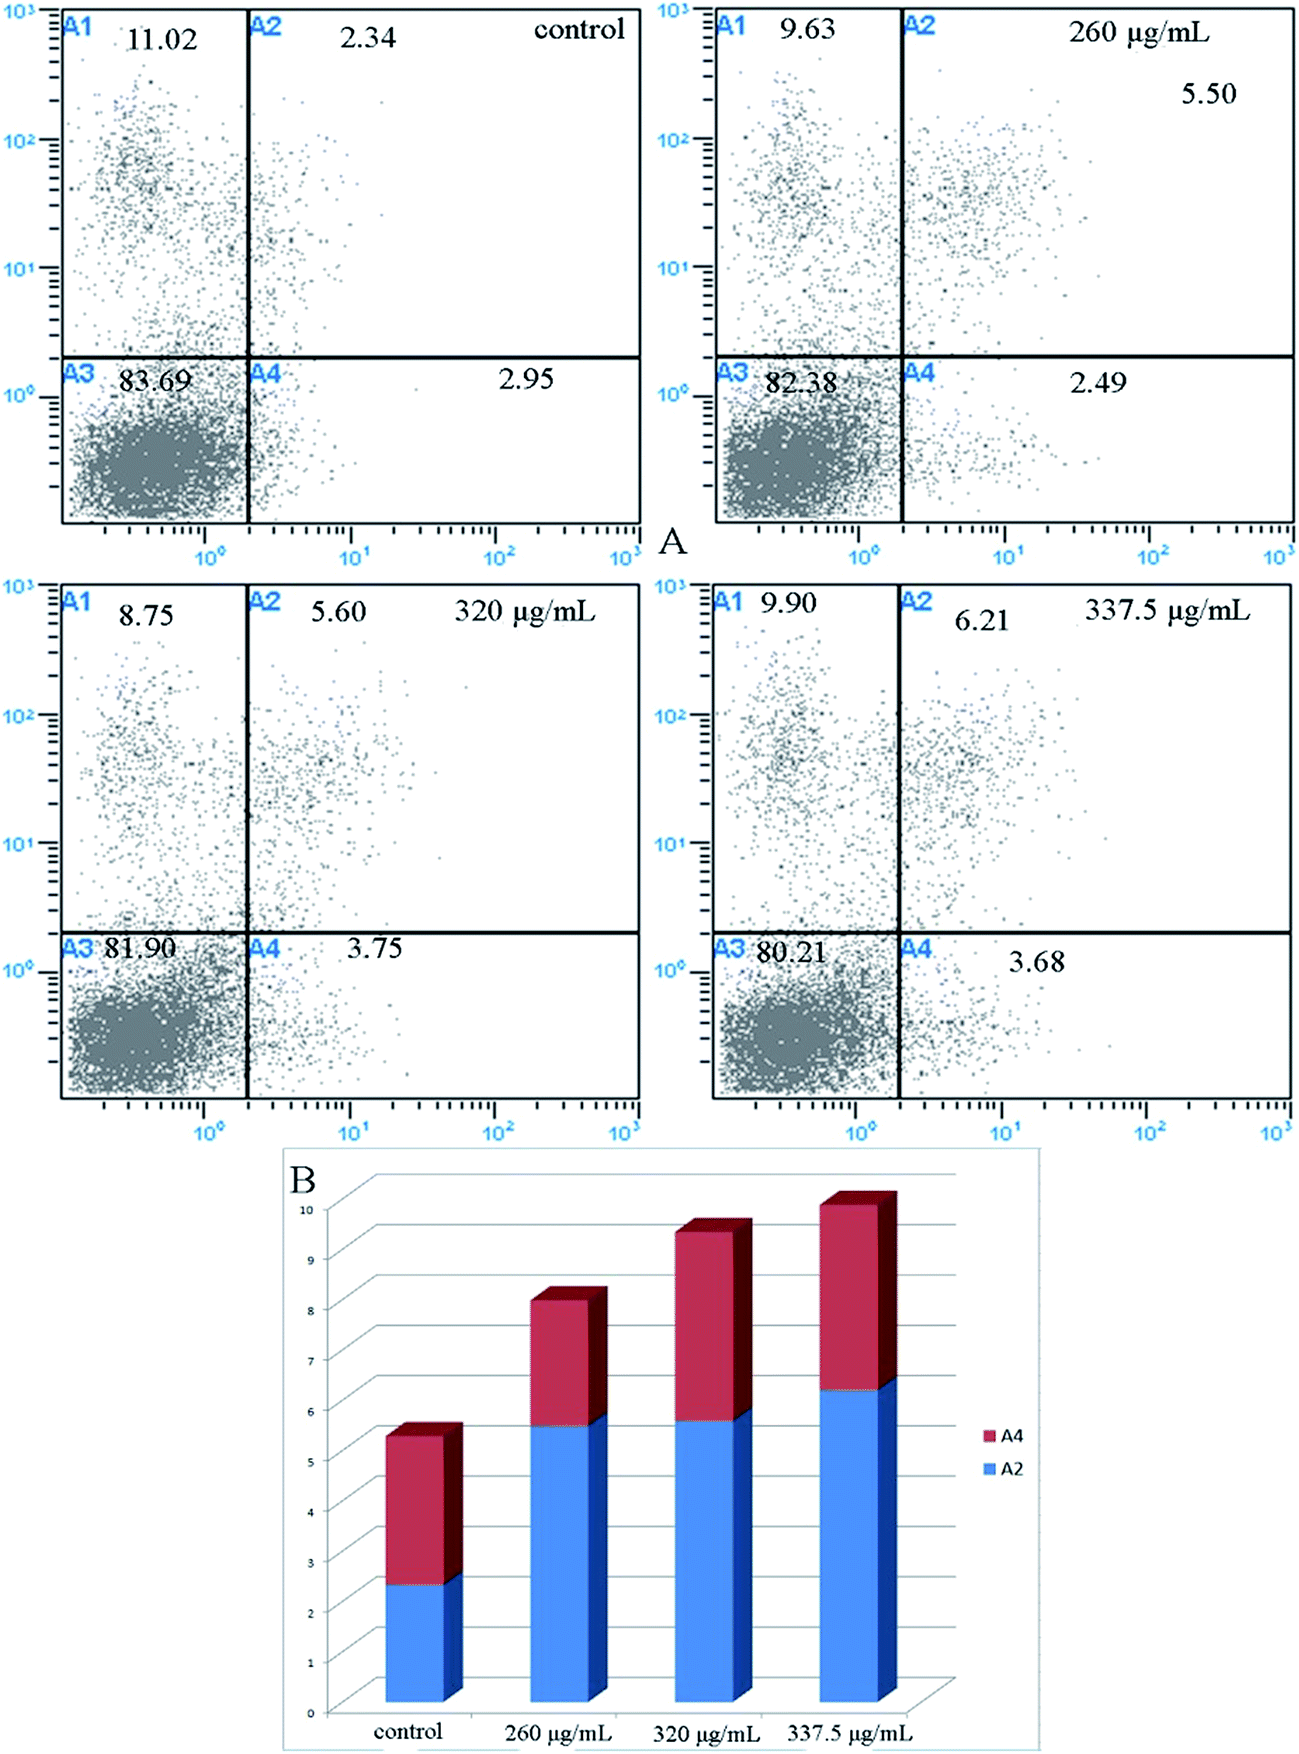 | ||
| Fig. 6 Representative dot plots for the flow cytometry analysis of Annexin V-FITC/PI-double-stained Caco-2 cells treated with A. nitida tea intestinal fluid at different concentrations (A), and apoptotic cell percentage (B). A1 denotes necrotic cells; A2 denotes late apoptotic cells; A3 denotes living cells; and A4 denotes the early apoptotic cells. | ||
Intestinal digestion activated caspase 3/9
Based on the flow cytometry results, the A. nitida tea intestinal fluid was found to induce early apoptosis in Caco-2 cells in a dose-dependent manner. This suggests that the apoptosis effect might be due to the anticancer mechanisms of A. nitida tea. To propose a mechanism for the enhanced apoptotic activity of the A. nitida tea intestinal digest, we evaluated the activity of some apoptotic enzymes, namely caspase 3/9, in Caco-2 cells before and after treatment with A. nitida tea intestinal digest. As presented in Fig. 7, caspase 3/9 activity in Caco-2 cells increased with intestinal digest concentration. Caspase-3 and caspase-9 are regarded as important proteases that are active during cell apoptosis. Caspase-3, which induces apoptosis, is a downstream factor activated by caspase-9 during cell apoptosis.34 In the control group, caspase-3 in the Caco-2 cells was rarely activated. However, in the A. nitida tea intestinal fluid treatment group, the activities of caspase-3 were generally increased in proportion to the A. nitida tea intestinal fluid concentration, presenting a good dose-dependent manner. Moreover, caspase-9 activity barely increased in the control group, whereas it exhibited a good dose-dependent relationship in the treated group. As shown in Fig. 7, caspase-3 activity was positively correlated with caspase-9 activity, and this was in agreement with other reports.35 These results demonstrate that A. nitida tea intestinal fluid may promote Caco-2 cell apoptosis through the caspase-9–caspase-3 signaling pathway to cause cell death.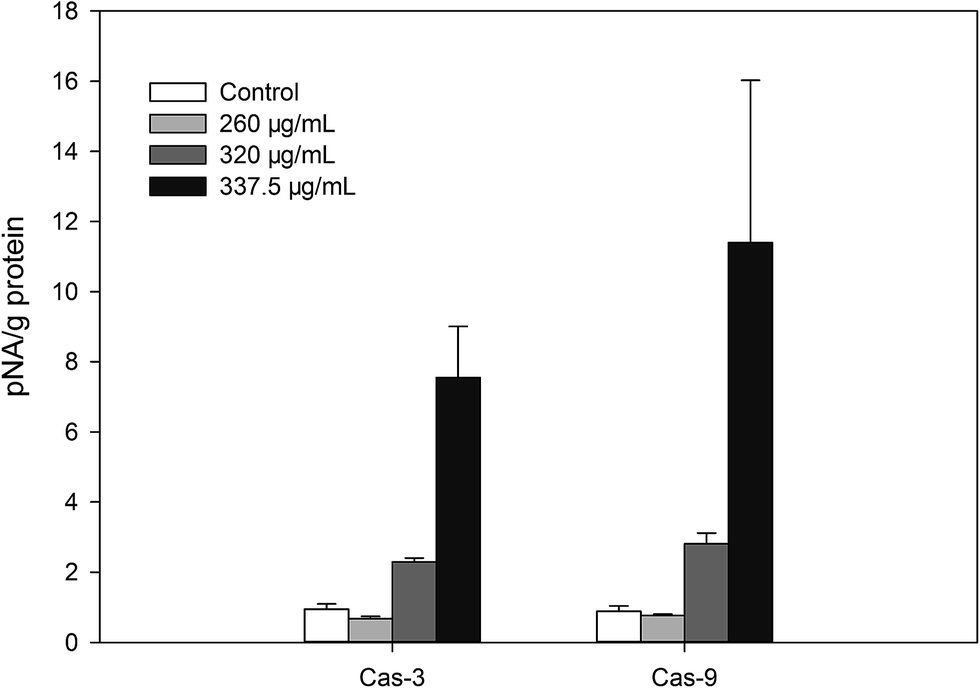 | ||
| Fig. 7 Caspase 3/9 activity in Caco-2 cells treated with A. nitida tea intestinal digests at different concentrations. | ||
Materials and methods
Chemicals and reagents
Gallic acid, catechin, fluorescein disodium salt, trolox, Folin-Ciocalteu reagent, pepsin, pancreatin, 2,2′-azobis-amidinopropane (ABAP), and dichlorofluorescein diacetate (DCFH-DA) were purchased from Sigma (St. Louis, U.S.). Vanillin, (−)-epigallocatechin (EGC), (−)-epigallocatechin gallate (EGCG), (−)-epicatechingallate (ECG), and L-epicatechin (EC) were purchased from Aladdin (Shanghai, China). William's E Medium (WEM), Dulbecco's modified Eagle's medium (DMEM), fetal bovine serum (FBS), insulin, and antibiotics were purchased from Gibco U.S. Biotechnology Co. HepG2 and Caco-2 cells were purchased from the American Tissue Culture Collection (ATCC, Manassas, VA, USA). Apoptosis and caspase kits were purchased from Beyotime Biotechnology Co.Sampling and extraction
A. nitida tea was purchased from a local tea processing factory of Guangxi, China, and stored at −25 °C. A. nitida tea was extracted according to a daily tea model. Briefly, a tea sample (2 g) was soaked in boiling water (120 mL) in a beaker under stirring at 50 rpm for 7 min using a magnetic stirrer. The mixture was then filtered and cooled. The infusion was obtained and extracted again following the previous procedure. The filtrates were combined, transferred to a 200 mL volumetric flask at room temperature, and then concentrated using a vacuum freeze dryer. The dried residue was stored at −80 °C before analysis.Cell culture
HepG2 human liver cancer cells were fostered in a WEM containing 10 mM Hepes, 2 mM L-glutamine, 5 μg mL−1 insulin, 0.05 μg mL−1 hydrocortisone, 50 μg mL−1 streptomycin, 50 units per mL penicillin, 5% FBS, and 100 μg mL−1 gentamycin. Caco-2 human colon cancer cells were cultured in DMEM mixed with 10% FBS, 50 μg mL−1 streptomycin, 50 units per mL penicillin, and 100 μg mL−1 gentamycin. HepG2 and Caco-2 cells were incubated at 37 °C with 5% CO2 and were then seeded and/or subcultured when they reached exponential growth.Simulated in vitro enzymatic digestion
The method was carried out on the basis of a previously reported literature procedure with slight modifications.36 Gastrointestinal digestion was of two types: gastric and intestinal digestion. For the gastric digestion, the infusions (30 mL) were mixed with 10 mL of HCl (0.1 M) to adjust the pH to 2, and 0.5 g of pepsin (250 units per mg solid) was added. The mixture was incubated in a shaking bath (37 °C, 250 rpm) for 2 h. After gastric digestion, 20 mL of the mixture was removed. pH was adjusted to 7.5 with Na2CO3 (0.1 M), and 0.5 g pancreatin (8 × USP) was dissolved in the mixture. This mixture was incubated in a shaking bath (37 °C, 250 rpm) for 2 h. Then, the samples were used for quantifying the phytochemicals.Determination of the phenolic content
The total phenolic content was determined by the Folin Ciocalteu colorimetric method.37 Briefly, the diluted extracts or the standard were mixed with Folin Ciocalteu reagent for 6 min and then neutralized with sodium carbonate. After incubation for 1.5 h, the absorbance of the resulting solution was measured at 760 nm. The total phenolic content was expressed as milligrams of gallic acid equivalents (GAE) per grams of sample dry weight (DW).Determination of the total flavonoid content
The total flavonoid content was determined by a colorimetric assay.38 Briefly, 1 mL of sample was mixed with 4 mL of water and 0.3 mL of NaNO2 (5%, w/v). The mixture was allowed to stand for 5 min at room temperature, and then, 0.3 mL of AlCl3 solution (10%, w/v) was added. After 6 min, 2 mL of 1 M NaOH was added followed by the addition of 2.4 mL of deionized water to the glass tube, and a final volume of 10 mL was obtained. The mixture was vigorously shaken, and the absorbance of the mixture was measured at 510 nm in a microplate reader (Max 190, MD Inc., USA). Catechin was used to prepare a standard solution with different concentrations (10, 20, 40, 50, 60, 80, and 100 mg L−1). Results were stated as milligrams of catechin equivalents (CE) per grams of sample DW. All values were stated as the mean ± SD for triplicate analyses.Determination of the total flavanol content
The flavanol content was determined by a colorimetric method. Briefly, 1 mL of sample solution, 1 mL of aluminum trichloride solution (20 mg mL−1), and 3 mL of sodium acetate (50 mg mL−1) were mixed in a tube. The mixture was allowed to stand for 2.5 h at room temperature and read in a microplate reader (Max 190, MD Inc., USA) at 440 nm. Rutin was used as a standard solution (10, 20, 40, 50, 60, 80, and 100 mg L−1) to prepare a calibration curve. All determinations were performed in triplicate. Results were expressed as the mean ± SD.Determination of the total anthocyanin content
The total anthocyanin content in the samples was estimated by a spectrophotometric pH differential protocol. The tea liquid was mixed with pH-1.0 potassium chloride buffer and pH-4.5 sodium acetate buffer. The absorbance of the mixture was measured at 515 nm and 700 nm against a distilled water blank. The anthocyanin content was calculated by the following equation:| Total anthocyanin content (mg/100 g of DW of sample) = A × MW × DF × 1000/(ε × C) |
![[thin space (1/6-em)]](https://www.rsc.org/images/entities/char_2009.gif) 900; C is the buffer concentration in mg mL−1; and DF is the dilution factor (0.1 mL of free phenolic extract sample was diluted to 10 mL).
900; C is the buffer concentration in mg mL−1; and DF is the dilution factor (0.1 mL of free phenolic extract sample was diluted to 10 mL).
The anthocyanin content was expressed as milligrams of Cy-3-G equivalents per 100 g of DW of sample for triplicate extracts.
Determination of the individual flavonoid content
The main flavonoid compounds in the samples were analyzed by the HPLC method. The HPLC system was equipped with a Waters Associates chromatograph and spectrophotometer set at 280 nm and 262 nm, respectively. The binary mobile phase consisted of solvent A (water acidified with 0.1% trifluoroacetic acid) and B (methanol). The mobile phase gradient employed was as follows: 0–10 min, 35% B; 10–11 min, 35–45% B; 11–26 min, 45–55% B; 26–27 min, 55–72% B; 27–40 min, 72–100% B; 40–44 min, 100–35% B; and 44–50 min, 35% B. All samples were injected in volumes of 20 μL, and peak areas were adopted for all calculations. Data were expressed as mg g−1 of sample DW.Determination of the hydrophilic peroxyl radical scavenging capacity (Hydro-PSC)
The Hydro-PSC was measured following a previously reported method.21 Prior to use in the reaction, vitamin C or sample solutions were appropriately diluted in phosphate buffer (pH 7.4, 75 mM) and added to a 96-well plate (100 μL per well). Then, DCFH-DA (2.48 mM, 107 μL) was hydrolysed with KOH (1.0 mM, 893 μL) for 5 min in the dark and then diluted to a 8 mL total volume work solution with phosphate buffer. ABAP working solutions (200 mM) were freshly prepared in phosphate buffer. Then, 100 μL of DCFH-DA working solution and 50 μL of ABAP working solution were added to each well. The 96-well plate was placed on a Fluoroskan Ascent fluorescence spectrophotometer (Molecular Devices, Sunnyvale, CA). The reaction was carried out at 37 °C, and fluorescence changes were monitored at 485 nm excitation and 535 nm emission using the fluorescence spectrophotometer. Results obtained for antioxidant activity of sample extracts were expressed as micromoles of vitamin C equivalent (VCE) per grams of sample ± SD.Determination of the oxygen radical absorbance capacity (ORAC)
Oxygen radical absorbance capacity was determined by the ORAC assay, as previously described.22 Typically, 20 μL of sample or trolox working solutions were added to a 96-well plate and incubated at 37 °C for 10 min. Then, 200 μL of fluorescein was added to each well (to a final concentration of 0.96 μM), and mixtures were incubated for 20 min. Subsequently, 20 μL of a freshly prepared 119.4 mM ABAP solution was added to each well. Fluorescence was measured at 485 nm excitation and 535 nm emission for 35 cycles every 4.5 min using a Fluoroskan Ascent fluorescence spectrophotometer. ORAC values were expressed as micromoles of trolox equivalent (TE) per gram DW.Cellular antioxidant activity (CAA)
The CAA values of samples were determined using the protocol as follows.23 Briefly, 100 μL of a HepG2 cell solution (6 × 10⁴ cells) was seeded on each well of a 96-well plate. After incubation for 24 hours, the growth medium was absorbed, and the wells were washed with PBS. After the cells were incubated for 1 h with either 100 μL of medium containing quercetin or samples plus 50 μM DCFH-DA solution, each well of the plate was washed with 100 μL of phosphate-buffered saline (PBS) (PBS wash protocol), and certain plate was not washed (no PBS wash protocol). Then, 100 μL of ABAP working solution (600 μM) was added to each well. Fluorescence was measured at 485 nm excitation and 535 nm emission for 13 cycles every 5 min using a Fluoroskan Ascent fluorescence spectrophotometer. The CAA was calculated by the following equation:where

 is the integrated area under the fluorescence versus time curve of the sample and
  is the integrated area under the fluorescence versus time curve of the control. The median effective dose (EC50) values were calculated from the median effect plot of lg(fa/fu) versus lg(dose), where fa is the fraction affected by treatment (CAA unit) and fu is the fraction unaffected by treatment (1 − CAA unit) and expressed as the mean ± SD using triplicate data sets obtained from the same experiment. EC50 values were converted to CAA values, which were expressed as micromoles of quercetin equivalent (QE) per 100 g of sample.
Determination of cell proliferation by an inhibition test
The antiproliferative activity of samples towards Caco-2 cells was evaluated by the cell methylene blue colorimetric assay.39 Caco-2 cells were seeded on a 96-well microplate with 100 μL of growth medium per well at a density of 2.5 × 10⁴ cells per well. After incubation for 6 h, the growth medium was removed, and the wells were lightly washed with PBS. Then, 100 μL of medium containing the samples at different concentrations was added to each well; the medium without sample was also added as the control. After incubation for 72 h, the mixtures were removed from the wells, and the wells were washed with PBS. Then, 50 μL of methylene blue solution were added to every well. After incubation for 1 h, the plate was rinsed with water six times, and 100 μL of elution buffer was added to each well. The plate was shaken for 20 min at room temperature and read using a microplate reader at 570 nm. The antiproliferative activity was expressed in terms of IC50 values (in milligrams of sample per milliliter).Detection of cell apoptosis by fluorescence microscopy and flow cytometry
Cell apoptosis of Caco-2 cells was evaluated by fluorescence microscopy and flow cytometry following the manufacturer's instructions of the V-FITC/PI apoptosis kit. Cells were treated with intestinal fluid samples (0, 260, 320, and 337.5 μg mL−1) in a 24-well plate. Then, the plate was centrifuged at 1000 g for 5 min and washed with PBS buffer once. Annexin V-FITC binding buffer, Annexin V-FITC, and PI solutions were added to the plate. After incubation for 20 min in the dark, the stained cells were immediately observed using a fluorescence microscope (Leica, Germany).Cells were treated with intestinal fluid samples (0, 260, 320, and 337.5 μg mL−1) and harvested by trypsinization. Then, cells were obtained and washed with PBS buffer three times. The cells were resuspended by the Annexin V-FITC binding buffer, and the Annexin V-FITC and PI solution were added to the cell suspension. After incubation for 20 min in the dark, the stained cells were analyzed by flow cytometry under 488 nm excitation. The data were obtained and analyzed by the Cell Quest Research Software (Becton Dickinson).
Caspase 3/9 activity assay
The caspase 3 and 9 activity has been determined using a caspase colorimetric protease assay kit based on the formation, catalyzed by caspase 3 and 9, of acetyl-Asp-Glu-Val-Asp p-nitroanilide (Ac-DEVD-pNA) and acetyl-Leu-Glu-His-Asp p-nitroanilide (Ac-LEHD-pNA), which generates a yellow formazan product, p-nitroaniline (pNA). Caco-2 cells were seeded in 6-well plates (5.0 × 10⁵ cells per well) and incubated in an incubator. After 4 h, cells were treated with the samples for 24 h. According to the product guidelines, Caco-2 cells were harvested and treated with the provided lysis buffer for 15 min. The cell lysates were then centrifuged at 16000 g for 15 min, and the supernatants were transferred to a precooled centrifuge tube. In a 96-well microplate, to each well, 80 μL of buffer, 10 μL of sample supernatants, and 10 μL of an specific substrate for caspase 3 and 9 were added. The microplate was incubated at 37 °C for 2.5 h and read using a micrometer plate reader at 405 nm. Results were expressed as μM pNA per gram of protein.
Statistical analysis
Statistical analyses were conducted using the SPSS software 13.0 (SPSS Inc., Chicago, IL, USA), whereas dose-effect analysis was evaluated using the Calcusyn software version 2.0 (Biosoft, Cambridge, U.K.). Results were subjected to ANOVA, and mean differences were analyzed using the Tukey's multiple comparison test. Significance was determined at p < 0.05. All data were displayed as the mean ± SD.Conclusions
A. nitida tea has attracted interest due to its health benefits. Through simulated digestion, the phytochemicals in A. nitida tea exhibited an enhanced antioxidant and antiproliferative activity towards Caco-2 cells. The cellular antioxidant activity displayed a positive correlation with phenolic and flavonol content. Our findings indicate that activation of the caspase-3/9 signaling pathway may be the mechanism underlying the induced apoptosis of Caco-2 cells by A. nitida tea digests. These results can provide an insight into the bioavailability of A. nitida tea after in vitro gastrointestinal digestion and support the development of functional foods based on A. nitida tea. The separation and purification of the functional compounds in A. nitida tea are worth investigating, and the study of other underlying mechanisms for the antiproliferative activity towards Caco-2 cells is being considered for future work.Conflicts of interest
There are no conflicts of interest to declare.Acknowledgements
This work was supported by the funding received from the Leading Talents Program in the Guangdong Province.References
- D. Tagliazucchi, E. Verzelloni, D. Bertolini and A. Conte, Food Chem., 2010, 120, 599–606 CrossRef CAS.
- A. Helal, S. Desobry, S. Banon and S. M. Shamsia, J. Dairy Res., 2015, 82, 56–63 CrossRef CAS PubMed.
- S. Lamothe, N. Azimy, L. Bazinet, C. Couillard and M. Britten, Food Funct., 2014, 5, 2621–2631 CAS.
- T. Matsuura, Y. Yoshikawa, H. Masui and M. Sano, Yakugaku Zasshi, 2004, 124, 217–223 CrossRef CAS.
- Y. Chen, G. Chen, X. Fu and R.-H. Liu, J. Agric. Food Chem., 2015, 63, 169–176 CrossRef CAS PubMed.
- Y. Zheng, X. Hu, Y. Zhai, J. Liu, G. Wu, L. Wu and J. Shentu, J. Chromatogr. B: Anal. Technol. Biomed. Life Sci., 2015, 997, 200–209 CrossRef CAS PubMed.
- H. Gao, B. Liu, F. Liu and Y. Chen, Molecules, 2010, 15, 3878–3886 CrossRef CAS PubMed.
- L. Hong Van and L. Van Viet Man, Int. J. Food Sci. Technol., 2012, 47, 1206–1214 CrossRef.
- G. Luck, H. Liao, N. J. Murray, H. R. Grimmer, E. E. Warminski, M. P. Williamson, T. H. Lilley and E. Haslam, Phytochemistry, 1994, 37, 357–371 CrossRef CAS PubMed.
- Y. G. Cao, A. D. True, J. Chen and Y. L. L. Xiong, J. Agric. Food Chem., 2016, 64, 3054–3061 CrossRef CAS PubMed.
- G. L. Chen, K. Hu, N. J. Zhong, J. Guo, Y. S. Gong, X. T. Deng, Y. S. Huang, D. K. Chu and Y. Q. Gao, Eur. Food Res. Technol., 2013, 236, 303–310 CrossRef CAS.
- J. Zhang, D. Tao, J. Duan, Z. Liang, W. Zhang, L. Zhang, Y. Huo and Y. Zhang, Anal. Bioanal. Chem., 2006, 386, 586–593 CrossRef CAS PubMed.
- P. J. Weathers, N. J. Jordan, P. Lasin and M. J. Towler, J. Ethnopharmacol., 2014, 151, 858–863 CrossRef PubMed.
- R. J. Green, A. S. Murphy, B. Schulz, B. A. Watkins and M. G. Ferruzzi, Mol. Nutr. Food Res., 2007, 51, 1152–1162 CAS.
- N. Fabre, I. Rustan, E. de Hoffmann and J. Quetin-Leclercq, J. Am. Soc. Mass Spectrom., 2001, 12, 707–715 CrossRef CAS PubMed.
- J. A. He and M. M. Giusti, Annu. Rev. Food Sci. Technol., 2010, 1, 163–187 CrossRef CAS PubMed.
- J. I. Mosele, A. Macia, M. P. Romero and M. J. Motilva, Food Chem., 2016, 201, 120–130 CrossRef CAS PubMed.
- I. R. Record and J. M. Lane, Food Chem., 2001, 73, 481–486 CrossRef CAS.
- K. Yoshino, M. Suzuki, K. Sasaki, T. Miyase and M. Sano, J. Nutr. Biochem., 1999, 10, 223–229 CrossRef CAS PubMed.
- Y. Zheng, X. Hu, Y. Zhai, J. Liu, G. Wu, L. Wu and J. ShenTu, J. Chromatogr. B: Anal. Technol. Biomed. Life Sci., 2015, 997, 200–209 CrossRef CAS PubMed.
- K. K. Adom and R. H. Liu, J. Agric. Food Chem., 2005, 53, 6572–6580 CrossRef CAS PubMed.
- D. J. Huang, B. X. Ou, M. Hampsch-Woodill, J. A. Flanagan and R. L. Prior, J. Agric. Food Chem., 2002, 50, 4437–4444 CrossRef CAS PubMed.
- K. L. Wolfe and R. H. Liu, J. Agric. Food Chem., 2007, 55, 8896–8907 CrossRef CAS PubMed.
- C. Krul, A. Luiten-Schuite, A. Tenfelde, B. van Ommen, H. Verhagen and R. Havenaar, Mutat. Res., Fundam. Mol. Mech. Mutagen., 2001, 474, 71–85 CrossRef CAS PubMed.
- M. J. Bermudez-Soto, F. A. Tomas-Barberan and M. T. Garcia-Conesa, Food Chem., 2007, 102, 865–874 CrossRef CAS.
- R. H. Liu and J. Finley, J. Agric. Food Chem., 2005, 53, 4311–4314 CrossRef CAS PubMed.
- A. L. Kremer Faller, E. Fialho and R. H. Liu, J. Agric. Food Chem., 2012, 60, 4826–4832 CrossRef PubMed.
- M. Monagas, M. Urpisarda, F. Sánchezpatán, R. Llorach, I. Garrido, C. Gómezcordovés, C. Andreslacueva and B. Bartolomé, Food Funct., 2010, 1, 233–253 CAS.
- B. Zhang, Z. Y. Deng, D. D. Ramdath, Y. Tang, P. X. Chen, R. H. Liu, Q. Liu and R. Tsao, Food Chem., 2015, 172, 862–872 CrossRef CAS PubMed.
- A. Cilla, A. González-Sarrías, F. A. Tomás-Barberán, J. C. Espín and R. Barberá, Food Chem., 2009, 114, 813–820 CrossRef CAS.
- W. Chen, Y. Xu, L. X. Zhang, H. M. Su and X. D. Zheng, Food Chem., 2016, 212, 620–627 CrossRef CAS PubMed.
- P. F. Rezaei, S. Fouladdel, S. Hassani, F. Yousefbeyk, S. M. Ghaffari, G. Amin and E. Azizi, Food Chem. Toxicol., 2012, 50, 1054–1059 CrossRef CAS PubMed.
- H. Y. Cui, S. F. Wu, Y. P. Sun, T. T. Wang, Z. J. Li, M. H. Chen and C. L. Wang, Food Funct., 2016, 7, 455–463 CAS.
- B. Liu, W. L. Che, J. S. Xue, C. Z. Zheng, K. Tang, J. Y. Zhang, J. Wen and Y. W. Xu, Cell. Physiol. Biochem., 2013, 32, 655–662 CrossRef CAS PubMed.
- Y. J. Chen, P. L. Sun, W. L. Bai and A. Gao, Sci. Total Environ., 2016, 571, 883–891 CrossRef CAS PubMed.
- G. C. Tenore, P. Campiglia, D. Giannetti and E. Novellino, Food Chem., 2015, 169, 320–326 CrossRef CAS PubMed.
- Y. Chen, G. Wang, H. Wang, C. Cheng, G. Zang, X. Guo and R. H. Liu, PLoS One, 2014, 9, e108140 Search PubMed.
- T.-T. Zhang, L. Yang and J.-G. Jiang, Food Funct., 2015, 6, 2205–2214 CAS.
- D. L. Felice, J. Sun and R. H. Liu, J. Funct. Foods, 2009, 1, 109–118 CrossRef.
Footnote |
| † Electronic supplementary information (ESI) available. See DOI: 10.1039/c7ra07429h |
| This journal is © The Royal Society of Chemistry 2017 |