 Open Access Article
Creative Commons Attribution 3.0 Unported Licence
Synthesis and assessment of new cationic gemini surfactants as inhibitors for carbon steel corrosion in oilfield water†
F. El-Taib Heakal *a,
M. A. Deyab
 b,
M. M. Osmanb,
M. I. Nessimb and
A. E. Elkholyb
aChemistry Department, Faculty of Science, Cairo University, 12613 Giza, Egypt. E-mail: fakihaheakal@yahoo.com; feltaibheakal@gmail.com; Fax: +20 35738425; Tel: +20 1002449048
bDepartment of Analysis and Evaluation, Egyptian Petroleum Research Institute, 11727 Cairo, Egypt
First published on 9th October 2017
Abstract
Three gemini surfactants were synthesized having the same length of terminal chain but differing in the spacer chain length and they were evaluated as corrosion inhibitors for carbon steel in oilfield water using weight loss, EIS, potentiodynamic polarization and open-circuit potential measurements. These measurements revealed that the synthesized materials have served as effective mixed-type corrosion inhibitors. Their adsorption on a carbon steel surface was well described by means of the Langmuir adsorption isotherm. The activation parameters for the dissolution of carbon steel in solutions of oilfield water in the absence and presence of these inhibitors were calculated. The effect of immersion time on the stability and durability of protective films adsorbed on a carbon steel surface was studied using weight loss method. Ex situ inspection, i.e. post-exposure analysis, for the treated carbon steel surface has been performed using SEM, EDX and FT-IR tools.
1. Introduction
Carbon steel (C-steel) is the main engineering material used in constructing pipelines for transferring water, chemicals and petroleum products in addition to vessels used in oil and gas production systems. This broad usage of carbon steel is due to its excellent mechanical properties and cheapness.1,2 Unfortunately, carbon steel-based materials are vulnerable to corrosion by their neighboring environment. Among the corrosive media doing violence to C-steel is oilfield water which naturally exists in gas and oil reservoirs. It contains huge amounts of dissolved salts (e.g. chloride and sulfate ions) and dissolved corrosive gases (e.g. CO2 and H2S) as well.3 In petroleum oilfields, the disposal of oilfield water separated from crude oil represents a nuisance for workers in the petroleum industry because it is highly saline and polluted by oil. So, this water is mixed with fresh water and re-injected in the oil wells so as to stimulate the crude oil stuck to rocks in the oil reservoir to be recovered with the advantage of increasing the oil productivity on one hand and the disposal of oilfield water on the other hand in a process called hydraulic fracturing. Before injection, some chemicals are added to this fluid such as scale and corrosion inhibitors to prevent scale deposition inside oil pipelines and also to prevent their corrosion.4Among the methods followed for protecting metals against their corrosion is using corrosion inhibitors. It is the most suitable procedure because of its high efficiency, economic advantages, and wide applicability in various fields.5 A corrosion inhibitor is any material that can reduce the corrosion rate of a metal6 via displacing water molecules from the vicinity of the metallic surface then its molecules can interact with the anodic and/or cathodic sites by adsorption.7 These materials can be classified according to their chemical nature into three genres: (i) inorganic inhibitors, (ii) organic inhibitors, and (iii) mixed-compound inhibitors.8 Nevertheless, most commonly used inhibitors are organic compounds especially those containing hetero atoms (O, N and/or S)9 and/or those containing multiple bonds or aromatic rings (π-systems).10 Inhibition process can be performed by electrons transfer between the inhibitor and the metal surface (vacant d-orbitals) forming coordinate covalent bonds between them.11 Furthermore, adsorption can be due to electrostatic interaction between the metal surface and inhibitor molecules.12 As a result, inhibitor adsorption relies on the surface charge of the metal, i.e., the adsorption of cations is favored if the net charge is negative while adsorption of anions is favored when the case is reversed.11
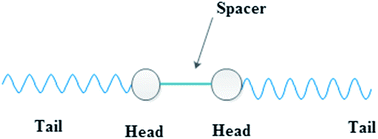
Surfactants, or surface active agents, are a general class of organic chemical compounds of amphiphilic molecules, each of them contains a hydrophobic (non-polar) tail and a hydrophilic (polar) head.13 Usually, the hydrophilic head (either polar or ionic group) of surfactant molecule attaches to the metal surface and its tail or hydrophobic moiety extends away from the interface towards the solution bulk forming an array of hydrophobic tails which leads to a change in the electrochemical behavior of metal (increasing the corrosion resistance).14 Gemini surfactants are a class of surfactants in which the molecule is composed of two identical molecules of ordinary surfactant linked together via a linkage called spacer (Fig. 1).15 This spacer may be hydrophilic or hydrophobic, short or long and rigid or flexible.16 The current study aims to investigate the corrosion inhibition efficiency of some developed cationic gemini surfactants for C-steel in oilfield water. These surfactants were prepared in the series of α,ω-alkanediyl bis(3-dodecylimidazolium-1-yl)dibromide with the same length of terminal chains but differing in the length of spacer chain (2, 6 and 10 methylene groups).
2. Materials and experimental methods
2.1. Materials
Carbon steel samples used in all experiments has the following elemental composition (in wt%): 0.200 C, 0.350 Mn, 0.024 P, 0.003 Si and balance Fe. C-steel electrode and weight loss coupons were polished before each experiment with several emery sheets ranging from 400 to 2500 grades, washed with distilled water and dried using a filter paper.The test solution used in this study was oilfield water free from oils and greases. It was collected from several Egyptian oilfields. The physical properties and chemical composition of oilfield water are shown in Tables 1 and 2, respectively. The components of this medium are known to be highly corrosive to the oil extraction structures.17,18
| Physical property | Value |
|---|---|
| Total dissolved solids | 111.9255 g l−1 |
| Conductivity | 14.61 mohs cm−1 @ 20.1 °C |
| Resistivity | 0.0685 ohm m @ 20.1 °C |
| Salinity | 109.5072 g l−1 |
| pH | 6.85 @ 25 °C |
| Density | 1.0842 g ml−1 @ 15.56 °C |
| Specific gravity | 1.0853 |
| Hardness | 25.0657 g l−1 |
| Constituents | Concentration (mg l−1) | Constituents | Concentration (mg l−1) |
|---|---|---|---|
| Lithium | 0.01 | Fluoride | 0.00 |
| Sodium | 30![[thin space (1/6-em)]](https://www.rsc.org/images/entities/char_2009.gif) 543.00 543.00 |
Chloride | 66![[thin space (1/6-em)]](https://www.rsc.org/images/entities/char_2009.gif) 368.00 368.00 |
| Potassium | 3402.13 | Bromide | 209.45 |
| Magnesium | 1197.24 | Nitrate | Nil |
| Calcium | 8063.85 | Hydroxide | Nil |
| Iron | 38.69 | Carbonate | Nil |
| Copper | 0.15 | Bicarbonate | 244.00 |
| Strontium | Nil | Sulfate | 1859.00 |
| Barium | Nil |
Anions and cations of oilfield water were determined according to ASTM D-4327 and 6919, respectively using ion chromatography. The instrument used was Dionex IC model ICS 1100 equipped with high capacity columns (AS9 and CS12) for anion and cations, respectively. Heavy metals present in oilfield water were determined using Flame Atomic Absorption Spectrophotometer model Zenit 700p according to ASTM D4691. Physical properties of oilfield water including density, specific gravity, pH, etc., were measured according to the following standard procedures:
• TDS was determined according to ASTM D-1888.
• Conductivity and resistivity was determined on site using digital conductivity meter WTW 330I according to ASTM D-1125.
• Density and specific gravity was determined according to ASTM D-1429.
• pH value was determined according to ASTM D-1293 using digital pH meter model Mettler Toledo-Seven Go.
• Alkaline species (CO32−, OH−, and HCO3−) were measured according to ASTM D-3875 calculations was done using Alkalinity calculator ver. 2.10 (USGS).
The corrosion inhibitors used in this study are some cationic gemini surfactants differing in the length of spacer chain (2, 6 and 10 methylene groups). For simplicity, they are abbreviated according to their spacer length as GS2, GS6 and GS10, respectively. The chemicals from which these gemini surfactants are prepared have been purchased from Alfa Aesar Co. These chemicals are namely, 1H-imidazole (99%), 1-bromododecane (98%), 1,2-dibromoethane (99%), 1,6-dibromohexane (97%), 1,10-dibromo decane (97%), acetonitrile (HPLC grade) and KOH (pellets).
2.2. Synthesis of gemini surfactants
The three imidazolium-based gemini surfactants are prepared through two steps as follows:2.3. Characterization of the synthesized gemini surfactants
The synthesized gemini surfactants were characterized using elemental analysis, mass spectrometry, Fourier transform infrared (FT-IR) spectroscopy and H1-NMR spectroscopy. Mass spectrometric analysis was performed using Thermo Scientific ISQ QD GC-MS system. FT-IR spectroscopic analysis was performed using KBr pellets via Perkin Elmer, model: Spectrum One FT-IR spectrometer. H1-NMR spectroscopy was carried out in CDCl3 using Varian Gemini-200 MHz system. Thermogravimetric analysis (TGA) was carried out for the synthesized surfactants to determine their thermal stability using simultaneous TGA-DSC, model: SDT Q600, USA. Critical micelle concentration (CMC) was measured in oilfield water at room temperature using Du-Nouy tensiometer (KRUSS K6, Type 4851). All figures and tables concerning the characterization of the prepared gemini surfactants are included as ESI materials.†2.4. Methodology
 | (1) |
 | (2) |
In case of the electrochemical impedance spectroscopy, the corrosion inhibition efficiency (Ei%) for all inhibitors was calculated from the value of the total resistance (Rt) of the metal surface (Rt = Rf + Rct = R1 + R2) obtained from EIS measurements, according to the following equation:20,21
 | (3) |
The potentiodynamic polarization measurements were carried out at a scan rate of 5 mV s−1 starting from −1 to −0.4 V (vs. SCE). The inhibition efficiency (Ep%) was determined using corrosion current density according to eqn (4):20,22
 | (4) |
2.5. Surface analysis
3. Results and discussion
3.1. Characterization of the synthesized gemini surfactants
• Aliphatic C–H stretching bands appear at 2923–2854 cm−1.
• Aromatic C–H stretching bands appear at 3099 cm−1.
• N–H stretching bands (broad) appear at 3407 cm−1. This could be attributed to the presence of the carbene proton in the form of NH+ (Scheme S1†).
• C![[double bond, length as m-dash]](https://www.rsc.org/images/entities/char_e001.gif) C stretching bands appear at 2028 cm−1.
C stretching bands appear at 2028 cm−1.
• C–C stretching bands appear at 1563 cm−1.
Fig. S3† demonstrates the H1-NMR spectrum of the intermediate compound. From the data listed in Table S2,† we can observe the following:
• The proton (a) has a high chemical shift which could be attributed to the presence of the carbene proton.
• The same protons (b) [with the value of 7.436 ppm], possesses the carbene type.
• The aromatic proton (c) has the value (6.969 ppm), whereas the aromatic protons (d) have the chemical shifts of 6.843 ppm. Both of the two types showed doublet spin multiplicity.
• Protons of the type (e), attached directly to nitrogen atom, have the value of 4.274.
• In the case of protons (f), the chemical shift appears at 3.864 ppm.
• The δ value of (g) protons is 1.703 ppm.
• In case of four protons (h), δ value is 1.187 ppm.
• The highly shielded protons of the monomer have the value of 0.812 ppm.
Fig. S5 through Fig. S7† display the FT-IR spectra of GS2, GS6 and GS10. The FT-IR absorption bands of the prepared gemini surfactants are listed in Table S1† and can be discussed as following:
• N–H stretching bands (broad) appear at: 3417 cm−1; GS2, 3416 cm−1; GS6 and 3419 cm−1; GS10 due to the presence of the carbene proton in the form of NH+ (Scheme 2).
• Aromatic C–H stretching bands appear at: 3039 cm−1 (GS2), 3073 cm−1 (GS6) and 3070 cm−1 (GS10).
• Aliphatic C–H stretching bands appear at: 2922–2852 cm−1 (GS2), 2924–2854 cm−1 (GS6) and 2923–2853 cm−1 (GS10).
• C![[double bond, length as m-dash]](https://www.rsc.org/images/entities/char_e001.gif) C stretching bands appear at: 2042 cm−1 (GS2), 2062 cm−1 (GS6) and 2055 cm−1 (GS10).
C stretching bands appear at: 2042 cm−1 (GS2), 2062 cm−1 (GS6) and 2055 cm−1 (GS10).
• C–C stretching bands appear at: 1563 cm−1 (GS2), 1625 cm−1 (GS6) and 1623 cm−1 (GS10).
• C–Br (ionic bond) bands appear at: 635.7 cm−1 (GS2), 634.9 cm−1 (GS6) and 634.8 cm−1 (GS10).
Fig. S8 through Fig. S10† demonstrates the H1-NMR spectrum of GS2, GS6 and GS10. The chemical shifts of H1-NMR spectra for different types of protons in the three gemini surfactants (Fig. S11†) are listed in Table S3† and we can observe the following:
• The proton (a), [compounds GS2, GS6 and GS10], has high chemical shift (10.168, 10.177 and 10.323 ppm, respectively). This could be attributed also to the presence of the carbene proton in the form of NH+.
• The same protons (b) [with the values of 8.409, 9.375 and 9.274 ppm], possess the carbene type.
• The aromatic protons (c) have the values (7.376, 7.453 and 7.421 ppm), whereas the aromatic protons (d) have the chemical shifts of 7.270, 7.272 and 7.271 ppm. Both of the two types showed doublet spin multiplicity.
• Protons of the type (e), attached directly to N+, have the values of 4.534, 4.308 and 4.335 ppm respectively. The spin multiplicity of (e) proton is triplet.
• In case of compound GS2, the four protons (f) possess (δ) value of 4.202 ppm (triplet). Whereas the four (f) protons of compounds GS6 and GS10 have the values of 4.248 and 3.370 ppm with triplet spin multiplicity and the four (f*) protons possess (δ) values of 4.283 and 3.393 ppm respectively with multiplet spin multiplicity.
• The (δ) value of the four multiplet (g) protons in (GS2) is 4.094 ppm. In the case of GS6 and GS10, the eight (multiplet g) protons are approximately equal and possess 3.462 and 2.568 ppm respectively.
• In case of four protons (h) of GS2 and GS6, δ values are 1.881 and 1.854 ppm respectively with multiplet spin multiplicity. While in GS10, the twelve protons possess 1.844 ppm with multiplet multiplicity.
• The 32 protons (i) for GS2, GS6 and GS10 have the values of 1.273, 1.383 and 1.235 ppm respectively, with multiplet multiplicity.
• The highly shielded six protons of GS2, GS6 and GS10, have the values of 0.838, 0.811 and 0.842 ppm respectively with triplet spin multiplicity.
Table S4† illustrates the results of elemental analysis where the observed results are in good agreement with the calculated ones. The thermal stability of the three prepared gemini surfactants was assessed using thermogravimetric analysis (TGA). Fig. S12† shows that the three surfactants are stable up to 250 °C and completely lose their weights at 340 °C. Both GS6 and GS10 have comparable thermal stability but the gemini surfactant of shortest spacer (GS2) has showed a slight increase in the degradation temperature in comparison to both GS6 and GS10.
3.2. Effect of inhibitor concentration
| Inhibitor | Concentration (ppm) | Weight loss rate × 103 (mg cm−2 h−1) | Ew% |
|---|---|---|---|
| Blank | — | 5.30 | — |
| GS2 | 50 | 4.16 | 21.49 |
| 100 | 1.98 | 62.69 | |
| 150 | 1.83 | 65.47 | |
| 200 | 1.72 | 67.64 | |
| 300 | 1.75 | 67.04 | |
| 400 | 1.75 | 67.05 | |
| GS6 | 50 | 4.79 | 17.89 |
| 100 | 3.46 | 34.76 | |
| 150 | 3.29 | 37.93 | |
| 200 | 3.12 | 41.13 | |
| 300 | 2.65 | 62.30 | |
| 400 | 3.02 | 43.05 | |
| GS10 | 50 | 2.04 | 61.53 |
| 100 | 0.85 | 83.98 | |
| 150 | 0.78 | 85.21 | |
| 200 | 0.85 | 83.96 | |
| 300 | 0.98 | 81.52 | |
| 400 | 1.27 | 76.01 |
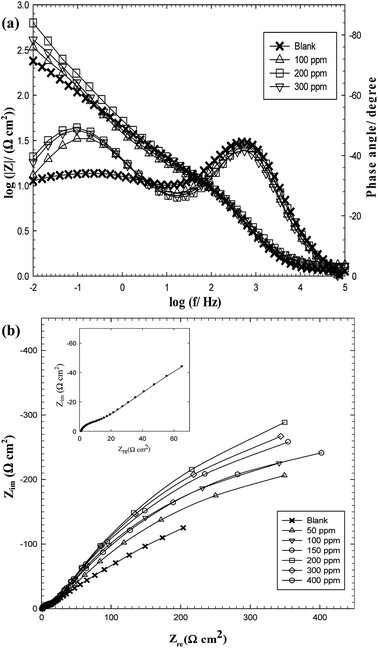 | ||
| Fig. 2 EIS spectra for C-steel in oilfield water as a function of GS2 concentration at 293 K in the Bode format (a) and Nyquist format (b). | ||
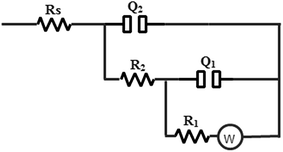
In an attempt to analyze the experimental impedance data, the equivalent circuit depicted in Fig. 330 was found to give a satisfactory fitting result with a maximum average error 0.3%. In this electrical model, two constant phase elements (Q1 and Q2) are used instead of the two real capacitances to give the best fitting. For a rough or porous surface, non-homogeneity can cause the double layer capacitance to appear as a constant phase element.31 This model consists of two-time constants ((Q1R1W) and (Q2R2)) parallel to each other and all in series to the solution resistance (Rs). The first time constant (Q1R1W) expresses the behavior at LF region and is attributed to the adsorbed film while the other one (Q2R2) is related to the HF region and describes the behavior of the double layer at the base of pores or defects in the film. The constant phase element has a non-integer parameter called the phase shift (n) which is used to compensate the system heterogeneity. So, the phase shift (n) can be described as a degree of surface roughness or non-homogeneity.32
Investigating the simulated data listed in Table 4 illustrates the following important points:
| Inhibitor | C (ppm) | W (Ω cm2 s−0.5) | R1 (Ω cm2) | Q1 (μF cm−2) | n1 | R2 (Ω cm2) | Q2 (μF cm−2) | n2 | Rs (Ω cm2) | Ei% |
|---|---|---|---|---|---|---|---|---|---|---|
| Blank | — | 66.23 | 491.34 | 100.21 | 0.47 | 10.10 | 68.11 | 0.82 | 1.13 | — |
| GS2 | 50 | 24.74 | 1010.04 | 136.81 | 0.537 | 14.25 | 62.21 | 0.836 | 1.2 | 51.05 |
| 100 | 7.5 | 1056.21 | 252.32 | 0.585 | 12.41 | 71.44 | 0.815 | 1.29 | 53.08 | |
| 150 | 7.21 | 1181.33 | 306.00 | 0.609 | 12.52 | 72.32 | 0.819 | 1.11 | 58.00 | |
| 200 | 11.39 | 1726.53 | 314.21 | 0.601 | 11.39 | 69.02 | 0.819 | 1.20 | 71.15 | |
| 300 | 30.75 | 1574.06 | 280.67 | 0.591 | 11.63 | 71.33 | 0.806 | 1.33 | 68.38 | |
| 400 | 35.23 | 1529.88 | 255.05 | 0.611 | 11.75 | 70.25 | 0.814 | 1.32 | 67.47 | |
| GS6 | 50 | 150.08 | 654.08 | 62.67 | 0.42 | 17.12 | 51.75 | 0.804 | 1.29 | 25.29 |
| 100 | 27.87 | 802.85 | 104.14 | 0.484 | 13.47 | 47.65 | 0.753 | 1.35 | 38.57 | |
| 150 | 128.14 | 993.23 | 118.91 | 0.498 | 13.86 | 50.98 | 0.777 | 1.57 | 50.21 | |
| 200 | 1.85 | 1362.3 | 215.16 | 0.556 | 21.79 | 57.26 | 0.725 | 1.59 | 63.77 | |
| 300 | 740.15 | 1393.65 | 132.04 | 0.501 | 15.04 | 45.65 | 0.749 | 1.16 | 64.40 | |
| 400 | 2.62 | 1206.98 | 182.46 | 0.534 | 19.31 | 55.96 | 0.746 | 1.61 | 59.11 | |
| GS10 | 50 | 7.46 | 1093.55 | 207.47 | 0.6 | 14.09 | 58.42 | 0.79 | 1.27 | 54.73 |
| 100 | 10.66 | 1471.74 | 177.05 | 0.61 | 19.93 | 54.81 | 0.79 | 1.28 | 66.38 | |
| 150 | 75.13 | 1951.4 | 131.65 | 0.58 | 22.54 | 51.79 | 0.79 | 1.36 | 74.60 | |
| 200 | 74.53 | 1749.33 | 129.4 | 0.58 | 20.09 | 52.35 | 0.82 | 1.37 | 71.66 | |
| 300 | 9.1 | 1633.34 | 161.19 | 0.62 | 25.95 | 48.25 | 0.8 | 1.33 | 69.78 | |
| 400 | 48.22 | 1507.94 | 121.37 | 0.57 | 22.65 | 49.26 | 0.82 | 1.15 | 67.24 |
(a) The solution resistance (Rs) is low and nearly remains constant either in the absence or presence of inhibitors (ranges between 1.11 and 1.61 Ω cm2) due to good conductivity of all tested solutions.33
(b) The resistance (R1) denoting to the resistance of the adsorbed film resistance (Rf) is generally with much higher values than those for R2 representing the charge transfer resistance (Rct). R2 possesses a value of 10.01 Ω cm2 (in blank oilfield water) and slightly increases up to a maximum value of 14.25 Ω cm2 in presence of GS2, 21.79 Ω cm2 in presence of GS6 and 25.95 Ω cm2 in presence of GS10. So, the change in R2 is not significant.
(c) Upon increasing the concentration of any gemini surfactant, a continuous significant increase in R1 value is observed. In the blank solution, R1 = 491.34 Ω cm2 but R1 increases to 1726.53 Ω cm2 (for oilfield water inhibited by 200 ppm GS2), 1393.65 Ω cm2 (for solution inhibited by 300 ppm GS6) and 1951.40 Ω cm2 (for solution inhibited by 150 ppm GS10). Above these concentrations, R1 suffers a small decrease in its value.
(d) Comparing the values of the heterogeneity parameter (n) indicates that n1 < n2. The value of n1 (relating to the adsorbed film) increases from 0.47 in the blank solution and reaches maximum values of 0.61, 0.56 and 0.62 in presence of GS2, GS6 and GS10, respectively. On the other hand, the values of n2 (relating to the double layer at the metal/native film interface) nearly remains constant in all cases. These indications suggest that the C-steel surface contains voids and pores and the presence of gemini surfactants leads to reduction in surface roughness due to the adsorption of their molecules on adsorption sites of the C-steel surface.31
![[thin space (1/6-em)]](https://www.rsc.org/images/entities/char_2009.gif) I) for carbon steel immersed in oilfield water solutions in the absence and presence of gemini surfactants and their values are listed in Table 5. As an example, Tafel curves of GS2 are shown in Fig. 4. Tafel curves for GS6 and GS10 are presented in ESI materials (Fig. S17 and S18,† respectively). Icorr values are obtained from the intersection between the extrapolations of linear regions of the anodic and cathodic branches in the Tafel polarization plot provided that the intersection point corresponds to Ecorr (the potential at which Icorr is minimum).34 Investigating Table 5 yields the following information:
I) for carbon steel immersed in oilfield water solutions in the absence and presence of gemini surfactants and their values are listed in Table 5. As an example, Tafel curves of GS2 are shown in Fig. 4. Tafel curves for GS6 and GS10 are presented in ESI materials (Fig. S17 and S18,† respectively). Icorr values are obtained from the intersection between the extrapolations of linear regions of the anodic and cathodic branches in the Tafel polarization plot provided that the intersection point corresponds to Ecorr (the potential at which Icorr is minimum).34 Investigating Table 5 yields the following information:
| Inhibitor | Conc. (ppm) | Icorr (μA cm−2) | Ecorr (V) | βa (V dec.−1) | βc (V dec.−1) | Ep% |
|---|---|---|---|---|---|---|
| Blank | — | 95.37 | −0.825 | 0.185 | −0.107 | — |
| GS2 | 50 | 52.42 | −0.836 | 0.175 | −0.123 | 45.03 |
| 100 | 45.39 | −0.831 | 0.145 | −0.112 | 52.41 | |
| 150 | 37.28 | −0.844 | 0.127 | −0.098 | 60.91 | |
| 200 | 28.67 | −0.847 | 0.090 | −0.084 | 69.93 | |
| 300 | 31.34 | −0.842 | 0.107 | −0.091 | 67.14 | |
| 400 | 32.20 | −0.828 | 0.134 | −0.101 | 66.24 | |
| GS6 | 50 | 67.93 | −0.861 | 0.195 | −0.113 | 28.77 |
| 100 | 56.64 | −0.872 | 0.175 | −0.099 | 40.61 | |
| 150 | 43.12 | −0.878 | 0.140 | −0.086 | 54.79 | |
| 200 | 35.98 | −0.880 | 0.126 | −0.077 | 62.28 | |
| 300 | 35.31 | −0.890 | 0.108 | −0.070 | 62.98 | |
| 400 | 36.58 | −0.887 | 0.047 | −0.039 | 61.65 | |
| GS10 | 50 | 34.27 | −0.823 | 0.161 | −0.122 | 64.06 |
| 100 | 26.22 | −0.823 | 0.164 | −0.123 | 72.51 | |
| 150 | 18.36 | −0.821 | 0.118 | −0.105 | 80.75 | |
| 200 | 23.26 | −0.815 | 0.147 | −0.125 | 75.61 | |
| 300 | 24.34 | −0.822 | 0.169 | −0.128 | 74.47 | |
| 400 | 28.88 | −0.817 | 0.176 | −0.134 | 69.71 |
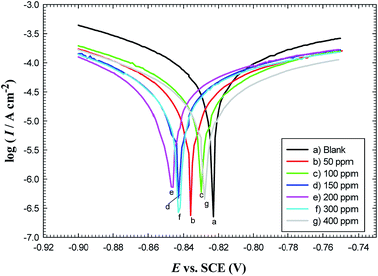 | ||
| Fig. 4 Polarization curves for carbon steel in oilfield water as a function of GS2 concentration at 293 K. | ||
(1) Icorr values decrease with the increase in concentrations of gemini surfactants till their critical values (200 ppm for GS2, 300 ppm for GS6 and 150 ppm for GS10). After that, Icorr re-increases again because the surface becomes slightly bare and vulnerable to corrosion attack.
(2) For GS2, the maximum displacement in Ecorr is about −22 mV relative to Ecorr recorded in the blank solution. For GS6, the maximum Ecorr displacement is about −65 mV, while GS10 shows a maximum displacement in Ecorr of about +10 mV. By convention, if the magnitude of Ecorr displacement in the presence of inhibitor is >± 85 mV with respect to Ecorr in blank solution, the inhibitor is classified as cathodic or anodic-type inhibitor according to the direction of the potential shift either to the more negative or to the more positive direction, respectively. If the displacement in Ecorr is <85 mV, the inhibitor can be classified as a mixed-type inhibitor.20 So, GS2 and GS6 are mixed-type inhibitors with major cathodic effectiveness, while GS10 is a mixed type inhibitor but with a predominant anodic effect.
(3) Both anodic and cathodic Tafel slopes (βa and βc) are changed significantly for all gemini surfactants which confirms that these inhibitors affect mechanisms of both cathodic and anodic reactions (they belong to mixed-type inhibitors),35 where the displacement in the values of Tafel slopes is attributed to a change in reaction mechanism.20
The inhibition efficiency values increase as a function of concentration of gemini surfactants till certain values. Above these critical concentrations, the inhibition efficiency values start to decrease again with increasing concentration. There are two suggestions for explaining this behavior:
1 Mu et al.36 have studied the inhibitive effect of sodium dodecyl sulfonate (SDS) on mild steel in 2 M HCl and found that the maximum inhibition efficiency was obtained at 150 ppm and the inhibition efficiency decreases when surfactant concentration increases above this value. They explained this behavior in a manner that at the high concentration range, SDS adsorbed on the steel surface may form hemi-micelles through the interaction between their hydrophobic groups and these hemi-micelles are similar in structure to the normal micelles. According to this attitude, high concentrations of gemini surfactants lead to aggregation of their molecules which may lead to the desorption of some initially adsorbed ones.
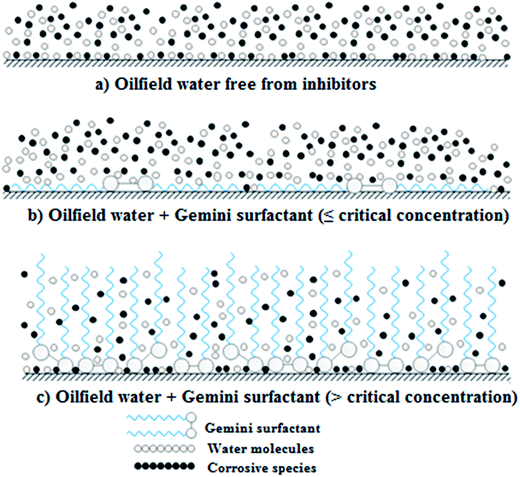
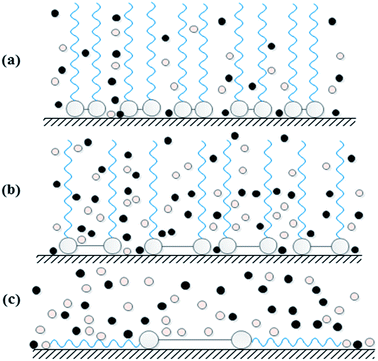
2 Jiang et al.37 have proposed another mechanism for the decrease in the inhibition efficiency values above an optimum or a critical concentration based on the adsorption mode of surfactant molecules on steel surface as follows (Fig. 5):
(a) Below or at the optimum concentration surfactant molecules adsorb on steel surface in a parallel position (with respect to C-steel surface). As the surfactant concentration increases, more surfactant molecules adsorb on the steel surface leading to covering more active sides on the steel surface. When concentration reaching the optimum value, steel surface becomes covered with surfactant molecules to its maximum extent (Fig. 5(b)).
(b) Above the optimum concentration, the number of surfactant molecules becomes so much that electrostatic interactions between them force the initially adsorbed molecules (in their parallel position) to change their mode of adsorption to allow more number of molecules to adsorb on the metal surface. So, gemini surfactant molecules adsorb on the surface in a perpendicular position (with respect to C-steel surface) to permit steel surface to be attached to more and more surfactant molecules. Accordingly, the surface area occupied by surfactant molecules, despite their huge number, becomes lower than before. So, corrosive species have the chance again to attack the steel surface and hence the corrosion rate increases again (Fig. 5(c)).
| Inh(sol) + xH2O(ads) → Inh(ads) + xH2O(sol) | (5) |
The mechanism of corrosion inhibition can be thus explained on the basis of adsorption principle41 and the nature of the interaction between the inhibitor and C-steel surface can be understood using an adsorption isotherm.42 Assuming that the gemini surfactants reduce the rate of corrosion process mainly through the increase in the degree of C-steel surface coverage (θ) by surfactant molecules, the inhibition efficiency can be considered as a function of θ, i.e. θ = 10−2 × E%.22 Frumkin, Freundlich, Temkin, Flory–Huggins and Langmuir adsorption isotherms have been attempted for fitting the adsorption of molecules of GS2, GS6 and GS10 on C-steel surface in oilfield water. It was found that the Langmuir model have showed the best fitting where it had the highest values of regression factor, r2. Langmuir isotherm is represented with a relation between  and C according to eqn (6):40,43
 | (6) |
ΔGads = −RT![[thin space (1/6-em)]](https://www.rsc.org/images/entities/char_2009.gif) ln(106Kads) ln(106Kads)
| (7) |
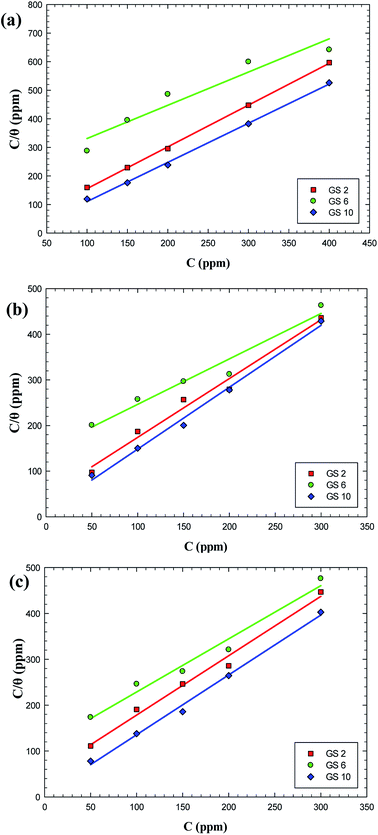 | ||
| Fig. 6 Langmuir adsorption plots for carbon steel in oilfield water inhibited by gemini surfactants based on data from weight loss (a), EIS (b) and polarization (c). | ||
| Inhibitor | Technique | r2 | Kads (ppm−1) | ΔG (kJ mol−1) |
|---|---|---|---|---|
| GS2 | Weight loss | 0.9995 | 0.107 | −28.20 |
| EIS | 0.9806 | 0.022 | −24.39 | |
| Tafel polarization | 0.9882 | 0.020 | −24.17 | |
| GS6 | Weight loss | 0.9271 | 0.005 | −20.58 |
| EIS | 0.9591 | 0.007 | −21.50 | |
| Tafel polarization | 0.9793 | 0.009 | −22.14 | |
| GS10 | Weight loss | 0.9877 | 0.267 | −30.44 |
| EIS | 0.9930 | 0.079 | −27.47 | |
| Tafel polarization | 0.9947 | 0.195 | −29.67 |
3.3. Effect of temperature
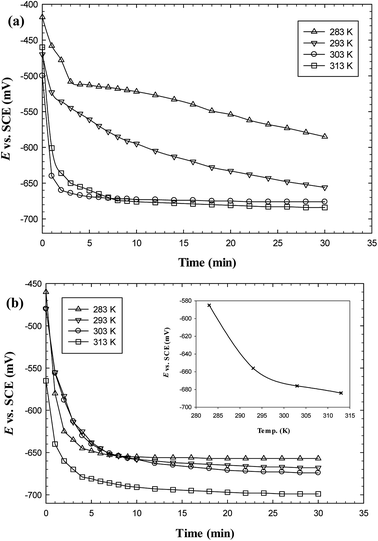
The effect of temperature on corrosion rates of C-steel and its impact on the stability of the protective film in oilfield water in the absence and presence of gemini surfactants were studied electrochemically using the potentiodynamic polarization method over the temperature range 283–313 K. Fig. 7 reveals that the C-steel potential either in the blank or inhibited solutions is shifted towards more negative values with time and the Ess value is shifted also towards the more negative direction as temperature increases but the shift in Ess value is more significant for blank solution than in the presence of inhibitors. This could be attributed to the effect of adsorption layer which can slightly isolate the C-steel surface from the corrosive medium. Fig. 8 shows that the magnitude of corrosion current density (Icorr) increases as temperature is raised either for the inhibited or uninhibited solutions of oilfield water. Nevertheless, Table 7 reveals that the change in Icorr between 283 and 313 K in oilfield water solutions containing GS2, GS6 or GS10 is small (∼31, 26 and 26 μA cm−2, respectively) in comparison to that of blank oilfield water (∼51 μA cm−2) which could be also related to the isolating effect of adsorption films of gemini surfactants. The rate of change in Ess is coincident with the rate of change in Icorr which confirms that adsorption films maintain their stability and protective effect even at elevated temperatures.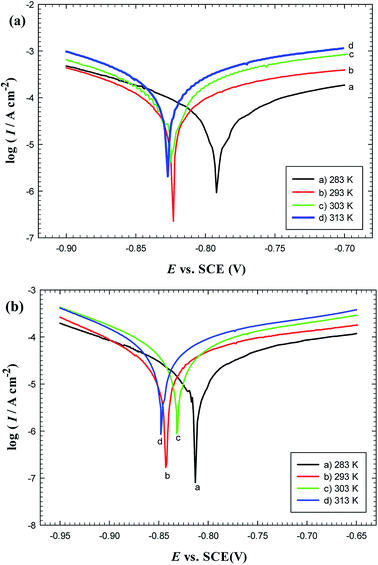 | ||
| Fig. 8 Polarization curves for carbon steel in oilfield water free (a) and containing 300 ppm GS2 (b) at different temperatures. | ||
| Inhibitor | Temperature (K) | Icorr (μA cm−2) | Ecorr (V) | βa (V dec.−1) | βc (V dec.−1) | Ep% |
|---|---|---|---|---|---|---|
| Blank | 283 | 63.58 | −0.793 | 0.239 | −0.132 | — |
| 293 | 95.37 | −0.824 | 0.185 | −0.107 | — | |
| 303 | 101.05 | −0.825 | 0.135 | −0.121 | — | |
| 313 | 114.70 | −0.827 | 0.057 | −0.569 | — | |
| GS2 | 283 | 20.00 | −0.813 | 0.158 | −0.139 | 68.54 |
| 293 | 31.34 | −0.842 | 0.129 | −0.099 | 67.14 | |
| 303 | 38.78 | −0.831 | 0.128 | −0.096 | 61.62 | |
| 313 | 51.09 | −0.847 | 0.171 | −0.112 | 54.20 | |
| GS6 | 283 | 23.51 | −0.811 | 0.139 | −0.109 | 63.02 |
| 293 | 35.31 | −0.890 | 0.108 | −0.070 | 62.98 | |
| 303 | 42.11 | −0.848 | 0.153 | −0.102 | 58.33 | |
| 313 | 49.12 | −0.815 | 0.079 | −0.082 | 57.17 | |
| GS10 | 283 | 14.71 | −0.809 | 0.131 | −0.117 | 76.87 |
| 293 | 24.34 | −0.822 | 0.169 | −0.128 | 74.47 | |
| 303 | 34.27 | −0.806 | 0.174 | −0.134 | 66.09 | |
| 313 | 40.24 | −0.802 | 0.169 | −0.141 | 64.91 |
Thermodynamic activation parameters have an important role in understanding the inhibitive mechanism of organic additives.22 The apparent activation energy associated with C-steel corrosion in free and inhibited solutions of oilfield water was determined using Arrhenius plot (Fig. 9(a)) according to the following equation:24
| Icorr = Ae(−Ea/RT) | (8) |
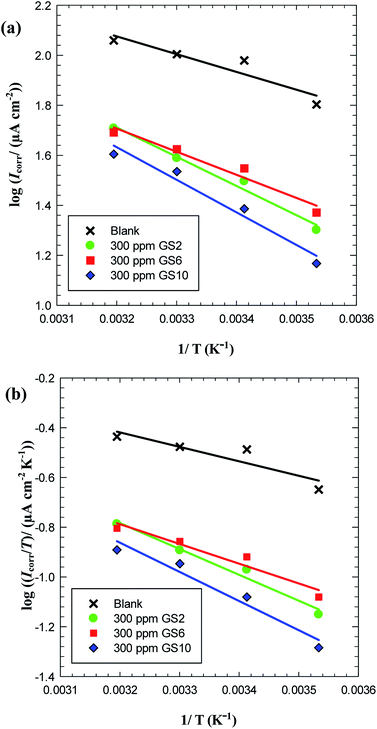 | ||
| Fig. 9 Arrhenius plot (a) and transition state plot (b) for carbon steel in oilfield water in absence and presence of GS2, GS6 and GS10. | ||
| Inhibitor | Ea (kJ mol−1) | r2 | ΔH* (kJ mol−1) | ΔS* (J mol−1 K−1) | r2 |
|---|---|---|---|---|---|
| Blank | 13.59 | 0.8731 | 11.12 | −170.01 | 0.8198 |
| GS2 | 22.37 | 0.9813 | 19.89 | −148.93 | 0.9760 |
| GS6 | 17.70 | 0.9529 | 15.22 | −163.94 | 0.9363 |
| GS10 | 24.92 | 0.9626 | 22.44 | −142.29 | 0.9753 |
Analysis of the dependence of inhibition efficiency on temperature as well as the comparison of corrosion activation energies in the absence and presence of an inhibitor give useful information about the mechanism of inhibitor adsorption. Upon elevating the ambient temperature a simultaneous decrease in the inhibition efficiency together with a concurrent increase in corrosion activation energy (Ea) in presence of inhibitor compared to its absence confirms the formation of an adsorption film of physical nature (electrostatic). On the other hand, the increase in inhibition efficiency with raising temperature accompanied with a decrease in activation energy in the presence of inhibitor suggests a chemisorption mechanism.48 Physical adsorption arises by electrostatic interaction, while chemical adsorption occurs through a bond formation by sharing an electron.49 So, these gemini surfactants adsorb mainly via physical adsorption on C-steel surface.
Thermodynamic parameters of activation, enthalpy change (ΔH*) and entropy change (ΔS*), were calculated from eqn (9) using  plot (Fig. 9(b)) where its slope equals
  and its intercept represents
  where h is Planck's constant (6.626 × 10⁻³⁴ J s), NA is Avogadro's number (6.022 × 10²³ mol−1), R is the general gas constant (8.314 J K−1 mol−1).24
 | (9) |
The ΔH* values of activation for the dissolution reaction of C-steel surface in oilfield water in the presence of GS2, GS6 and GS10 are high (19.89, 15.22 and 22.44 kJ mol−1, respectively) in comparison to that in absence of inhibitors (11.12 kJ mol−1). The positive signs of ΔH* reflect the endothermic nature of C-steel dissolution activated process which suggests the slow dissolution of C-steel surface in presence of inhibitors.38 Large and negative values of ΔS* show that the activated complex in the rate determining step represents an association rather than a dissociation step, meaning that a decrease in disordering or randomness takes place on going from reactants to the activated complex (molecules are in higher ordered state in the activated complex than in the initial state).22 Comparing the entropy of activation in both inhibited and uninhibited oilfield water reveals that the values of ΔS* are less negative in solutions containing GS2, GS6 and GS10 (−148.93, −163.94 and −142.29 J mol−1 K−1, respectively) than for uninhibited solution (−170.01 J mol−1 K−1). The thermodynamic values obtained for ΔS* are the algebraic sum of the adsorption of inhibitor molecules (solute) and desorption of water molecules (solvent). Hence, the increase in entropy of activation in presence of gemini surfactants is attributed to the increase in the solvent (H2O) entropy as a result of H2O molecules desorbed from C-steel surface.38
3.4. Effect of immersion time
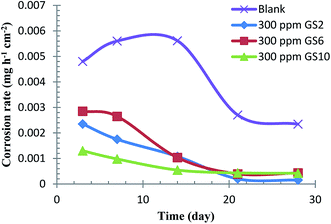
It is of prime importance to study the effect of immersion time on corrosion inhibition to examine the stability of the inhibitor film with time. Weight loss method was employed to evaluate the effect of immersion time on the corrosion rate of C-steel up to four weeks. Fig. 10 shows that oilfield water (free from inhibitor) leads to severe corrosion for C-steel with a corrosion rate being continuously increased during the first two weeks. After that, the corrosion rate drops suddenly till the end of the third week and eventually becomes nearly constant. For C-steel coupons immersed in oilfield water inhibited by any of the three tested gemini surfactants, the corrosion rate continues to decrease with time. These results indicate that in blank oilfield water, the continuous increase in corrosion rate during the initial days of immersion could be due to the dissolution of the air-oxide film formed before immersion. In the meantime, the prevailing corrosive species aggressively attack the C-steel and corrosion products (Fe oxides and salts) accumulate on its surface with time forming a somewhat protective film which slightly isolates the C-steel surface from the medium.33 After longer immersion time, the amount of corrosion products becomes so much that the aggressive species can hardly attack the metal surface. So, the corrosion process continues but with a decreasing rate. For solutions of oilfield water inhibited by gemini surfactants, the corrosion rate was found to be continuously decreasing with time due to the inhibitive contribution between adsorption film and corrosion products. With prolonging immersion time, more surfactant molecules come in the vicinity of C-steel surface and adsorb on it until the surface is covered with surfactant molecules to its maximum value. After that, surfactant molecules can form multilayers over the surface leading to more enhanced adsorption film and the corrosion process becomes more inhibited.503.5. Inhibition mechanism
It is important to determine the potential of zero charge (pzc) of C-steel in oilfield water to know the charge of steel surface and hence we can explain the adsorption mechanism of gemini surfactants.32 Values of pzc for the blank and all inhibited oilfield water solutions were calculated from Fig. 11. Table 9 reveals that all pzc values are more negative than their corresponding steady state (Ess) values. This means that the C-steel surface either in the blank or inhibited solutions is positively charged at the open-circuit conditions. This observation can be explained such that steels or iron corrode when Fe atoms decompose from their surfaces into positive ions and electrons; Fe = Fe2+ + 2e leaving the surface positively charged. In naturally aerated neutral solutions, the released electrons are involved in oxygen reduction; H2O + ½O2 + 2e = 2OH−.22 Table 2 shows that the corrosive medium under study is slightly acidic (pH = 6.85 at 25 °C) so the possible cathodic reactions are oxygen reduction and hydrogen evolution; 2H+ + 2e = H2.35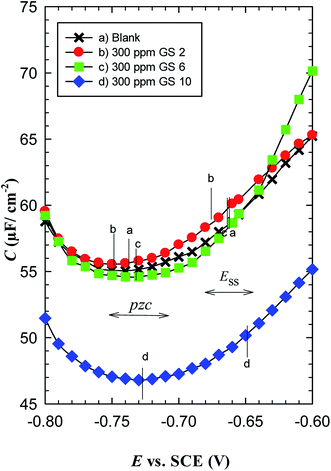 | ||
| Fig. 11 Variation of the capacitance as a function of potential applied on carbon steel in oilfield water in the absence and presence of gemini surfactants at 293 K. | ||
| Inhibitor | Ess vs. SCE (mV) | pzc vs. SCE (mV) |
|---|---|---|
| Blank | −656 | −737 |
| GS2 | −670 | −760 |
| GS6 | −656 | −738 |
| GS10 | −645 | −739 |
Since the C-steel is positively charged either in inhibited or uninhibited oilfield water, the inhibitor molecules can be adsorbed on the metal/solution interface by one or more of the following ways 38: (i) donor–acceptor interactions between the π-electrons of aromatic imidazolium ring and vacant d-orbitals of iron surface atoms. (ii) Unshared electron pairs of tertiary imidazolium N atoms and vacant d-orbitals of iron surface atoms. (iii) Interaction of d-electrons of iron surface atoms and the positive charge delocalized over the imidazolium ring. Gemini surfactants may also adsorb on positively charged C-steel surface in a manner that anions (e.g. Cl−, Br− and HCO3−) adsorb directly on C-steel surface then molecules of cationic gemini surfactants adsorb on the anionic layer.35
According to Heakal and Elkholy,15 research works that have studied the effect of spacer revealed two contradictory opinions: (i) the inhibition efficiency decreases with increasing the length of spacer chain. This behavior has been explained such that the increase in the number of methylene units in the spacer chain leads to an increase in the molecule flexibility. This hinders the adsorption of the gemini surfactant on metal surface and thus the inhibition efficiency decreases. (ii) The inhibition efficiency increases as the length of spacer chain is increased. This can be explained assuming that lengthening the spacer chain increases the degree of surface coverage and also the average area occupied by each adsorbed molecule. Hence, the inhibition efficiency increases. Both phenomena have been observed in our study for the three gemini surfactants having the same terminal chain length (dodecyl group) and differing in the spacer length (2, 6 and 10 methylene groups). Data obtained from electrochemical and chemical measurements confirm that GS10 > GS2 > GS6 in inhibition efficiency as well as their critical concentrations follows the trend: GS10 < GS2 < GS6, i.e. 150 ppm, 200 ppm and 300 ppm, respectively. In other words, GS10 demonstrates higher efficiency at lower concentration than GS2 which, in turn, shows also higher efficiency at lower concentration than GS6. This behavior can be elucidated as follows (Fig. 12):
(1) For the gemini surfactant of shortest spacer (GS2), the very short spacer allows the terminal chains to be very close to each other. So, there is a degree of attraction forces between adjacent chains in the same molecule and between neighboring molecules by hydrophobic interaction.51 This leads to the presence of arrays of stacked molecules which represent a barrier against corrosive molecules to penetrate to C-steel surface (Fig. 12(a)).
(2) On the other hand, GS6 has a longer spacer and its terminal chains are far away from each other so there are weak hydrophobic interactions between the terminal chains. In addition, a specific region on C-steel surface can be covered by a number of GS6 less than GS2. In this case there may be voids or weak regions through which corrosive species can attack C-steel surface (Fig. 12(b)).
Unlike GS2 and GS6 whom molecules are predicted to adsorb on C-steel via vertical orientation, GS10 molecules are expected to adsorb on C-steel surface via lateral interactions due to the absence of hydrophobic interactions between terminal chains. So, both terminal chains in GS10 molecule can extend over C-steel surface instead of being extended in the solution (Fig. 12(c)). Moreover, this mode of interaction allows more GS10 molecules to overlay on each other forming multilayers. So, GS10 forms a tough barrier against corrosive species.
A conclusion can be gained from these observations that very short and very long spacer-gemini surfactants are more efficient than those of intermediate spacers. This assumption compromises between the previously mentioned contradictory phenomena concerning the effect of spacer length on the corrosion inhibition efficiency.
3.6. Quantum chemical calculations
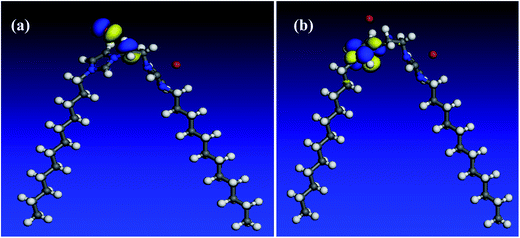
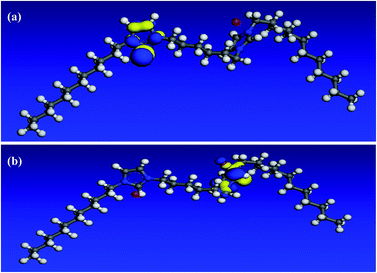
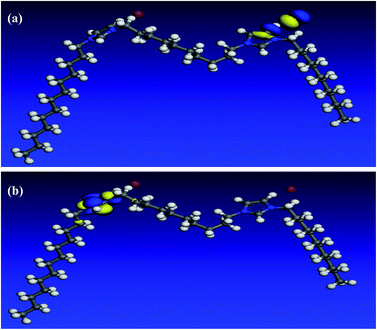
In an attempt to undergo a correlation between computational chemical calculations and experimental measurements, the quantum chemical parameters are calculated and discussed. All optimization calculations were done using VAMP module in Materials Studio 6.0 software from Accelrys Inc. The Parametric Method (PM3), a semi-empirical method was employed to obtain quantum chemical parameters and to optimize the molecule geometry.52 As it can be seen in Fig. 13–15, both HOMO and LUMO regions are focused on imidazolium rings where in each molecule; HOMO is localized on one imidazolium ring while LUMO is distributed over the other ring. This indicates that the imidazolium rings are the active parts in these gemini surfactants. Low values of the gap energy (ΔE = ELUMO − EHOMO)20 refer to good inhibition efficiencies because the energy needed to remove an electron from the HOMO of an inhibitor will be minimized and also it will be easy to donate electrons for Fe d-orbital. Moreover, ELUMO will be minimum and thus the inhibitor can gain electrons from filled Fe d-orbital53 or from the filled Fe 4s orbital.54 Table 10 reveals that GS10 < GS2 < GS6 in ΔE giving a theoretical prediction that GS10 > GS2 > GS6 in agreement with the practical results. In literature, there is no regular correlation between the inhibition efficiency of a corrosion inhibitor and its dipole moment (μ).20| Molecule | EHOMO (eV) | ELUMO (eV) | ΔE | I (eV) | A (eV) | χ (eV) | η (eV) | μ (Debye) |
|---|---|---|---|---|---|---|---|---|
| GS2 | −8.357 | −1.071 | 7.286 | 8.357 | 1.071 | 4.714 | 3.643 | 5.946 |
| GS6 | −8.134 | −0.721 | 7.413 | 8.134 | 0.721 | 4.428 | 3.707 | 14.596 |
| GS10 | −8.234 | −1.453 | 6.781 | 8.234 | 1.453 | 4.844 | 3.391 | 30.551 |
If Fe and an inhibitor molecule are brought together, electrons will flow from the less electronegative entity to the more electronegative one until the values of the chemical potential become equal. The parameters, electronegativity (χ) and global hardness (η), were calculated for the prepared gemini surfactants. These parameters are related to the electron affinity (A) and ionization potential (I), where:  and
and I and A are related, in turn, to EHOMO and ELUMO as: I = −EHOMO and A = −ELUMO.55 Table 10 indicates that GS10 < GS2 < GS6 in the ELUMO whereas the trend is reversed in the case of the electronegativity of these compounds (χ). Thus, the more electronegative the molecule, the better its interaction with Fe surface. These observations indicate that these compounds may act as potential inhibitors for Fe corrosion via electron transfer from the metal surface to inhibitor where the transferred electrons are hosted in the antibonding molecular orbitals (LUMOs)56 and the measured inhibition efficiency follows the order GS10 > GS2 > GS6.
3.7. Surface analysis
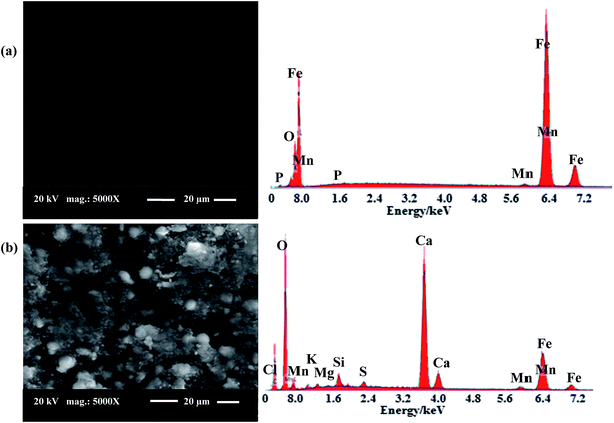 | ||
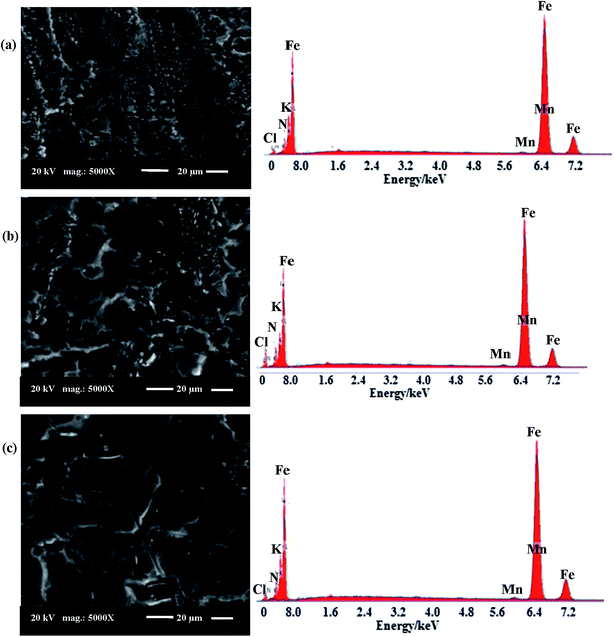
| Fig. 16 SEM micrographs and EDX images for: (a) abraded C-steel surface, (b) surface of C-steel immersed in a solution of oilfield water. | ||
| Assignment59,60 | N–H | Aromatic C–H | Aliphatic C–H | Combination N–H | Aromatic C![[double bond, length as m-dash]](https://www.rsc.org/images/entities/char_e001.gif) C or C C or C![[double bond, length as m-dash]](https://www.rsc.org/images/entities/char_e001.gif) N N |
C–Br or γ-Fe2O3 | ||
|---|---|---|---|---|---|---|---|---|
| Absorption bands (cm−1) | GS2 | Before | 3417 | 3039 | 2922–2852 | 2042 | 1563 | 636 |
| After | 3305 | — | 2923–2872 | — | 1628 | 560 | ||
| GS6 | Before | 3416 | 3073 | 2924–2854 | 2062 | 1625 | 635 | |
| After | 3404 | — | 2924–2854 | — | 1619 | 590 | ||
| GS10 | Before | 3419 | 3070 | 2923–2853 | 2055 | 1623 | 635 | |
| After | 3383 | — | 2923–2853 | — | 1606 | 600 | ||
4. Conclusions
This study evaluates three novel gemini surfactants as inhibitors for the corrosion of C-steel in oilfield water. The main conclusions are as follows:(1) Weight loss method, polarization and EIS measurements have showed that the synthesized gemini surfactants (GS2, GS6 and GS10) are good inhibitors for the corrosion of C-steel in oilfield water and the inhibition efficiency increases with the inhibitor concentration up to a critical value above which the inhibition efficiency starts to decrease.
(2) The maximum inhibition efficiency values obtained from weight loss method for GS2, GS6 and GS10 are 67.64% at 200 ppm, 62.30% at 300 ppm and 85.21% at 150 ppm, respectively.
(3) EIS spectra of C-steel in oilfield water in absence and presence of any of the tested inhibitors show a two-time constant behavior and displays the features of Warburg impedance.
(4) The synthesized gemini compounds act as mixed-type corrosion inhibitors, retarding both anodic metal dissolution and cathodic reactions.
(5) The decrease in corrosion rate of C-steel as a function of each inhibitor concentration (till its critical value) indicates that its molecules adsorb on C-steel surface.
(6) Adsorption of molecules of each gemini surfactant is described according to Langmuir isotherm. Both physisorption and chemisorption processes are present but the former is predominant.
(7) Thermodynamic parameters calculated from polarization measurements indicate that the presence of these inhibitors increases the activation energy and these compounds are spontaneously adsorbed on C-steel surface mainly via physisorption mechanism.
(8) Surface analyses (SEM, EDX and FT-IR) confirm the adsorption of these inhibitors on C-steel surface.
Conflicts of interest
There are no conflicts to declare.References
- M. Deyab and S. Keera, Egypt. J. Pet., 2012, 21, 31–36 CrossRef CAS.
- M. A. Migahed, M. M. Attya, S. M. Rashwan, M. Abd El-Raouf and A. M. Al-Sabagh, Egypt. J. Pet., 2013, 22, 149–160 CrossRef.
- M. A. Deyab, Desalination, 2016, 384, 60–67 CrossRef CAS.
- P. Boschee, Soc. Petrol. Eng. J., 2012, 1, 22–26 Search PubMed.
- M. A. M. Deyab, J. Surfactants Deterg., 2015, 18, 405–411 CrossRef CAS.
- D. Lopez, S. Simison and S. De Sanchez, Corros. Sci., 2005, 47, 735–755 CrossRef CAS.
- M. Bobina, A. Kellenberger, J.-P. Millet, C. Muntean and N. Vaszilcsin, Corros. Sci., 2013, 69, 389–395 CrossRef CAS.
- M. Deyab, RSC Adv., 2015, 5, 41365–41371 RSC.
- M. Deyab, J. Taiwan Inst. Chem. Eng., 2016, 60, 369–375 CrossRef CAS.
- M. Prabakaran, S.-H. Kim, V. Hemapriya, M. Gopiraman, I. S. Kim and I.-M. Chung, RSC Adv., 2016, 6, 57144–57153 RSC.
- M. V. Fiori-Bimbi, P. E. Alvarez, H. Vaca and C. A. Gervasi, Corros. Sci., 2015, 92, 192–199 CrossRef CAS.
- L. Fragoza-Mar, O. Olivares-Xometl, M. A. Domínguez-Aguilar, E. A. Flores, P. Arellanes-Lozada and F. Jiménez-Cruz, Corros. Sci., 2012, 61, 171–184 CrossRef CAS.
- P. Brown, T. Alan Hatton and J. Eastoe, Curr. Opin. Colloid Interface Sci., 2015, 20, 140–150 CrossRef CAS.
- M. A. Amin, M. A. Ahmed, H. A. Arida, F. Kandemirli, M. Saracoglu, T. Arslan and M. A. Basaran, Corros. Sci., 2011, 53, 1895–1909 CrossRef CAS.
- F. El-Taib Heakal and A. E. Elkholy, J. Mol. Liq., 2017, 230, 395–407 CrossRef.
- R. Zana and J. Xia, Gemini surfactants: synthesis, interfacial and solution-phase behavior, and applications, Marcel Dekker, New York, 2003 Search PubMed.
- F. El-Taib Heakal, M. M. Osman, M. A. Deyab and A. E. Elkholy, Z. Phys. Chem., 2017, 231 DOI:10.1515/zpch-2017-0949.
- M. Deyab, M. Osman, A. Elkholy and F. El-Taib Heakal, RSC Adv., 2017, 7, 45241–45251 RSC.
- M. Deyab, K. Eddahaoui, R. Essehli, T. Rhadfi, S. Benmokhtar and G. Mele, Desalination, 2016, 383, 38–45 CrossRef CAS.
- H. M. Abd El-Lateef, M. A. Abo-Riya and A. H. Tantawy, Corros. Sci., 2016, 108, 94–110 CrossRef CAS.
- J. M. Zhao, H. B. Duan and R. J. Jiang, Corros. Sci., 2015, 91, 108–119 CrossRef CAS.
- F. El-Taib Heakal, A. S. Fouda and M. S. Radwan, Mater. Chem. Phys., 2011, 125, 26–36 CrossRef CAS.
- M. A. Amin, S. S. A. El-Rehim, E. El-Sherbini and R. S. Bayoumi, Electrochim. Acta, 2007, 52, 3588–3600 CrossRef CAS.
- M. A. Deyab and S. S. A. El-Rehim, J. Taiwan Inst. Chem. Eng., 2014, 45, 1065–1072 CrossRef CAS.
- F. Ivušić, O. Lahodny-Šarc, H. O. Ćurković and V. Alar, Corros. Sci., 2015, 98, 88–97 CrossRef.
- Q. Deng, H.-W. Shi, N.-N. Ding, B.-Q. Chen, X.-P. He, G. Liu, Y. Tang, Y.-T. Long and G.-R. Chen, Corros. Sci., 2012, 57, 220–227 CrossRef CAS.
- F. El-Taib Heakal and S. Haruyama, Corros. Sci., 1980, 20, 887–898 CrossRef CAS.
- A. El Bribri, M. Tabyaoui, B. Tabyaoui, H. El Attari and F. Bentiss, Mater. Chem. Phys., 2013, 141, 240–247 CrossRef CAS.
- A. M. Awad, O. S. Shehata and F. El-Taib Heakal, Appl. Surf. Sci., 2015, 359, 939–947 CrossRef CAS.
- A. E. Elkholy, M.Sc. thesis, Cairo University, 2017.
- A. Singh, Y. Lin, E. E. Ebenso, W. Liu, J. Pan and B. Huang, J. Ind. Eng. Chem., 2015, 24, 219–228 CrossRef CAS.
- H. Bentrah, Y. Rahali and A. Chala, Corros. Sci., 2014, 82, 426–431 CrossRef CAS.
- Q. Qu, Y. He, L. Wang, H. Xu, L. Li, Y. Chen and Z. Ding, Corros. Sci., 2015, 91, 321–329 CrossRef CAS.
- S. Banerjee, V. Srivastava and M. Singh, Corros. Sci., 2012, 59, 35–41 CrossRef CAS.
- M. Lebrini, F. Robert, H. Vezin and C. Roos, Corros. Sci., 2010, 52, 3367–3376 CrossRef CAS.
- G. Mu, T. Zhao, M. Liu and T. Gu, Corrosion, 1996, 52, 853–856 CrossRef CAS.
- X. Jiang, Y. Zheng and W. Ke, Corros. Sci., 2005, 47, 2636–2658 CrossRef CAS.
- D. K. Yadav, M. Quraishi and B. Maiti, Corros. Sci., 2012, 55, 254–266 CrossRef CAS.
- G. Karthik and M. Sundaravadivelu, Egypt. J. Pet., 2016, 25, 183–191 CrossRef.
- A. Satapathy, G. Gunasekaran, S. Sahoo, K. Amit and P. Rodrigues, Corros. Sci., 2009, 51, 2848–2856 CrossRef CAS.
- S. K. Shukla and M. Quraishi, J. Appl. Electrochem., 2009, 39, 1517–1523 CrossRef CAS.
- S. M. Tawfik and M. F. Zaky, Res. Chem. Intermed., 2015, 41, 8747–8772 CrossRef CAS.
- A. M. Al-Sabagh, N. G. Kandile, N. M. Nasser, M. R. Mishrif and A. E. El-Tabey, Egypt. J. Pet., 2013, 22, 351–365 CrossRef.
- M. Deyab, R. Essehli and B. El Bali, RSC Adv., 2015, 5, 48868–48874 RSC.
- M. A. Migahed, M. M. Shaban, A. A. Fadda, T. A. Ali and N. A. Negm, RSC Adv., 2015, 5, 104480–104492 RSC.
- N. A. Odewunmi, S. A. Umoren, Z. M. Gasem, S. A. Ganiyu and Q. Muhammad, J. Taiwan Inst. Chem. Eng., 2015, 51, 177–185 CrossRef CAS.
- J. C. da Rocha, J. A. d. C. P. Gomes and E. D'Elia, Corros. Sci., 2010, 52, 2341–2348 CrossRef.
- M. Hegazy, M. Abdallah and H. Ahmed, Corros. Sci., 2010, 52, 2897–2904 CrossRef CAS.
- D. Dwivedi, K. Lepková and T. Becker, RSC Adv., 2017, 7, 4580–4610 RSC.
- D. Asefi, M. Arami and N. M. Mahmoodi, Corros. Sci., 2010, 52, 794–800 CrossRef CAS.
- W. Ansari, J. Aslam and U. Siddiqui, J. Mol. Liq., 2012, 174, 5–10 CrossRef CAS.
- A. Y. Musa, A. A. H. Kadhum, A. B. Mohamad and M. S. Takriff, Mater. Chem. Phys., 2011, 129, 660–665 CrossRef CAS.
- E. Oguzie, C. Enenebeaku, C. Akalezi, S. Okoro, A. Ayuk and E. Ejike, J. Colloid Interface Sci., 2010, 349, 283–292 CrossRef CAS PubMed.
- F. El-Taib Heakal, A. Fouda and S. Zahran, Int. J. Electrochem. Sci., 2015, 10, 1595–1615 Search PubMed.
- F. El-Taib Heakal, S. A. Rizk and A. E. Elkholy, J. Mol. Struct., 2017 DOI:10.1016/j.molstruc.2017.09.079.
- F. El-Taib Heakal, S. K. Attia, S. A. Rizk, M. A. Abou Essa and A. E. Elkholy, J. Mol. Struct., 2017, 1147, 714–724 CrossRef CAS.
- X. Li, S. Deng, H. Fu and T. Li, Electrochim. Acta, 2009, 54, 4089–4098 CrossRef CAS.
- T. Ramde, S. Rossi and C. Zanella, Appl. Surf. Sci., 2014, 307, 209–216 CrossRef CAS.
- B. Stuart, Infrared spectroscopy, Wiley Online Library, 2005 Search PubMed.
- L. Chauhan and G. Gunasekaran, Corros. Sci., 2007, 49, 1143–1161 CrossRef CAS.
Footnote |
| † Electronic supplementary information (ESI) available. See DOI: 10.1039/c7ra07176k |
| This journal is © The Royal Society of Chemistry 2017 |

