DOI:
10.1039/C7RA07172H
(Paper)
RSC Adv., 2017,
7, 41745-41754
Synthesis and characterization of poly(ethylene terephthalate-co-1,4-cyclohexanedimethylene terephtlatate)-block-poly(tetramethylene oxide) copolymers†
Received
28th June 2017
, Accepted 21st August 2017
First published on 25th August 2017
Abstract
A series of poly(ethylene terephthalate-co-1,4-cyclohexanedimethanol terephthalate)-block-poly(tetramethylene oxide) (PETG-block-PTMO) copolymers were synthesized by means of a polycondensation process and characterized using 1H nuclear magnetic resonance (H NMR) and Fourier transform infrared spectroscopy (FTIR), that confirm the successful synthesis of the material. Differential scanning calorimetry (DSC), small – and wide-angle X-ray diffraction (SAXS and WAXS), and thermogravimetric analysis (TGA) were used in order to evaluate the influence of the block copolymers' composition and microstructure on the phase transition temperatures, thermal properties, as well as the thermooxidative and thermal stability of the PETG-block-PTMO copolymers, respectively. The mechanical properties were investigated by tensile testing and dynamic mechanical measurements (DMTA). We found that along with an increase in PTMO weight fraction, both number-average molecular weights and intrinsic visocisities increase. Moreover, an increase in the flexible segments content in PETG-block-PTMO resulted in shifting the values of glass transition temperatures toward lower ones, which was confirmed by DSC and DMTA analyses, thus affirming the miscibility of both phases. At the same time, along with an increase of PTMO flexible segments amount in the PETG-block-PTMO copolymers, the values of Young's modulus, tensile strength at yield and weight losses in lower temperatures range, i.e. 280–390 °C, decrease.
1. Introduction
Multi-blocks segmented poly(ether-ester)s (PEE)s have been extensively used for industrial applications where high strength and flexibility over a wide temperature range are desired.1 The increasing attention of R&D groups is due to a combination of rubber-like properties in the solid-state and melt processability.2 Many of these materials are composed of a rigid “hard” segment with a high glass transition temperature (Tg) and a rubbery “soft” segment with low Tg.2 The best example of this type of material is Hytrel® (Dupont), a family of compounds where the rigid segment is based on poly(butylene terephthalate) (PBT) and the rubbery segment is poly(tetramethylene oxide) (PTMO) (PBT-block-PTMO). The apparent cross-linked behaviour of the solid-state matrix is the result of crystalline domains of PBT, which crystallize from the melt to form physical crosslinks for the soft segments as well as any crystallized hard segment material.3 Moreover, the material, which might exhibit similar properties and thus could have the same applications as Hytrel® is block copolymer based on poly(ethylene terephthalate) (PET) as rigid segment (PET-block-PTMO).4 Additionally, since DuPont Tate & Lyle started to commercially manufacture 1,3-propanediol (bio-PDO, Susterra™, Zemea™),5 a new member of PEEs' group, based on poly(trimethylene terephthalate) (PTT) as the rigid segment, has been synthesized and characterized by Szymczyk et al.6 The overall features of the aforementioned PEEs depend on the chemical compatibility of hard and soft blocks and showed at least two-phase separated microstructures. For instance, in PET-block-PTMO, the phase separation occurs by the crystallization process of PET segments within amorphous PTMO chains.7 In turn, the study on the phase structure of PTT-block-PTMO showed two relaxation peaks corresponding to two glass transition temperatures of amorphous flexible polyether phase (PTMO) and rigid polyester phase (PTT).6 Therefore, it is of great importance to make the interfacial tension between rigid and soft phases stronger and thus to enhance the elastic properties of PEEs. If the hard and soft segments are miscible, one Tg could be observed.8 In this case, Tg increases with the increase of hard segment content.8
The cyclohexanedimethanol ([4-(hydroxymethyl) cyclohexyl] methanol, IUPAC) (CHDM) is a colourless solid glycol for modification of fibres and polyesters. Recently, Gue et al.9,10 investigated a new approach for preparation of CHDM via hydrogenation of bis(2-hydroxyethylene terephthalate) (BHET) obtained from waste PET. The incorporation of various content of CHDM within aromatic polyesters can lead to the development of different kinds of glycol modified co-polyesters with properties ranging from amorphous to highly crystalline.3 Poly(ethylene terephthalate)-co-1,4-cylclohexylenedimethylene terephthalate (PECT) is a non-crystalline amorphous co-polyester that can be synthesized using terephtalic acid (TPA) (or dimethyl terephthalate) (DMT), ethylene glycol (EG) and CHDM (up to 50 mol%).3,11 This glycol modified PET (PETG) exhibits unique advantages of clarity, high strength, low shrinkage, high dimensional stability and solvent resistance.12–15 One can apply it for transparent decoration parts, food and water packaging, medical, automobile, thin films and polymer foils.16–19
Polymer foils have been widely used in solar photovoltaic systems, constructions and buildings (cushions), embossing structures, food packaging and medical instruments.20,21 Polymer foil's thickness is ranging from 0.5 μm up to 1 mm. PET,22 polyfluoroethylene propylene (FEP),23,24 polytertrafluoroethylene (TFE),25 ethylene tetra fluoro ethylene (ETFE),26,27 polycarbonate,28 nylon 6, 6,29 PETG,30 etc. are some examples of the most commonly used polymer foils. Among them, PETG films have been performed in alkaline battery packing due to their excellent chemical resistance.31 Furthermore, Lee et al.32 employed PETG sheet for the concentrators due to its low glass transition temperature (81 °C), that made it possible to shape by simultaneously applying heat and vacuum. Similarly to PET, the PETG also exhibits very low notched impact strength and can be treated as a rigid brittle polymer.33 This poor elasticity of PETG can be improved by introducing a flexible PTMO segment into the chain. Therefore, the goal of this study is to synthesize and characterize the new type of PEEs containing rigid segments of PETG and soft segments of PTMO with excellent elastic properties. The composition and chemical structure of the series of block copolymers were determined by 1H quantitative nuclear magnetic resonance (NMR) and Fourier transform infrared spectroscopy (FTIR). The temperatures corresponding to phase transition changes were characterized by differential scanning calorimetry (DSC) and dynamic mechanical thermal analysis (DMTA). The crystallization behaviour of thin PETG-block-PTMO films were characterized by small-angle and wide-angle X-ray scattering (SAXS and WAXS). Additionally, the influence of PTMO segment on the tensile properties and thermal and thermo-oxidative stability has been analysed.
2. Experimental section
2.1. Synthesis of PETG-block-PTMO copolymers
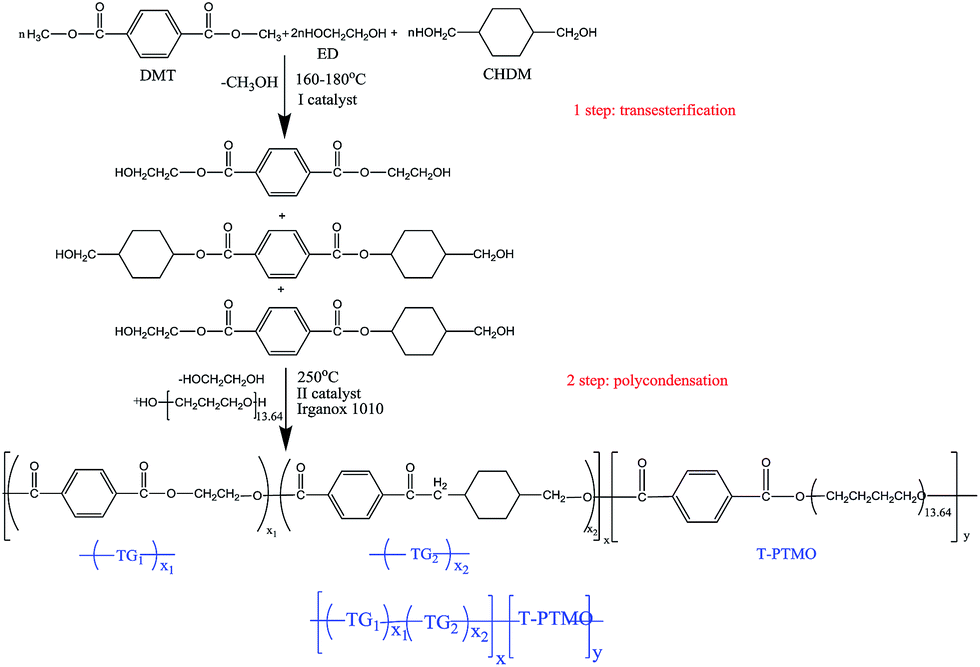
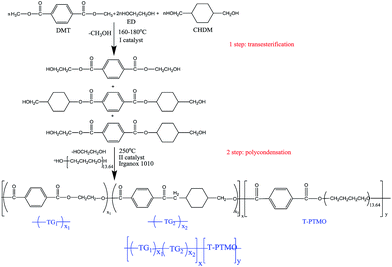
PETG-block-PTMO copolymers were prepared with several different PETG/PTMO weight ratios from dimethyl terephthalate (DMT, Sigma Aldrich), 1,2-ethylene glycol (ED, Sigma Aldrich), 1,4-cyclohexanedimethanol (CHDM, Sigma Aldrich) and poly(tetramethylene oxide) glycol (PTMG, Terathane 1000, DuPont, USA) with molecular weight of 1000 g mol−1, in two steps: the first one involved the transesterification of DMT by ED and CHDM in the presence of zinc acetate (Zn(CH3COO)2, Sigma Aldrich); whereas the second step was polycondensation, where PTMG was added in the presence of germanium dioxide (GeO2, PPM Pure Metals GmbH) and thermal stabilizer Irganox 1010 (Ciba – Geigy, Switzerland). The reaction was carried out in the 1 dm3 high pressure reactor (Autoclave Engineers Pennsylvania, USA) equipped with a vacuum pump, condenser, and cold trap for collecting the by-products. In the first step the reactor was charged with DMT, ED and CHDM with the proper ratios, and catalyst. The molar ratio of the diester (DMT) and diol (ED) was 1![[thin space (1/6-em)]](https://www.rsc.org/images/entities/char_2009.gif) :1.5. The transesterification reaction, was carried out under a constant flow of nitrogen at temperature of 160–180 °C for ca. two hours. During this step, methanol was distilled and collected as a by-product. The conversion of the transesterification reaction was calculated by monitoring the amount of effluent by-product. When the distillation of methanol has been ceasing, the reaction was completed and the temperature was gradually increased to up 210 °C. Then, the PTMG and thermal stabilizer (Irganox 1010) along with the second catalyst were introduced to the reactor. The reaction temperature was increased to 250 °C. Vacuum was applied gradually and the final pressure was lower than 25 Pa. The stirring torque change was monitored in order to estimate the melt viscosity of the product at temperature of 250 °C. The process was found to be finished, when the reaction mixture reached the same value of melt viscosity, which was estimated by monitoring the stirring torque. Finally the material was extruded from the reactor using compressed nitrogen into water bath.
:1.5. The transesterification reaction, was carried out under a constant flow of nitrogen at temperature of 160–180 °C for ca. two hours. During this step, methanol was distilled and collected as a by-product. The conversion of the transesterification reaction was calculated by monitoring the amount of effluent by-product. When the distillation of methanol has been ceasing, the reaction was completed and the temperature was gradually increased to up 210 °C. Then, the PTMG and thermal stabilizer (Irganox 1010) along with the second catalyst were introduced to the reactor. The reaction temperature was increased to 250 °C. Vacuum was applied gradually and the final pressure was lower than 25 Pa. The stirring torque change was monitored in order to estimate the melt viscosity of the product at temperature of 250 °C. The process was found to be finished, when the reaction mixture reached the same value of melt viscosity, which was estimated by monitoring the stirring torque. Finally the material was extruded from the reactor using compressed nitrogen into water bath.
The polycondensation reaction time was 2–3.5 h dependent from the weight content of PTMO segments. The PETG copolymer was synthesized following the same procedure. The reactions involved within this process are formulated in Scheme 1.
 |
| | Scheme 1 Synthesis of PETG-block-PTMO copolymers. | |
2.2. Samples preparation
The dumbbell shape samples (type A3) for DMTA and tensile measurements were obtained by injection moulding using Boy 15 (Dr BOY GmbH & Co., Germany) injection moulding machine with the following parameters: injection pressure 55 MPa, melt temperature 225 °C, mold temperature 30 °C, holding down pressure of 20 MPa for 15 s and cooling time of 10 s.
Thin polymer foils with the thickness of ∼220 μm were prepared for SAXS and WAXS measurements by press moulding (Collin P 200E) at 230 °C, and the pressure of 5 bar for 2 min and 10 bar for another 1 min. The thickness of thin films was measured with a Micrometer mod. 293-521 from Mitutoyo. The thickness is an average value.
2.3. Characterization methods
All the NMR spectra were collected at 25 °C on an Agilent Direct-Drive II 600M Hz spectrometer equipped with four broad-band rf channels and a 5 mm 1H-19F/15N-31P pulse field gradient (PFG) probe. Samples were dissolved in d-chloroform at the concentration of 10 mg mL−1. During the acquisition periods, 13C was decoupled by WURST-40. The 1H quantitative NMR spectra were collected with a 1.7 s acquisition time, 20 s relaxation delay, 9.6 kHz spectral window, 32 transients, and 9.1 μs 90° pulse width.
The PETG-block-PTMO copolymers were characterized using an FTIR spectrophotometer (Bruker Optik GmbH model Tensor 27). Measurements were carried out using the attenuated total reflectance (ATR) technique. Each sample was scanned 32 times at the resolution of 2 cm−1 over the frequency range of 4000–400 cm−1.
The intrinsic viscosity [η] of the series of block copolymers was determined at 30 °C in the mixture of phenol/1,1,2,2-tetrachloroethane (60/40 by weight). The concentration of the polymer solution was of 0.5 g dl−1. The measurement was carried using a capillary Ubbelohde viscometer (type Ic, K = 0.03294).
Size exclusion chromatography (SEC) in 1,1,1,3,3,3-hexafluoroisopropanol (HFIP) was performed at 40 °C on a system equipped with a waters 1515 Isocratic HPLC pump, a waters 2414 refractive index detector (35 °C), a waters 2707 auto sampler, and a PSS PFG guard column followed by two PFG-linear-XL (7 μm, 8 × 300 mm) columns in series. HFIP with potassium trifluoroacetate (3 g L−1) was used as the eluent at a flow rate of 0.8 mL min−1. The molecular weights were calculated against poly(methyl methacrylate) standards (Polymer Laboratories, Mp = 580 Da up to Mp = 7.1 × 10⁶ Da).
The amorphous structure of the samples was confirmed by differential scanning calorimeter (DSC). Measurements were carried out with a DSC1 (Mettler Toledo) which was calibrated for the temperature and melting enthalpy by using indium and n-octane as a standards under a N2 atmosphere with a heating rate of 10 K min−1 in the temperature range of 25–300 °C. Then, from the second heating the glass transition Tg and corresponding heat capacity were determined.
The dynamic mechanical thermal analysis (DMTA) has been performed using a Polymer Laboratories MK II apparatus working in a bending mode in a temperature range from −100 °C to the polymer melt temperature, at a frequency of 1 Hz and the heating rate of 3 °C min−1. The properties were determined on the basis of modulus changes and the ability of attenuation as a function of temperature and frequency of load changes.
WAXS and SAXS experiments were carried out at the NCD beamline (BL11) of the Alba synchrotron radiation light facility of Cerdanyola del Vallè s (Catalunya). The beam was monochromatized to a wavelength of 0.1 nm. The SAXS detector was calibrated with diffractions of a silver behenate standard sample. The diffraction profiles were normalized to the beam intensity and corrected considering the empty sample background. The X-ray scattering intensity, I(q), was experimentally determined as a function of the scattering vector, which was obtained according to equation: q = (4π/λ)sinθ, where λ is the X-ray wavelength and 2θ is the scattering angle. The position of the scattering maximum, on the Lorentz-corrected SAXS patterns, was used for the calculation of the long period (L) according to eqn (2): L = 2π/qmax.
The tensile properties of the prepared PETG-block-PTMO copolymers were measured using Autograph AG-X plus (Shimadzu) tensile testing machine equipped with a 1 kN Shimadzu load cell, an contact optical long travel extensometer and the TRAPEZIUM X computer software, operated at a constant crosshead speed of 5 mm min−1. Measurements were performed at room temperature on the dumbbell samples with the grip distance of 20 mm. According to DIN 53455 standard, the tensile modulus, stress at 100% strain, yield stress and strain, stress and elongation at break of the block copolymers were determined. Five measurements were conducted for each sample, and the results were averaged to obtain a mean value.
The thermo-oxidative and thermal stability of the synthesised PETG-block-PTMO copolymers were evaluated by thermogravimetry (TGA 92-16.18 Setaram) using the system measuring simultaneously TG-DSC. Measurements were carried out in an oxidizing atmosphere i.e. dry, synthetic air (N2:O2 = 80:20 vol%) and in an inert atmosphere (argon). The study was conducted at a heating rate of 10 °C min−1 in the temperature range of 20–700 °C. Measurements were conducted in accordance with the PN-EN ISO 11358:2004 standard.
3. Results and discussion
3.1. NMR and FTIR analyses on structure and composition
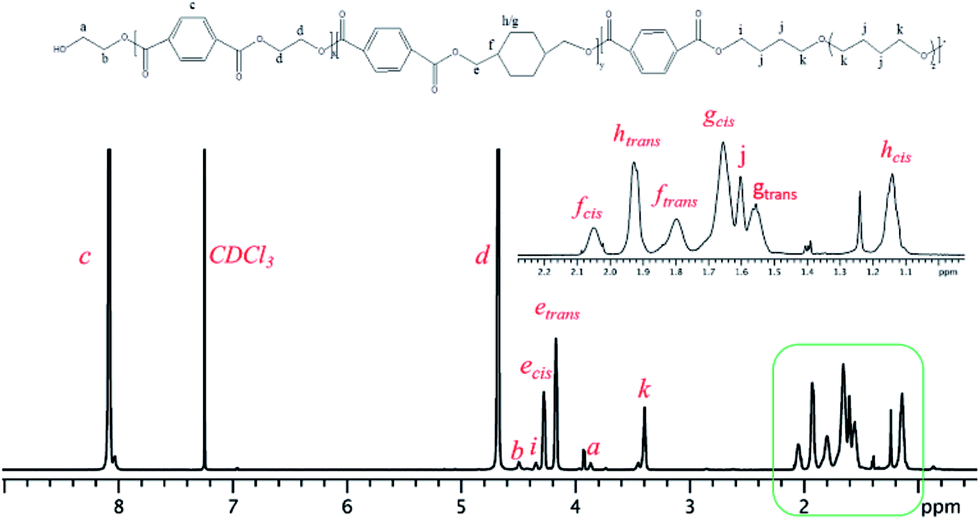
PETG-block-PTMO samples were characterized by an improved PETG-block-PTMO samples were characterized by an improved quantitative NMR technique to verify the structure details via end-groups estimation method34 following the similar procedure used for the characterization of poly(ether ester) multiblock copolymers.35,36 Fig. 1 shows the 1H NMR spectra of PETG-block-PTMO 95/5 copolymer, with the interested region enlarged, while others are presented in ESI (Fig. S1–S3†). It is hard to assign these fine peaks to corresponding chemical structure, thus the 1H NMR, 1H-13C gHSQC and 1H-1H gCOSY 2D NMR spectra of PETG copolymer (copolymer of PET and PCT with PCT ratio of 30%) were carried for comparison (Fig. 2, S4 and S5†). The methylene (yellow coloured cross-peaks) and methine groups (blue coloured cross-peaks) are distinguished by 1H-13C gHSQC spectra of PETG homopolymers (Fig. S5†).
 |
| | Fig. 1 1H quantitative NMR spectra of PETG-block-PTMO 95/5 sample. Solvent: CDCl3. | |
In 1H NMR, the peaks at chemical shifts of 1.80 ppm (f2) and 2.05 ppm (f1) are assigned to the methine groups, while that at 4.17 (e2) ppm and 4.29 ppm (e1) to the methylene groups connected with ester bonds at trans- and cis-form of cyclohexanedimethylene repeating units, respectively. This is confirmed by the 1H-1H gCOSY 2D NMR spectra of PETG homopolymers, as presented in Fig. 2, where the correlations between e2 and f2, e1 and f1, are observed, confirming they are adjacent groups. The correlation between peak a and b indicates these two methylene groups are chain-end groups, which can be used for the estimation of polymer structure.
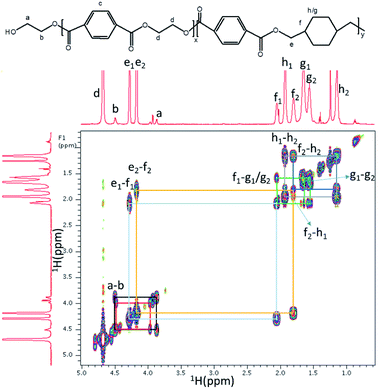 |
| | Fig. 2 1H-1H gCOSY NMR spectrum of PETG sample. Solvent: CDCl3. | |
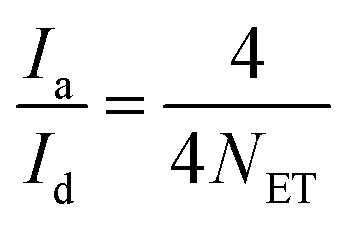
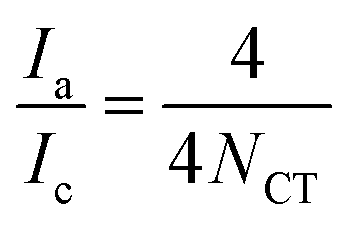
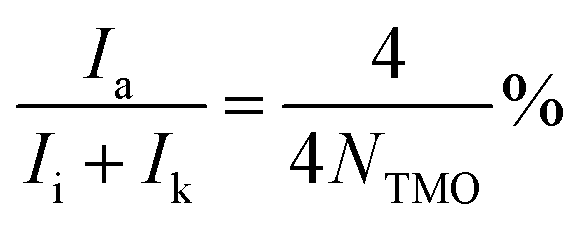
The number-average molecular weights (Mn) of PETG-block-PTMO copolyesters, in addition to PET, PTMO, PCT content and average repeating units in a polymer chain, can be estimated from the hydroxyl methylene chain ends (peak a), the methylene groups from PET segments (peak d), from PCT segments connected with ester bonds (peak e), from PTMO segments linked to ether or ester bonds (peak i + peak k), respectively, via the following equations:
| |
 | (1) |
| |
 | (2) |
| |
 | (3) |
| | |
Mn = 192NET + 274NCT + 72NTMO
| (4) |
where
Ia,
Id,
Ie,
Ii,
Ik is the integrals from corresponding peaks,
NET,
NCT,
NTMO the average repeating units of ET, CT and TMO in PETG-
block-PTMO chain, respectively. The calculated data from NMR spectra are listed in
Table 1.
Table 1 The structure of PETG-block-PTMO copolymers from 1H NMR spectra
| Sample |
NET |
NCT |
NTMO |
Mn (kg mol−1) |
rET/CT |
PTMO% |
| PETG-block-PTMO 95/5 |
59.1 |
28.1 |
10.5 |
19.8 |
2.10 |
3.8 |
| PETG-block-PTMO 90/10 |
69.4 |
31.7 |
21.0 |
23.5 |
2.18 |
6.4 |
| PETG-block-PTMO 80/20 |
62.9 |
32.6 |
47.4 |
24.4 |
1.94 |
14.0 |
| PETG-block-PTMO 70/30 |
58.1 |
29.3 |
81.2 |
25.0 |
1.99 |
23.4 |
The number-average molecular weights of PETG-block-PTMO copolymers estimated from 1H NMR spectra are all around 20 kg mol−1, indicating the well control of the molecular weights during polymerization. The average mole ratio of the repeating units of ET to CT (rET/CT) in the copolymers, is around 2. This is slightly lower than the feeding ratio (2.33), but is quite reasonable since some ethylene glycol is distilled out during polymerization process. The content of PTMO in the poly(ether ester)s (weight fraction, PTMO%), is lower than the feeding ratio. This means some of the PTMO decomposed during the polymerization process, which is common during the traditional poly(ether ester) synthesis process, leading to the decrement of PTMO content in the final product. On the other hand, the trans/cis ratio of CHDM in PETG-block-PTMO, calculated from the integral ratio from peak e2 to e1, is all about 1.50, similar to previous PETG copolyester systems (1.45).
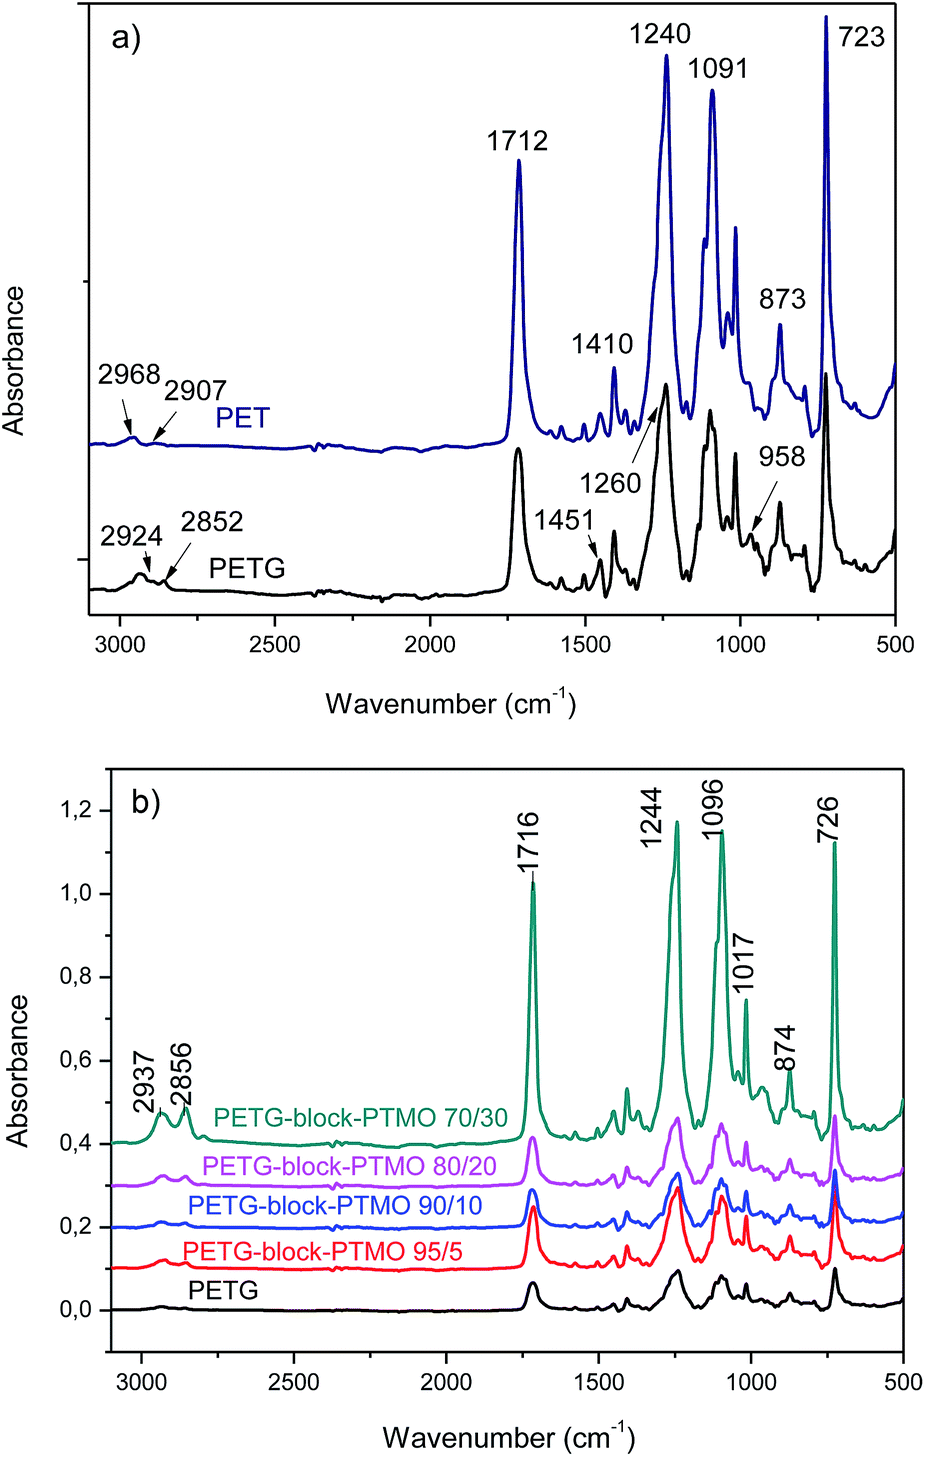
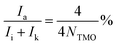
FTIR analysis. Fig. 3a shows the FTIR spectra of PET and PETG, in which the peak at 1712 cm−1 displays the C![[double bond, length as m-dash]](https://www.rsc.org/images/entities/char_e001.gif) O of ester groups, and the C–H out-of-plane deformation of two carbonyl substituents on the aromatic ring depicts at 730 cm−1.14,37 The two peaks at 1410 and 1240 cm−1 are ascribed to –CH2– deformation band and C(O)–O stretching of ester groups, respectively.38 The asymmetric and symmetric aliphatic C–H stretching vibrations were detected in 2907 and 2968 cm−1 for PET.39 However, in PETG copolymer, the peaks attributed to C–H stretching were shifted to the lower wavenumbers at 2852 and 2924 cm−1 which is due to the presence of methyl groups in the structure of this polymer.31,40 Moreover, the C–H stretching peak of cyclohexylene ring was found at 958 cm−1. Fig. 3b depicts the FTIR spectra of PETG-block-PTMO copolymers with various content of PTMO ranging from 0–30 wt%. It is obvious that no new peaks and bonds were observed in the spectra of PEEs rather than PETG copolymers. Only a small shift in PETG spectra from 1244 cm−1 to lower wavenumbers was observed with the increase in PTMO content. Moreover, at higher content of PTMO soft segments (30%), the increase in the magnitude of the absorbance (relative intensity) was observed because of the flexibility of PEEs. In this case, the intensity of carbonyl stretching peaks at 1244 cm−1 and 1716 cm−1 increased significantly.
O of ester groups, and the C–H out-of-plane deformation of two carbonyl substituents on the aromatic ring depicts at 730 cm−1.14,37 The two peaks at 1410 and 1240 cm−1 are ascribed to –CH2– deformation band and C(O)–O stretching of ester groups, respectively.38 The asymmetric and symmetric aliphatic C–H stretching vibrations were detected in 2907 and 2968 cm−1 for PET.39 However, in PETG copolymer, the peaks attributed to C–H stretching were shifted to the lower wavenumbers at 2852 and 2924 cm−1 which is due to the presence of methyl groups in the structure of this polymer.31,40 Moreover, the C–H stretching peak of cyclohexylene ring was found at 958 cm−1. Fig. 3b depicts the FTIR spectra of PETG-block-PTMO copolymers with various content of PTMO ranging from 0–30 wt%. It is obvious that no new peaks and bonds were observed in the spectra of PEEs rather than PETG copolymers. Only a small shift in PETG spectra from 1244 cm−1 to lower wavenumbers was observed with the increase in PTMO content. Moreover, at higher content of PTMO soft segments (30%), the increase in the magnitude of the absorbance (relative intensity) was observed because of the flexibility of PEEs. In this case, the intensity of carbonyl stretching peaks at 1244 cm−1 and 1716 cm−1 increased significantly.
 |
| | Fig. 3 FTIR spectra of (a) PET and PETG (b) PETG-block-PTMO copolymers and PETG. | |
3.2. Physicochemical properties of PETG-block-PTMO copolymers
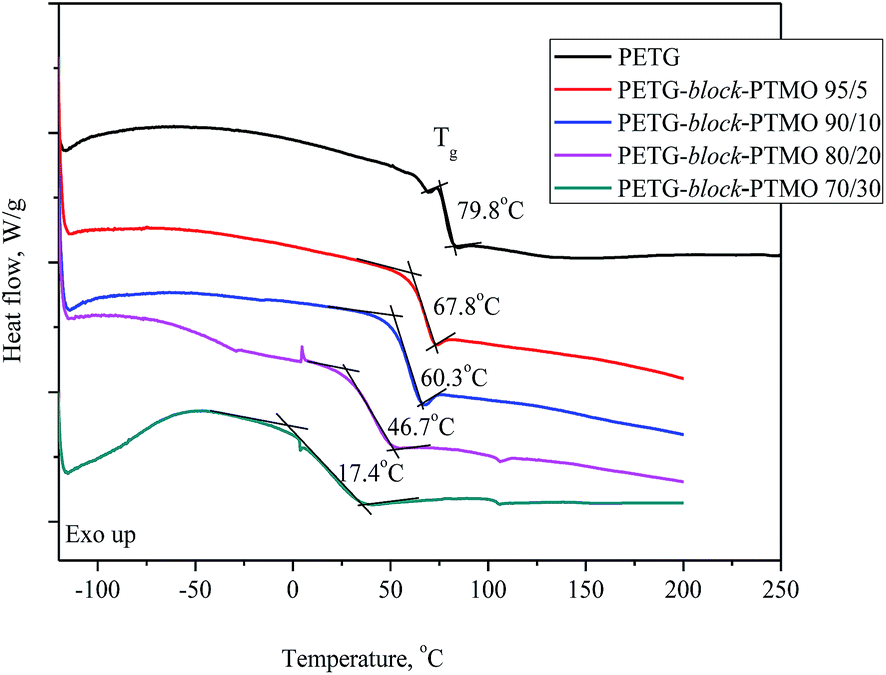
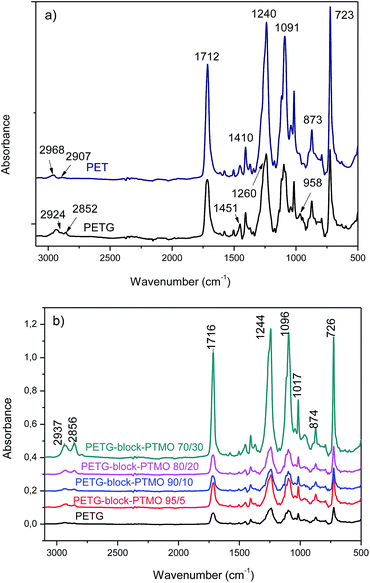
A series of thermoplastic copoly(ester-ethers) based on rigid PETG and flexible PTMO segments (PETG-block-PTMO) was prepared by two-stages reaction, by means of transesterification and polycondensation. Since, the PETG-block-PTMO copolymer can be presented as a random copolyester (terephthalate units (TG1 and TG2) and T-PTMO units), one can find the possibility to calculate the degree of polymerization (polycondensation) of rigid segments. The theoretical chemical composition of the series of synthesised block copolymers and its basic physicochemical properties, by means of number-average molecular mass (Mn), weight-average molecular mass (Mw), polydispersity index (PDI), intrinsic viscosity [η], glass transition temperature (Tg) and corresponding heat capacity are summarized in Table 2. The average length of the rigid PETG segment (degree of polymerization “x”) was calculated accordingly to 1 mol of flexible segment T-PTMO (y = 1 on Scheme 1). The degree of polymerization of PETG rigid segments, calculated from the reaction compositions, ranged from 111.82 (PETG-block-PTMO 95/5) to 13.72 (PETG-block-PTMO 70/30). The limiting viscosity number [η] of polymers/copolymers can be influenced by the molecular chains' weight and their flexibility.41 In the present study the value of [η] for PETG homopolymer equals to 0.696, which was slightly higher than that for the previously published in.42 While, the values of intrinsic viscosity for the series of copolymers increase along with an increase of weight fraction of PTMO segments from 0.59 dl g−1 to 0.659 dl g−1 (Table 2). The increase of [η] values along with an increase in the PTMO content in the copolymer chain can suggest that the obtained block copolymers exhibit comparable or higher molecular weight than PETG, synthesized at the same conditions. This suggestion was confirmed by SEC analysis. The number of average molecular masses of the copolyesters in these series ranged from 19512 to 27086 g mol−1 (Table 2), while the polydispersity index was in the range 2.13–2.48. At the same time, from the DSC thermograms (Fig. 4) one can find that PETG and PTMO segments did not segregate into separate phase in the solid state (only one Tg is observed), which indicate on the thermodynamic miscibility of the segments. The Tg value for PTMO equals to −84 °C,2,43 whilst the glass transition temperature for PETG is 79.8 °C (Table 2), and since the values of Tg (only one glass transition shift is observed for all systems) decrease along with an increasing content of PTMO, one can draw the conclusions about the miscibility of both phases.
Table 2 Composition and basic physicochemical characteristics of PETG and PETG-block-PTMO copolymersa
| Sample |
ws (wt%) |
x (mol mol−1) |
[η] (dl g−1) |
Mn [g mol−1] |
Mw [g mol−1] |
DPI |
Tg (°C) |
Δcp (J gK−1) |
| ws—weight fraction of PTMO segments; x—degree of polymerization of rigid segment with reference of 1 mol of T-PTMO unit; [η]—limiting viscosity number; Mn—number-average molecular mass; Mw—weight-average molecular mass; PDI—polydispersity index; Tg—glass transition temperature; Δcp—heat capacity. |
| PETG |
0 |
— |
0.696 |
19512 |
43125 |
2.21 |
79.8 |
0.380 |
| PETG-block-PTMO 95/5 |
5 |
111.82 |
0.590 |
20190 |
44399 |
2.20 |
67.8 |
0.330 |
| PETG-block-PTMO 90/10 |
10 |
52.97 |
0.603 |
24047 |
51220 |
2.13 |
60.3 |
0.386 |
| PETG-block-PTMO 80/20 |
20 |
23.54 |
0.620 |
27086 |
67173 |
2.48 |
46.7 |
0.547 |
| PETG-block-PTMO 70/30 |
30 |
13.72 |
0.659 |
26510 |
59647 |
2.25 |
17.4 |
0.416 |
 |
| | Fig. 4 DSC thermograms of PETG-block-PTMO copolymers at different wt% content of PTMO segments. | |
3.3. Phase structures and morphology
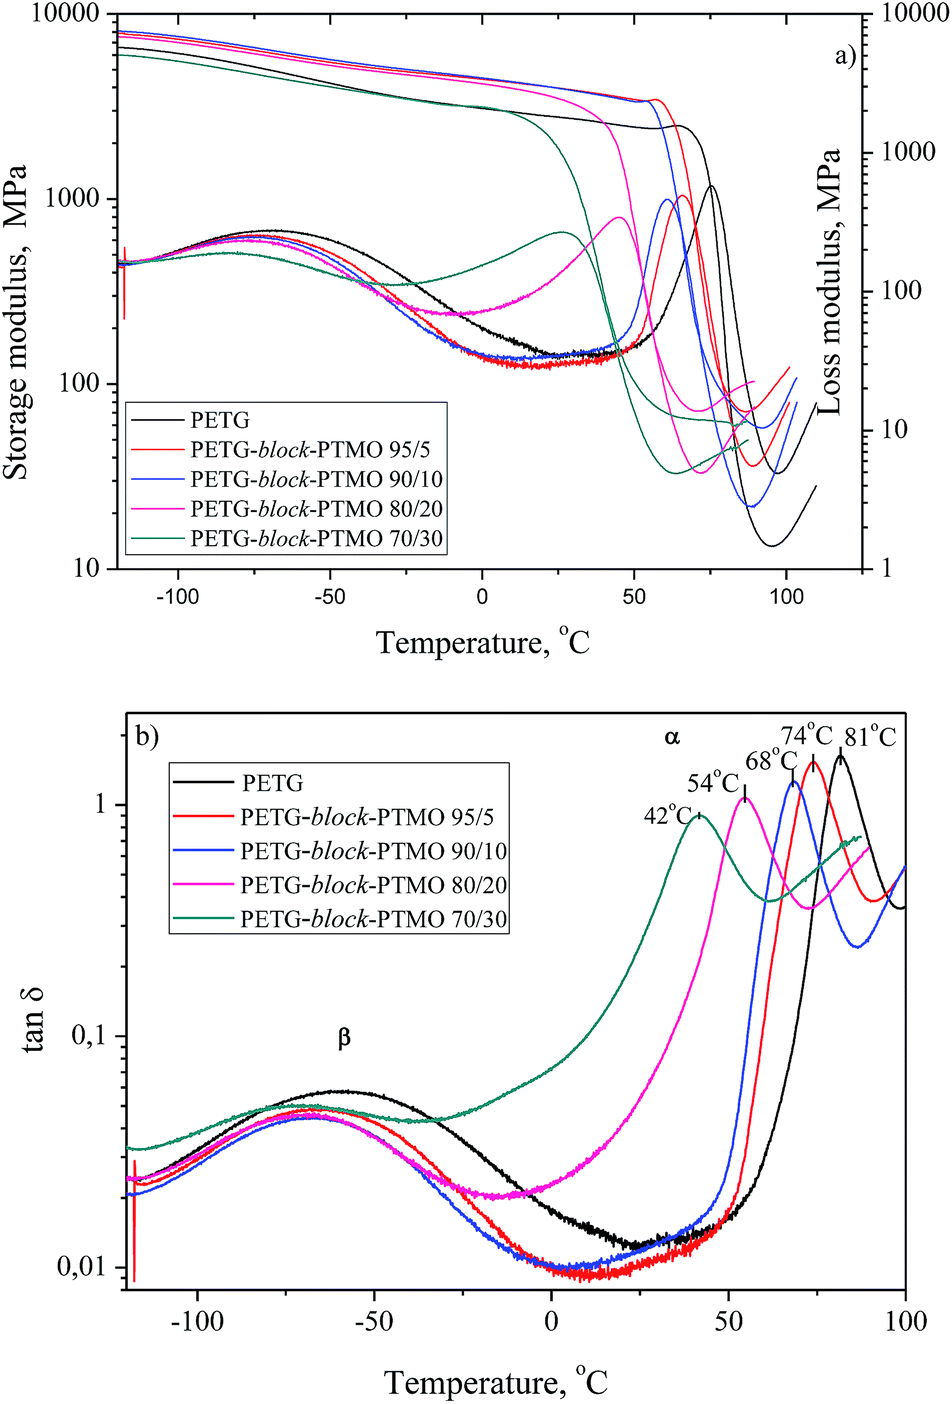
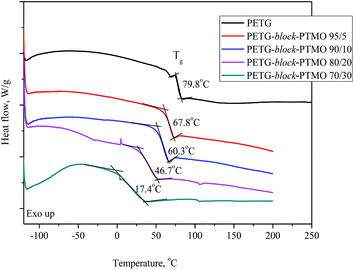
The results of dynamic mechanical thermal analysis for the series of PETG-block-PTMO are presented in Fig. 5, where the storage and loss modulus (a) and tanδ (b) are plotted as a function of temperature. For PETG-block-PTMO copolymers the α-relaxations observed on the maximum of loss modulus (Fig. 5a) and tanδ (Fig. 5b) is due to the glass transition of soft amorphous phase. The drop of the storage modulus (E′) (Fig. 5a) is dependent on composition of the series of block copolymers and is related to the glass transition of the synthesized material. A single drop, observed for each copolymer, as well as for neat PETG suggest on the miscibility of both phases, unlike in the case of polyester elastomers based on PET and PEO, where the presence of four different domains dependent on thermal history and composition have been observed by Fakirov et al.44 For neat PETG one can observe two dynamic mechanical viscoelastic relaxations α and β. The ∼80 °C α-relaxation on tanδ curves is the glass transition. The β-relaxation in the temperature range of −80 to −30 °C on loss modulus (E′) and tanδ curves is attributed to the re-orientation of the hydroxyl groups and local motions of the carboxyl groups in the amorphous phase.45 As the weight content of flexible segments in PETG-block-PTMO copolymers increased, the glass transition peak (α) of soft phase is shifted toward lower temperature, from 81 °C (PETG) to 42 °C (for PETG-block-PTMO 70/30). The DSC and DMTA analyses confirmed the two-phase structure of PETG-block-PTMO copolymers and thermodynamic miscibility of both phases.
 |
| | Fig. 5 The storage modulus E′, loss modulus E′ and tanδ as a function of temperature for PETG-block-PTMO copolymers. | |
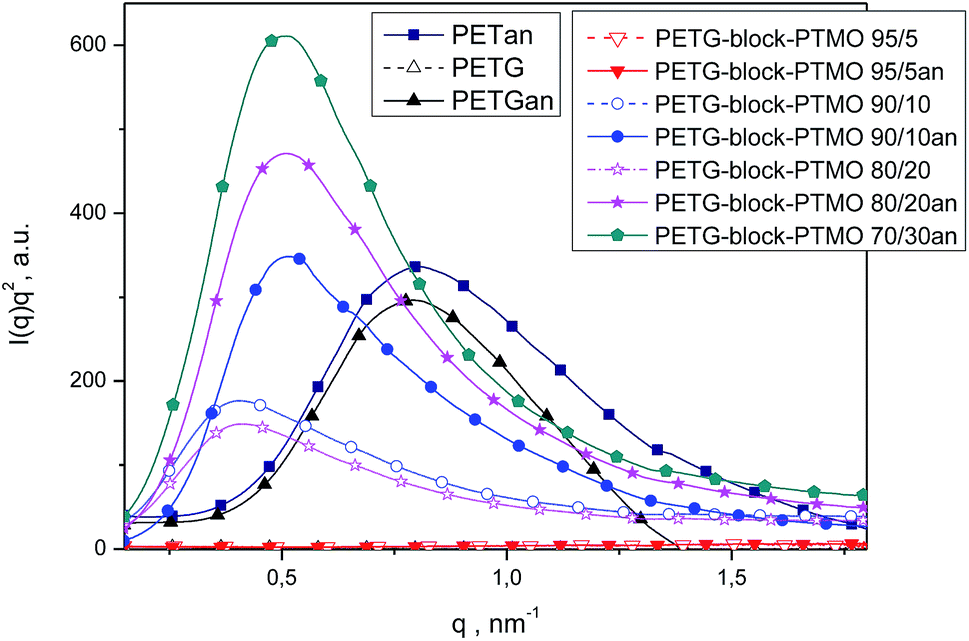
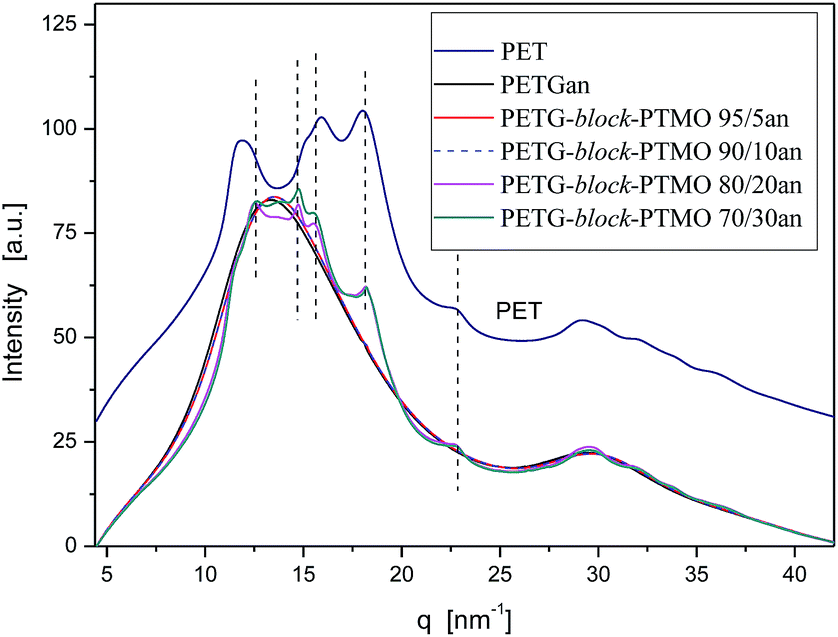
The morphology of PETG and PETG block copolymers films was studied by SAXS and WAXS techniques. Fig. 6 and 7 show the SAXS and WAXS patterns of PETG and PETG based block copolymers in comparison with semicrystalline PET film. For PETG and PETG copolymers containing above 10 wt% of PTMO blocks in copolymer the lamellar nanostructure formation was confirmed. PETG copolymers exhibit the same diffraction patterns and positions as PET, indicating that PET crystals are present in annealed films. The determined values of long period for PETG and PETG based block copolymers are presented in Table 3. The PETG-block-PTMO copolymers show higher values of long period in comparison with semi-crystalline PET and PETG. The higher values of long period for PETG copolymers can be attributed to the growth of the amorphous domains and sub-domains resulting in the coalescence of PETG and PTMO sub-domains.41
 |
| | Fig. 6 Lorentz-corrected SAXS patterns for prepared amorphous and annealed above Tg films of PETG, PETG copolymers and semicrystalline PET. | |
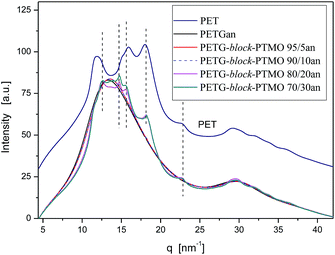 |
| | Fig. 7 WAXS patterns for annealed films of PETG, PETG copolymers and semicrystalline PET. | |
Table 3 Long period determined for PETG and PETG copolymers films as prepared and later after annealing above Tg
| Samples |
PET |
PETG |
PETG-block-PTMO 95/5 |
PETG-block-PTMO 90/10 |
PETG-block-PTMO 80/20 |
PETG-block-PTMO 70/30 |
| Annealed films L (nm) |
7.79 |
7.93 |
— |
12.21 |
12.31 |
12.42 |
| Prepared films L (nm) |
— |
— |
— |
15.47 |
15.32 |
14.14 |
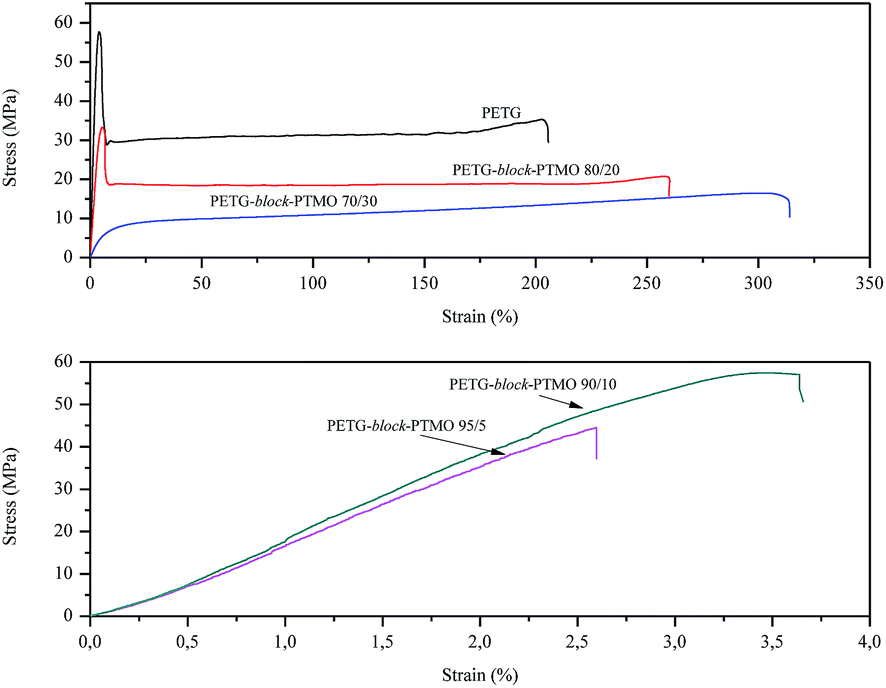
3.4. Tensile properties
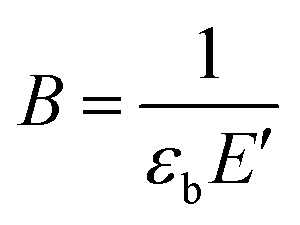
In block copolymers, the nanometric structure of rigid and flexible segments is responsible for their mechanical properties by means of: rigid segments of PETG for an increase in strength, whereas flexible segments of PTMO for the elastic properties. Stress–strain curves of the synthesised block copolymers are presented in Fig. 8. Moreover, the characteristic parameters, i.e. values of Young's modulus (E), tensile strength and elongation at yield (σy, εy) and strength and elongation at break (σb, εb) are summarized in Table 4. Along with an increase in flexible segments content, the decrease in Young's modulus and strength at break were observed, which results from the decrease of domains that are contributed to strength. The tensile strength at yield decreased from 57.7 MPa (for PETG) to 44.5 MPa for PETG-block-PTMO 95/5 (only for these two samples it could have been estimated), whereas the values of elongation at break for the series of block copolymers, firstly decreased of about two orders of magnitude from 205.9% (PETG) to ca. 3% (for PETG-block-PTMO 95/5 and PETG-block-PTMO 90/10) and then increase to 314.1% for PETG-block-PTMO 70/30. This initial decline and further increase (above 20 wt% of PTMO) in the values of strength and elongation at break might result from the thermodynamic miscibility of both phases, which was previously confirmed by DSC and DMTA analyses. Moreover, following Brostow et al.,46,47 who demonstrated the existence of a quantitative relationship between toughness (τ) and brittleness (B), valid for polymers with a wide range of chemical structures and properties, one calculated B accordingly to eqn (5):| |
 | (5) |
where εb is the elongation at break and E′ is the storage modulus determined by DMTA at 1 Hz and 25 °C. The descriptor B turned out to be useful in evaluating polymer blends,48 multi-layer laminate composites49 and many more.47 In the case of linear low density polyethylene/cycloolefin copolymer blends,48 the rates of change of εb and E′ were different, thus affecting the outcome in B with changing concentration of components. B decreased when a rigid copolymer was added to linear low-density polyethylene.48 Herein, it can be seen (Table 4) that the addition of PTMO soft segments of 5 and 10 wt% increases the brittleness of the block copolymers. However, further increase in the amount of PTMO, i.e. 20 and 30 wt% reduces the brittleness of the materials.
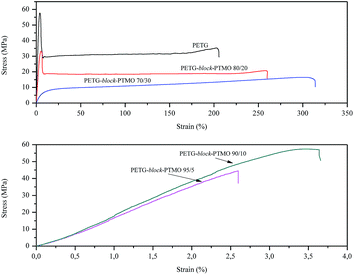 |
| | Fig. 8 The stress–strain curves of PETG-block-PTMO copolymers. | |
Table 4 Tensile properties of PETG-block-PTMO copolymersa
| Sample |
E (MPa) |
σy (MPa) |
εy (%) |
σb (MPa) |
εb (%) |
B (1012 (% Pa)) |
| E – Young's Modulus (calculated from strain 0.05% to 0.25%); σy – tensile strength at yield, σb, εb – strength and elongation at break respectively, B-(=1/(εbE′)) – brittleness.46,47 |
| PETG |
1470.0 ± 20.9 |
57.7 ± 0.3 |
3.9 ± 0.2 |
35.3 ± 0.4 |
205.9 ± 2.9 |
1.7536 |
| PETG-block-PTMO 95/5 |
1425.9 ± 43.3 |
— |
— |
44.5 ± 0.2 |
2.6 ± 0.2 |
131.6806 |
| PETG-block-PTMO 90/10 |
1405.3 ± 41.5 |
— |
— |
57.4 ± 0.9 |
3.7 ± 0.2 |
92.7929 |
| PETG-block-PTMO 80/20 |
1072.1 ± 31.2 |
33.3 ± 2.5 |
5.5 ± 0.1 |
20.7 ± 0.7 |
259.7 ± 9.8 |
1.5723 |
| PETG-block-PTMO 70/30 |
146.3 ± 7.3 |
3.4 ± 0.2 |
2.8 ± 0.1 |
16.5 ± 0.8 |
314.1 ± 17.7 |
2.9645 |
3.5. Thermal stability
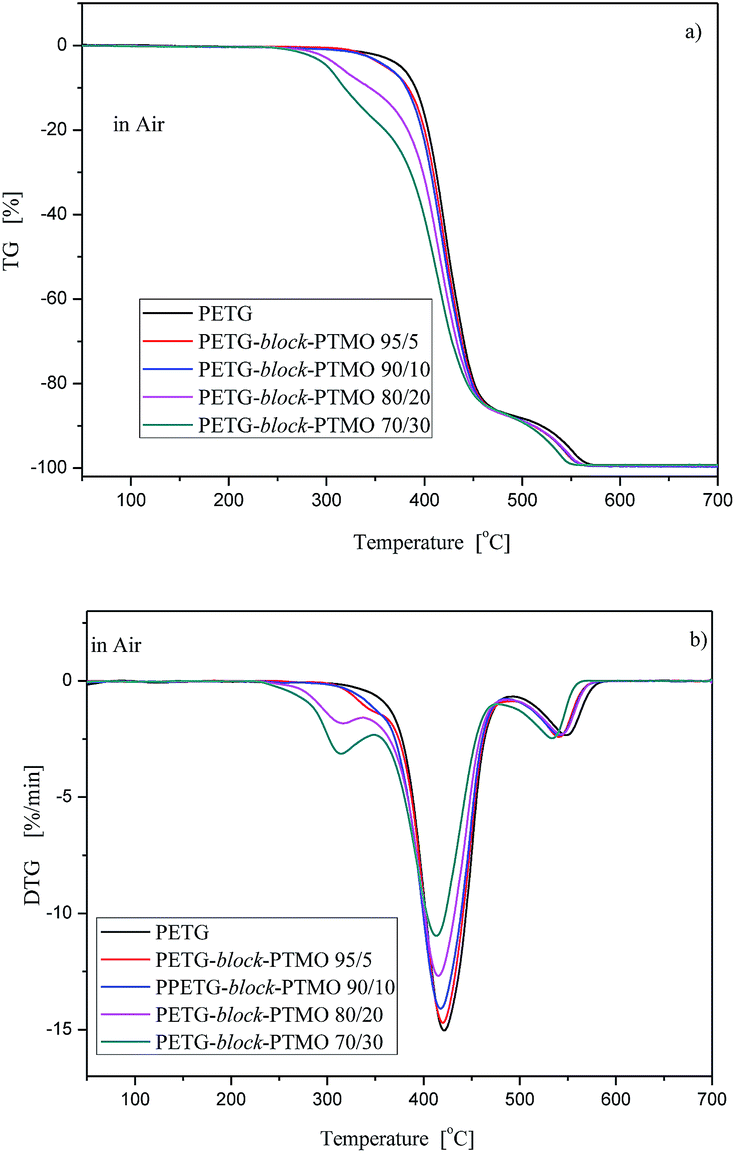
One of the parameters, that can limit the applications of the newly synthesised polymer materials, it's their thermal stability. The thermooxidative (air) and thermal (argon) stability of the PETG-block-PTMO copolymers were studied, and the TG and DTG curves with different contents of flexible PTMO segments are presented in Fig. 9 and 10. Additionally, the characteristic temperatures of 5, 25, 50 and 90% of weight loss, in air and argon atmospheres are summarized in Table 5. In air atmosphere, the PETG exhibits two steps of degradation, which appear at 350–470 °C and 500–570 °C. While, for PETG-block-PTMO copolymers, three stages of the decomposition can be observed: (1) in the temperature range of 254–350 °C; (2) in the temperature range 350–460 °C and (3) in the temperature range of 480–560 °C. The first two stages one can attribute to the decomposition of flexible and rigid segments. In poly(ether-ester) block copolymers it is well-known that in raised temperature the attack of oxygen molecules is initiated in the flexible segment and, in most cases occurs at the α-carbon atom to the ether oxygen atom.41,50 In turn, the third stage is attributed to the decomposition of residue. Additionally, the values of weigh losses decrease along with the increasing content of PTMO flexible segments of about 70 to 16 °C, for 5% and 90% weight loss, respectively.
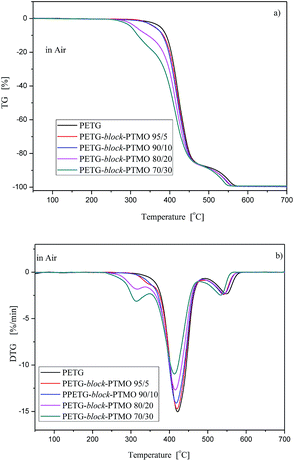 |
| | Fig. 9 TG (a) and DTG (b) curves for PETG-block-PTMO copolymers under air atmosphere at heating rate 10 °C min−1. | |
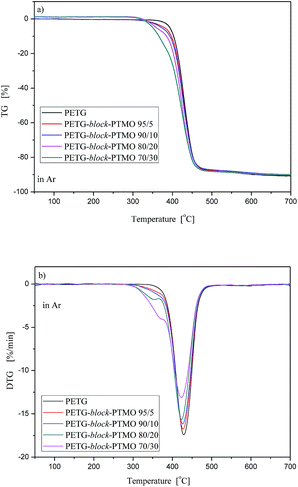 |
| | Fig. 10 TG (a) and DTG (b) curves for PETG-block-PTMO copolymers under argon atmosphere at heating rate 10 °C min−1. | |
Table 5 TGA data: temperature of 5%, 25%, 50% and 90% weight loss in an inert and oxidizing atmosphere
| Sample |
T5%, °C |
T25%, °C |
T50%, °C |
T90%, °C |
| Ar |
Air |
Ar |
Air |
Ar |
Air |
Ar |
Air |
| PETG |
393.5 |
376.3 |
417.1 |
408.3 |
431.5 |
425.4 |
602.9 |
519.8 |
| PETG-block-PTMO 95/5 |
379.8 |
360.5 |
414.2 |
405.1 |
429.6 |
422.9 |
637.3 |
511.4 |
| PETG-block-PTMO 90/10 |
372.5 |
361.9 |
412.6 |
402.5 |
428.6 |
421.1 |
702.5 |
512.1 |
| PETG-block-PTMO 80/20 |
358.9 |
313.2 |
407.4 |
392.2 |
424.5 |
415.8 |
664.7 |
512.1 |
| PETG-block-PTMO 70/30 |
350.1 |
301.2 |
398.5 |
375.9 |
421.3 |
409.2 |
— |
506.6 |
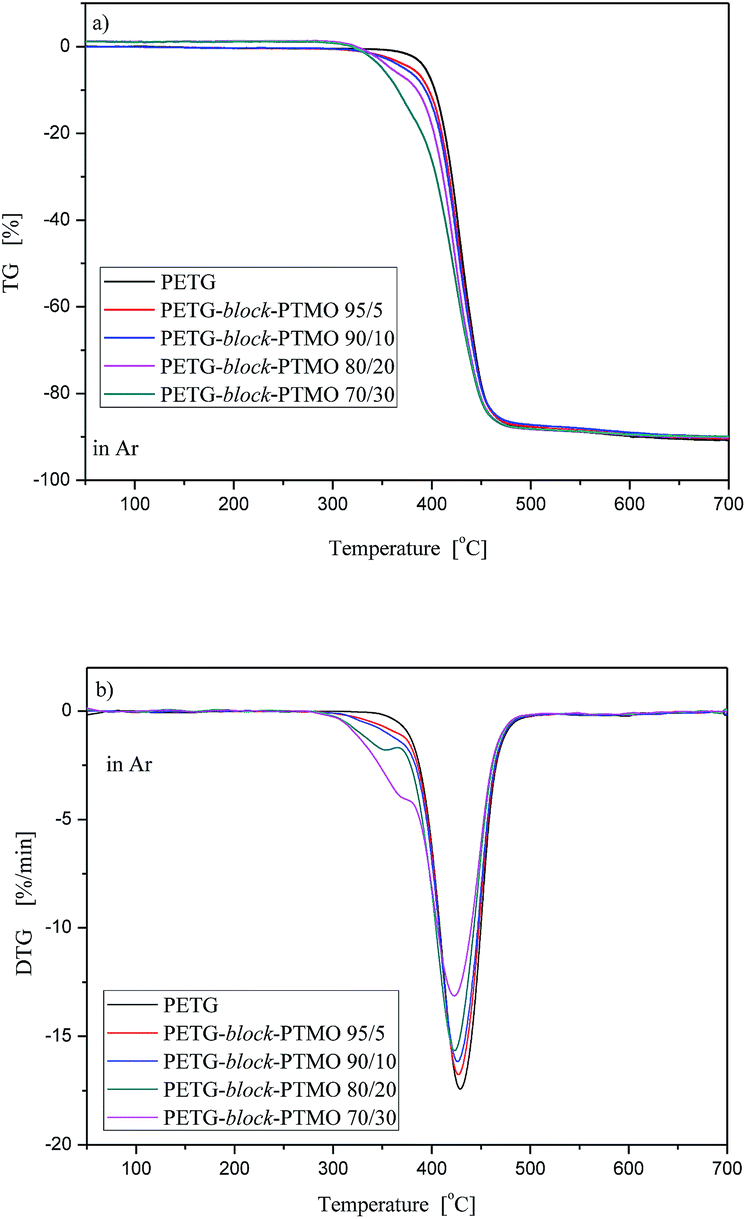
Moreover, from the shapes of TG and TDG curves one can observe that in argon atmosphere, the thermal behaviours of PETG-block-PTMO copolymers were comparable to one another, and only in lower temperature range (280–390 °C) the differences were observed. It was strongly connected with the PTMO flexible segment content. Along with an increase in of PTMO content the temperature at the maximum decomposition rate of is shifted to lower values. Moreover, similarly as above, the values of the characteristic temperatures of 5, 25, 50 and 90% of weight loss were shifted toward lower values.
4. Conclusions
The series of PETG-block-PTMO copolymers with different content of flexible PTMO segment were synthesized by means of a two-step melt polycondensation process and characterized by various methods. The rigid segments of PETG as well as the flexible PTMO ones were randomly distributed along the chain. Due to the partial thermodynamic miscibility of the PETG and the PTMO segments, the resulting block copolymers exhibited only one glass transition temperature, which values decrease along with the weight fraction of PTMO segments. On the basis of 1H NMR, SAXS and WAXS, DSC an DMTA results, one can conclude that both phases were thermodynamically miscible and the values of glass transition temperatures decrease along with the content of PTMO flexible segments. The copolymers containing 20 and 30 wt% of flexible segments exhibit elastomeric property characteristics. Moreover, with respect to the flexible segments content, the temperatures corresponding to 5% and 90% weight loss as well as the values of Young's modulus decrease with the increasing flexible PTMO segments content.
Conflicts of interest
There are no conflicts to declare.
Acknowledgements
This work is the result of the research project GEKON2/O5/266860/24/2016 funded by the National Centre for Research and Development and National Fund for Environmental Protection and Water Management, Poland. Diffraction experiments were performed at BL-11-NCD beamline at ALBA Synchrotron with the collaboration of ALBA staff.
Notes and references
- Z. Roslaniec, Polyester thermoplastic elastomers: Synthesis, properties, and some applications, in Handbook of condensation elastomers, ed. S. Fakirov, Wiley-VCH, Weinheim, 2005, ch. 3, p. 77 Search PubMed.
- D. W. Van Krevelen and K. Te Nijenhuis, Properties of Polymers, Elsevier B. V., Amsterdam, 2009 Search PubMed.
- J. Scheirs and T. Long, Modern polyesters, chemistry and technology of polyesters and copolyesters, Wiley-VCH, Chichester, 2003 Search PubMed.
- R. Saint-Loup, J.-J. Robin and B. Boutevin, Macromol. Chem. Phys., 2003, 204, 970 CrossRef CAS.
- J. V. Kurian, J. Polym. Environ., 2005, 13, 160 CrossRef.
- A. Szymczyk, E. Senderek, J. Nastalczyk and Z. Roslaniec, Eur. Polym. J., 2008, 44, 436 CrossRef CAS.
- G. Li, J. Jiang, J. Jin, S. Yang and C. Wu, J. Macromol. Sci., Part B: Phys., 2006, 45, 639 CrossRef CAS.
- M. C. E. J. Niesten, J. Feijen and R. J. Gaymans, Polymer, 2000, 41, 8487 CrossRef CAS.
- X. Guo, J. Xin, X. Lu, B. Ren and S. Zhang, RSC Adv., 2015, 5, 485 RSC.
- D. Hou, J. Xin, X. Lu, X. Guo, H. Dong, B. Ren and S. Zhang, RSC Adv., 2016, 6, 48737 RSC.
- H.-J. Bang, H.-Y. Kim, F.-L. Jin and S.-J. Park, J. Ind. Eng. Chem., 2011, 17, 805 CrossRef CAS.
- A. Ranade, N. D'Souza, C. Thellen and J. A. Ratto, Polym. Int., 2005, 54, 875 CrossRef CAS.
- K. Shih and W. Shrinkage, Modeling of Polyester Shrink Film, Polym. Eng. Sci., 1994, 34, 1121 Search PubMed.
- T. Chen and J. Zhang, Appl. Surf. Sci., 2016, 388, 133 CrossRef CAS.
- C.-L. Liu, W.-T. Sun, W. Liao, W.-X. Lu, Q.-W. Li, Y. Jeong, J. Liu and Z.-H. Zhao, Int. J. Oral Sci., 2016, 8, 246 CrossRef CAS PubMed.
- Y. M. Heo, J. M. Koo, D. K. Hwang, J. G. JaeGal, S. Y. Hwang and S. S. Im, RSC Adv., 2016, 6, 57626 RSC.
- L. Piergiovanni and S. Limbo, Food Packaging Materials, Springer International Publishing, Berlin, 2016, p. 33 Search PubMed.
- S. T. C. Lin, D. S. Musson, S. Amirapu, J. Cornish and D. Bhattacharyya, J. Biomed. Mater. Res., Part A, 2017, 105, 1393 CrossRef CAS PubMed.
- T. Chen, J. Zhang and H. Youa, RSC Adv., 2016, 6, 102778 RSC.
- A. E. Scripa, D. G. Dimitriu and D. O. Dorohoi, J. Mol. Struct., 2017, 1140, 67 CrossRef CAS.
- J. Hu, W. Chen, B. Zhao and D. Yang, Constr. Build. Mater., 2017, 131, 411 CrossRef CAS.
- A. Kuzminovaa, M. Vandrovcováb, A. Shelemina, O. Kyliána, A. Choukourova, J. Hanuša, L. Bačákováb, D. Slavínskáa and H. Biederman, Appl. Surf. Sci., 2015, 357, 689 CrossRef.
- R. Schwödiauer, S. Bauer-Gogonea, S. Bauer, J. Heitz, E. Arenholz and D. Bäuerle, Appl. Phys. Lett., 1998, 73, 2941 CrossRef.
- J. Hu, Y. Li, C. Li, W. Chen and D. Yang, Polym. Test., 2017, 59, 362 CrossRef CAS.
- N. Benipal, J. Qi, J. C. Gentile and W. Li, Renewable Energy, 2017, 105, 647 CrossRef.
- C. Galliot and R. H. Luchsinger, Polym. Test., 2011, 30, 356 CrossRef CAS.
- L. Charbonneau, M. A. Pola and A. Penlidis, Constr. Build. Mater., 2014, 60, 63 CrossRef.
- H. Matsukizono and T. Endo, J. Polym. Sci., Part A: Polym. Chem., 2016, 54, 487 CrossRef CAS.
- A. Kuzminova, A. Shelemin, O. Kylian, A. Choukourov, H. Valentoa, I. Krakovský, J. Nedbal, D. Slavínsk_a and H. Biederman, Polym. Degrad. Stab., 2014, 110, 378 CrossRef CAS.
- W. Li, Y. Zhai, P. Yi and Y. G. Zhang, Microelectron. Eng., 2016, 164, 100 CrossRef CAS.
- T. Chen, W. Zhang and J. Zhang, Polym. Degrad. Stab., 2015, 120, 232 CrossRef CAS.
- K. Lee, J. Lee, B. A. Mazor and S. R. Forrest, Light: Sci. Appl., 2015, 4, 288 CrossRef.
- B. Li, X. Zhang, Q. Zhang, F. Chen and Q. Fu, J. Appl. Polym. Sci., 2009, 113, 1207 CrossRef CAS.
- D. Chen, L. Gao, X. Li and Y. Tu, Chin. J. Polym. Sci., 2017, 35, 681 CrossRef CAS.
- Q. Xu, J. Chen, W. Huang, T. Qu, X. Li, Y. Li, X. Yang and Y. Tu, Macromolecules, 2013, 46, 7274 CrossRef CAS.
- J. Chen, D. Chen, W. Huang, X. Yang, X. Li, Y. Tu and X. Zhu, Polymer, 2016, 107, 29 CrossRef CAS.
- K. C. Cole, J. Guèvremont, A. Ajji and M. M. Dumoulin, Appl. Spectrosc., 1994, 48, 1513 CrossRef CAS.
- R. H. Guo, S. Q. Jiang, C. W. M. Yuen and M. C. F. Ng, J. Mater. Sci.: Mater. Electron., 2009, 20, 735 CrossRef CAS.
- O. Prasad, L. Sinha, N. Misra, V. Narayan, N. Kumar and J. Pathak, J. Mol. Struct.: THEOCHEM, 2010, 940, 82 CrossRef CAS.
- T. Chen, G. Jiang, G. Li, Z. Wu and J. Zhang, RSC Adv., 2015, 5, 60570 RSC.
- A. Szymczyk, Eur. Polym. J., 2009, 45, 2653 CrossRef CAS.
- S. Paszkiewicz, A. Szymczyk, Z. Spitalsky, J. Mosnacek, E. Janus and Z. Roslaniec, Polimery, 2013, 58, 893 CrossRef CAS.
- D. Pont, Terathane 1000 polyether glycol, Certificate of analysis, 2000 Search PubMed.
- S. Fakirov, A. A. Apostolov, P. Boeseke and H. G. Zachman, J. Macromol. Sci., Part B: Phys., 1990, 29, 379 CrossRef.
- H. H. Chuah, Amorphous and Crystalline Polyesters based on 1,4-Cyclohexanedimethanol, in Modern polyester: chemistry and technology of polyesters and copolyesters, ed. J. Scheirs and T. E. Long, Wiley, Chichester, 2004, ch. 7, pp. 267–292 Search PubMed.
- W. Brostow, H. E. Hagg Lobland and M. Narkis, J. Mater. Res., 2006, 21, 2422 CrossRef CAS.
- W. Brostow, H. E. Hagg Lobland and S. Khoja, Mater. Lett., 2015, 159, 478 CrossRef CAS.
- A. Dorigato, A. Pegoretti, L. Fambri, C. Lonardi, M. Slouf and J. Kolarik, eXPRESS Polym. Lett., 2011, 5, 23 CrossRef CAS.
- J. Che, M. Wang, J. Li, S. Guo, S. Xu, Y. Zhang, T. Li and M. Wen, Eur. Polym. J., 2009, 45, 3269 CrossRef.
- A. Szymczyk and Z. Rosłaniec, Polimery, 2006, 51, 627 CAS.
Footnote |
| † Electronic supplementary information (ESI) available. See DOI: 10.1039/c7ra07172h |
|
| This journal is © The Royal Society of Chemistry 2017 |
Click here to see how this site uses Cookies. View our privacy policy here. 
 Open Access Article
 This Open Access Article is licensed under a
  *a,
Anna Szymczykb,
Daria Pawlikowskaa,
Izabela Irskaa,
Iman Taraghiac,
Ryszard Pilawkade,
Jiali Guf,
Xiaohong Lif,
Yingfeng Tu
*a,
Anna Szymczykb,
Daria Pawlikowskaa,
Izabela Irskaa,
Iman Taraghiac,
Ryszard Pilawkade,
Jiali Guf,
Xiaohong Lif,
Yingfeng Tu