 Open Access Article
Creative Commons Attribution 3.0 Unported Licence
Characterization of waste printed circuit boards recycled using a dissolution approach and ultrasonic treatment at low temperatures
Maksym Tatariants *a,
Samy Yousefbc,
Ruta Sidaraviciutea,
Gintaras Denafasa and
Regita Bendikieneb
aDepartment of Environmental Technology, Faculty of Chemical Technology, Kaunas University of Technology, Radvilėnų pl. 19, LT-50254 Kaunas, Lithuania. E-mail: maksym.tatariants@ktu.edu
bDepartment of Production Engineering, Faculty of Mechanical Engineering and Design, Kaunas University of Technology, Studentu str. 56, LT-51424 Kaunas, Lithuania
cDepartment of Production Engineering and Printing Technology, Akhbar Elyom Academy 6th of October, Egypt
First published on 31st July 2017
Abstract
Recently, the separation of waste printed circuit boards (WPCBs) using organic solvents has become more prevalent because it is an environmentally friendly and efficient technique. However, the relatively high temperatures (∼135 °C) used during the separation process lead to higher energy consumption, faster solvent degradation, and possibly higher emissions of toxic fumes. This work aims to develop a new approach to separate all layers of WPCBs at lower temperatures to avoid the above-mentioned drawbacks. Di-methyl formamide (DMF) was used in the present technique as an organic solvent, while ultrasonic treatment was applied in order to accelerate the breakage of the internal van der Waals bonds of brominated epoxy resin (BER), thus decreasing the separation time. The experiments were conducted on five WPCB samples with the same surface area of 100 mm2, cut from five different WPCB models. The experiments were carried out at 25 °C (used as a reference), 50 °C, and 75 °C to study the effect of heating rate on the separation time and on the concentration of the BER dissolved in DMF. Ultraviolet-visible spectroscopy, metallographic microscope, and SEM-EDS were used to examine the recovered BER and fiberglass structure as well as the main metal compositions of each sample, respectively. The results showed that separation time and concentration of BER strongly depended on the WPCB models. In addition, the dissolution process at 50 °C resulted in the concentration of BER close to 25 °C for most of the models, while the concentration was lowest at 75 °C. At the same time, the trend in separation time was exactly opposite, with 75 °C resulting in the fastest separation time and 25 °C in the slowest. This facile approach appears promising for its potential applications in WPCB recycling and could be applied on an industrial scale.
1. Introduction
In the last ten years, the recycling of waste printed circuit boards (WPCBs) has increasingly been taken seriously for two main reasons. The first is that WPCBs contain a considerable amount of metallic and non-metallic components such as copper (Cu), iron (Fe), tin (Sn), nickel (Ni), lead (Pb), zinc (Zn), silver (Ag), gold (Au), palladium (Pd), and fiberglass encapsulated in resins; WPCBs could be used as a source of valuable raw materials for recycling even though their mass share in the overall electronic waste stream is only ∼6%. The second reason is that the environment needs protection from the harmful substances contained inside WPCBs; these substances can be released as a result of landfilling the abovementioned waste or treating it with traditional methods such as incineration, which generates some toxic gases and carbon dioxide emissions. The global generation of e-waste around the world is assessed to be significant, being 65.4 million tons in 2017, an increase from 20 million in 2000. This drastic increase in the generation of waste electrical and electronic equipment (WEEE) is a result of the integration of electronic devices into almost every sphere of human life and the appearance of completely new electronic products with high popularity, especially computers and mobile phones. Altogether, this leads to the accumulation of high amounts of WEEE.1–6 Therefore, a number of methods have been developed and applied for treatment of WPCBs; these include mechanical separation, biological recycling, crushing, hydrometallurgical and pyrometallurgical treatment, pulverization, plasma treatment, etc.7–13 However, many of these methods have certain restrictions related to energy consumption, process efficiency, recovery yield or recycling rate, economic profitability, pollution rate, and a limited focus on metals or non-metals recovery only.14–18 These problems emerged as a result of the complexity of WPCB structure, which is comprised of fiberglass reinforced with resin and metal parts having a high hardness and tenacity.11,19An organic solvent treatment method was recently employed as a new environmentally friendly recycling technique with a significant reduction in the emission of toxic gases and high efficiency for WPCB separation.20 Summarizing the new technique, its main principle lies in the dissolution of brominated epoxy resin (BER) by using different solvents to break the internal van der Waals bonds between BER and other components of WPCB; hence, BER is gradually dissolved in the solvent, and delamination of the WPCBs followed by a complete separation occurs.21 N-Methyl-2-pyrrolidone (NMP), dimethyl sulfoxide (DMSO), and dimethyl formamide (DMF) are common solvents used in this separation approach due to their high boiling point, relatively high viscosity, and high thermal stability with an effective ability to dissolve numerous organic and inorganic chemicals without corroding metals.22–24 However, the physical and chemical properties of NMP and DMSO were discouraging in view of commercial viability as well as in terms of public health, since DMSO is classified as a highly hygroscopic solvent with high specific heat, high viscosity, and an ability to penetrate human skin; furthermore, its vapors are heavier than air.
Dimethyl formamide (DMF) is an aprotic solvent, colorless, and relatively cheaper when compared with DMSO and NMP. Also, DMF is more stable up to its boiling point of 153 °C, with low evaporation rates. This motivated Verma et al. (2016) to replace DMSO and NMP with (DMF) to achieve the dissolution of BER in WPCBs and separation of its components. They investigated the effect of various parameters on the optimum dissolution time and the concentration of BER in DMF.25 The results showed that the technique was most effective with the following parameters: WPCB sample size of 1 cm × 1 cm, separation time of 4 hours, and temperature at 135 °C. Although the reported results of the technique were promising, it still required relatively high energy consumption (135 °C), which is difficult to apply on an industrial scale. Also, it was noted that most of the WPCB recycling techniques were focused on the development of the approach and applied only on one type of WPCB model, despite each model having a different configuration, e.g., different numbers and structures of woven fiberglass layers, the presence or absence of filler materials inside the substrate, different soldermask types, size and shape of conductive tracks, etc.26 Thereby, this work aims to develop an environmentally friendly and economically feasible approach for the recycling of WPCBs that is applicable on the industrial scale for all WPCB models, using DMF and ultrasonication treatment at low temperatures.
2. Experimental
2.1. Materials and sample preparation
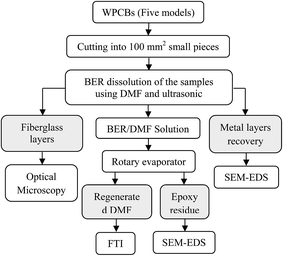
Analytical grade reagents used in the present investigation include dimethyl formamide and pure ethanol (Sigma-12 Aldrich Corp.). Five different WPCB models were collected from a local shop in Lithuania, and it was determined that all WPCBs had been taken from discarded desktop computers (produced between 1998 and 2004), with each model having a distinctive color as illustrated in Table 1. In order to prepare the boards for separation, all electronic components integrated with the WPCB substrate, such as resistors, integrated circuits, capacitors, relays, transformers, and slots, etc. were removed by using appropriate mechanical tools (such as a chisel), and then the substrate was cleaned with compressed air. After this step, three samples with a surface area of 100 mm2 (about 14 grams) were cut from each WPCB model using hand cutter (size was chosen according to the optimum results reported by Verma et al. (2016)).24 It is worth mentioning that during the cutting of samples from each WPCB, an effort was made to avoid the places with drilling holes, notches, and solder joints to be sure that all the samples have a similar structure as shown in Fig. 1. Then, the WPCB samples were washed and rinsed with distilled water and acetone to remove any dust, grease, chemicals, adhesive, smudges, etc. and subsequently dried for 24 h at room temperature. Finally, each prepared sample was given a code according to WPCB color and separation temperature, as illustrated in Table 1. Fig. 2 shows the procedures which were followed to separate all components of the WPCB by using the new technique.| Type | WPCB model specifications | WPCB color | Separation temperature | Sample code |
|---|---|---|---|---|
| 1 | Compaq DeskPro EN Socket 370 AGP Motherboard 187498-001 010630-101 | Green “G” | 25 | G/25 |
| 50 | G/50 | |||
| 75 | G/75 | |||
| 2 | Gigabyte GA-8IG1000-G | Blue “B” | 25 | B/25 |
| 50 | B/50 | |||
| 75 | B/75 | |||
| 3 | 845GV-MLV | Yellow “Y” | 25 | Y/25 |
| 50 | Y/50 | |||
| 75 | Y/75 | |||
| 4 | MSI PT880 Neo (V2.0) MS-7043 (v1.00) ATX Mainboard | Red “R” | 25 | R/25 |
| 50 | R/50 | |||
| 75 | R/75 | |||
| 5 | Soltek SL-75DRV5 | Violet “V” | 25 | V/25 |
| 50 | V/50 | |||
| 75 | V/75 |
2.2. Separation procedure
Ning et al. (2017) suggested that the future research direction of WPCB recycling should focus on a combination of several techniques or in-series recycling to maximize the benefits of the process.27 In order to achieve this goal, chemical treatment (organic solvent) and ultrasonic treatment were used together in the present research as a combination of several recycling techniques. At the beginning, each WPCB sample was placed in an individual flask containing DMF with a solid-to-liquid ratio (WPCB![[thin space (1/6-em)]](https://www.rsc.org/images/entities/char_2009.gif) :
:![[thin space (1/6-em)]](https://www.rsc.org/images/entities/char_2009.gif) DMF ratio) of 300 g L−1. Then, the flasks (containing DMF and WPCB samples) were submerged in a sonication bath filled with a vibrating fluid (distilled water). Each sample was separated at different temperature values: 25, 50 and 75 °C. At the end of the sonication process, two main types of material were received: fiberglass and conductive metals. In addition, BER dissolved in DMF was obtained; then, a rotary decompression evaporator was used to extract BER and regenerate the used DMF. Finally, B/25, G/25, R/25, V/25, and Y/25 samples were prepared to be used as reference samples for comparison with the separated samples at the end of the process.
DMF ratio) of 300 g L−1. Then, the flasks (containing DMF and WPCB samples) were submerged in a sonication bath filled with a vibrating fluid (distilled water). Each sample was separated at different temperature values: 25, 50 and 75 °C. At the end of the sonication process, two main types of material were received: fiberglass and conductive metals. In addition, BER dissolved in DMF was obtained; then, a rotary decompression evaporator was used to extract BER and regenerate the used DMF. Finally, B/25, G/25, R/25, V/25, and Y/25 samples were prepared to be used as reference samples for comparison with the separated samples at the end of the process.
3. Recovered material characterizations
Metallographic microscope (model Orchid MCX300) was used to examine the separation of solder and copper tracks against fiberglass as well as recovered fiberglass structure. The concentration of BER dissolved in DMF for each WPCB sample was measured by using ultraviolet-visible spectroscopy (UV-VIS: model GENESYS 8). Fourier transform infrared spectroscopy (FTIR, Vertex70 spectrometer) was used to analyze and identify the chemical compounds of the regenerated DMF for each sample. Additionally, scanning electron microscope (SEM: model BPI-T) and energy-dispersive X-ray spectroscopy (EDS) was used to investigate the chemical composition of the recovered metal layers (at cross section).4. Results and discussion
4.1. Structure analysis of WPCB samples
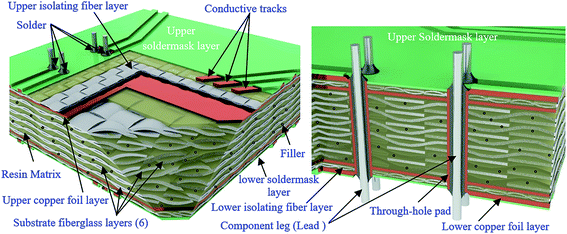
After the complete dissolution and separation of the BER from each WPCB sample using DMF and ultrasonic treatment, it was noted that all the samples had the same structure, which consisted of six layers of fiberglass (representing WPCB substrate), two copper foil layers (upper and lower layers), two fine-woven fiberglass layers (upper and lower isolating layers), copper tracks, and two soldermask layers (upper and lower layers). All the layers of WPCBs and tracks were glued together by BER, as shown in Fig. 3. In addition, the boards contained a certain amount of through-hole pads and leg components for mounting electronic components. It is worth mentioning that the amount and distribution of the through-hole pads and leg components in each sample depended on the WPCB model and the location on the WPCB from where the prepared sample was taken. Also, it was noted that the separation of substrate fiberglass layers was much easier than the separation of isolating fiberglass layers, where the isolating fiberglass layers, conductive tracks, and soldermask were separated as one unit (compound unit). Therefore, the compound unit of each sample was placed again in the sonication bath until complete separation was achieved.Fig. 4 shows all the recovered layers of the WPCB samples at the end of the separation process, including the separation of the compound unit. It is worth mentioning that this photo was taken directly after the complete separation of substrate for the first sample for all WPCB samples of the same color type. As shown in the figure, all substrate fiberglass layers (C) and copper foil layers (B and D) of all samples were separated. Meanwhile, there was a significant difference in the separation rate of upper and lower compound units (A and E), which varied from fully separated to completely unseparated. For example, compound units of the yellow sample were completely separated, while the red sample remained aggregated. Regarding the compound units of the blue, violet, and green samples, their separation was in an intermediate stage. This separation difference might be a result of the different designs of the samples; particularly, the spatial distribution of solder, copper tracks, and isolating fiberglass (for the compound unit) can create an obstacle for penetration of DMF inside the WPCB structure, thus increasing the separation time. The chemical composition of adhesive material (BER) in each sample can also play a crucial role in the separation process. Therefore, all these obstacles and their effects on the separation time are explained in detail in the following sections.
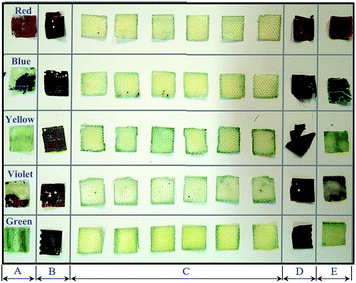 | ||
| Fig. 4 Recovered layers from each WPCB sample. (A, E) Compound unit; (B, D) copper foil; and (C) substrate fiberglass layers. | ||
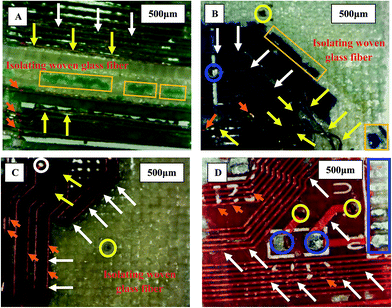
Fig. 5 shows the separation mechanism for components of compound units of red, blue, violet, and green WPCB samples. It is clear that conductive tracks were located in between the soldermask layer and isolating fiberglass layer, and the separation process started with the removal of the soldermask layer (orange rectangles), followed by exposure of the tracks (orange arrows) and their subsequent separation (yellow arrows). After this, the isolating fiberglass layer and contact area between isolating fiberglass were exposed to solvent, and DMF was increased, thus starting delamination followed by a complete separation. Also, it was noted that each sample had different conductive tracks (white arrows) in terms of total amount, size, and shape, as well as the amount of attached solder (blue circles). Also, it was noted that the through-hole pads remained fitted inside the drilling holes in the fiberglass sheets (yellow circles). Fig. 6 shows the distribution and amount of through-hole pads in WPCB samples. As shown in the figure, the pads were distributed randomly, and their amounts varied depending on the sample type. Also, some BER still impregnated the separated fiberglass layers, especially at the middle where DMF was not able to permeate inside the matrix and dissolve the BER. In addition, there was more resin on the surface of the fiberglass around the through-hole pads, which might have affected the final separation time, and the chemical composition of the adhesive material (BER) in each sample could also play a crucial role in the separation process. All these hindering factors and their effect on the separation time are explained in detail in the following sections.
4.2. Separation time of WPCB samples
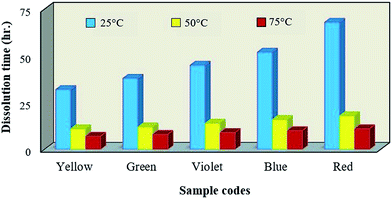
Fig. 7 shows the effect of WPCB models on the final dissolution time. It can be seen that at the lowest temperature of 25 °C (without heating, only ultrasonic treatment), yellow, green, and violet samples had the shortest separation time, while blue and red samples had the longest. Also, it was noted that the difference between minimum and maximum dissolution time was ∼53% (32 to 68 h) since the quantity of BER in the WPCBs was not the same, nor its spatial configuration and distribution. With increasing the heating rate to 50 °C, significant acceleration was noted for the separation process of all the WPCB samples, and the same trend was present as at 25 °C; i.e., separation time for sample types was yellow < green < violet < blue < red. The difference in the separation time between the samples was ∼66, 68, 69, 73, and 74% respectively. This may be associated to strong hydrogen bond formation affinity of DMF, leading to breakage of internal van der Waals bonds of BER and acceleration of this phenomenon with increasing temperature.28As proof of the above, with further increase of the heating rate to 75 °C, the separation time decreased again, and the trend in separation time of yellow < green < violet < blue < red was observed once more. Also, the elevated temperature, enhanced by vibrations, led to the formation of hydrogen bonding between BER and DMF, and thus the dissolution of BER, improving the efficiency of delamination and separation of WPCB samples. This was the main reason to use ultrasonication process in the present study.29 According to acquired results, the separation of WPCBs using solvent has three main steps: penetration of DMF inside the layers, dissolution of BER between the layers, and delamination of the layers themselves. Contact areas between DMF and WPCB layers can be considered as starting points of the separation process, and their increase leads to acceleration of the separation. The sizes of the contact areas are affected by soldermask layer, copper tracks and solder, which hinder progress of DMF penetration inside the matrix. However, separation time does not count as conclusive evidence for whether each element inside the matrix is fully separated or not for the particular BER type.
4.3. BER analysis of WPCB samples
![[thin space (1/6-em)]](https://www.rsc.org/images/entities/char_2009.gif) :
:![[thin space (1/6-em)]](https://www.rsc.org/images/entities/char_2009.gif) 3 at 25 °C. As shown in the figure, the absorbance peak was greater than 0.85, while the standard curve is valid only up to this value. Therefore, the BER/DMF solution was diluted again with final ratio of 1
3 at 25 °C. As shown in the figure, the absorbance peak was greater than 0.85, while the standard curve is valid only up to this value. Therefore, the BER/DMF solution was diluted again with final ratio of 1![[thin space (1/6-em)]](https://www.rsc.org/images/entities/char_2009.gif) :
:![[thin space (1/6-em)]](https://www.rsc.org/images/entities/char_2009.gif) 8 to obtain absorbance lower than 0.85, as shown in Fig. 9B. Fig. 9C and D shows the effect of WPCB sample type on BER/DMF absorbance at 50 and 75 °C, respectively. It is clear that all models had the same peak at 282 nm wavelength, while absorbency data varied depending on the model type and temperature.
8 to obtain absorbance lower than 0.85, as shown in Fig. 9B. Fig. 9C and D shows the effect of WPCB sample type on BER/DMF absorbance at 50 and 75 °C, respectively. It is clear that all models had the same peak at 282 nm wavelength, while absorbency data varied depending on the model type and temperature.
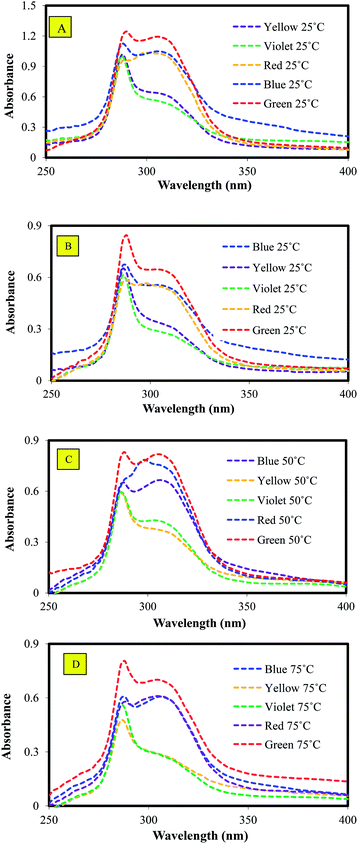 | ||
Fig. 9 Absorbance of BER/DMF samples at (A) 25 °C, 1![[thin space (1/6-em)]](https://www.rsc.org/images/entities/char_2009.gif) : :![[thin space (1/6-em)]](https://www.rsc.org/images/entities/char_2009.gif) 3 dilution; (B) 25 °C, 1 3 dilution; (B) 25 °C, 1![[thin space (1/6-em)]](https://www.rsc.org/images/entities/char_2009.gif) : :![[thin space (1/6-em)]](https://www.rsc.org/images/entities/char_2009.gif) 8 dilution; (C) 50 °C, 1 8 dilution; (C) 50 °C, 1![[thin space (1/6-em)]](https://www.rsc.org/images/entities/char_2009.gif) : :![[thin space (1/6-em)]](https://www.rsc.org/images/entities/char_2009.gif) 8 dilution; and (D) 75 °C, 1 8 dilution; and (D) 75 °C, 1![[thin space (1/6-em)]](https://www.rsc.org/images/entities/char_2009.gif) : :![[thin space (1/6-em)]](https://www.rsc.org/images/entities/char_2009.gif) 8 dilution. 8 dilution. | ||
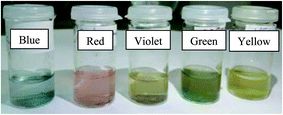
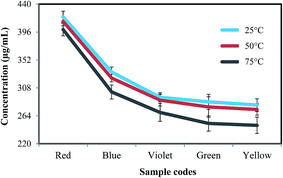
Fig. 10 shows the final concentrations of BER in DMF of the 25, 50, and 75 °C samples. As shown in the figure, at all temperatures, red, blue, and violet had the highest concentrations of BER, while green and yellow samples had the lowest concentrations, respectively. Also, it can be seen that the concentrations of BER were directly proportional to separation time; for instance, the red sample (the longest separation time as shown in Fig. 7) had the highest concentration of BER, while the yellow sample, with the shortest separation time, had the lowest BER concentration. The main reason for this was that with longer separation time, DMF had more time to penetrate inside the WPCBs layers and break internal van der Waals bonds of BER, as shown in Fig. 11. Moreover, in the case of long separation time, DMF (indicated by green circles) can additionally dissolve BER particles directly adhered to the lower or upper layers of fiberglass (indicated by blue circle), while the short separation time only allows DMF to split the layers by dissolving BER in the middle of the layers (indicated by yellow circles), leaving more BER adhered to the fiberglass.30
Regarding the influence of temperature, it is clear that the concentration of BER in DMF in all samples had the same trend, where 25 °C provided the highest, 50 °C provided medium, and 75 °C provided the lowest concentration. These results came in contrast to that expected for the reason that at lower temperatures, DMF does not have the ability to break the bonds of BER quickly and needs another source to accelerate the dissolution process. Accordingly, ultrasonic treatment was used in the developed technique as a dissolution enhancer to accelerate the dissolution process by generating high-frequency sound waves (by means of vibration transducers) with frequencies higher than the upper bonding limit of BER. The summary effect of these waves increases by increasing the operation time (separation time in our case), which leads to increase in the shear rate of BER, thus raising the final concentration of BER in DMF solution.31–33 Therefore, the samples subjected to ultrasound treatment for a longer time due to longer separation had higher concentrations of BER also because of the ultrasound treatment.
Finally, given the points that BER is a base element in WPCBs and the concentrations of BER at 25 °C and 50 °C were almost the same and significantly lower at 75 °C, it can be concluded that 50 °C was an optimum separation temperature in terms of time and BER removal rate, since quickly separated layers of WPCBs at 75 °C still contained a considerable amount of adhered BER, while slower separation at 50 °C produced purer fiberglass while requiring less energy for heating. Therefore, in the following section, all analyses and characterizations are focused on materials obtained from treatment at 50 °C as optimum conditions for all WPCB types.
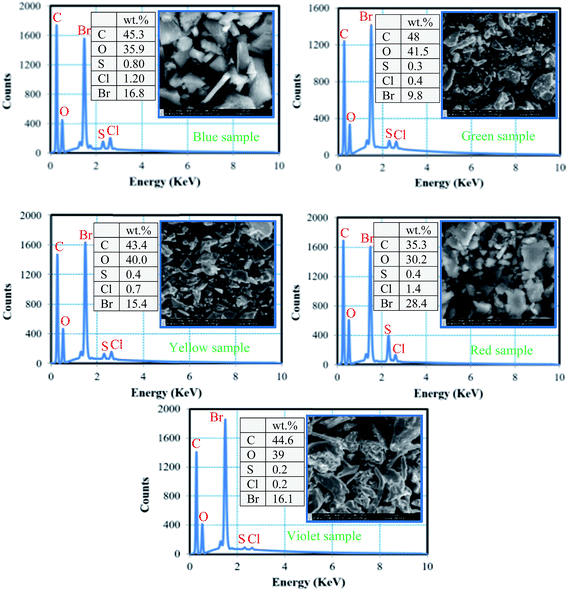
4.3.2.1. SEM-EDS analysis of recovered epoxy resin. Fig. 12 shows the results of SEM-EDS analysis of epoxy resin of WPCB samples after recovery by rotary evaporator. As shown in the figure, SEM images show slightly different surface morphology for all the samples, which may be a result of different solidification conditions or chemical compositions of BER. EDS analysis revealed that the residue of each WPCB sample contains carbon (C), oxygen (O), and bromine (Br). In addition, insignificant amounts of sulfur (S) and chlorine (Cl) were found, which might be a consequence of soldermask impurities. The composition of samples gives strong evidence that the dissolved epoxy resin was successfully extracted by evaporation.23 However, the quantitative composition indicates that there is a significant change in the weight percentage of each element in each sample; e.g. Br amount changed from 9.8 to 28%. Therefore, it can be assumed that the separation time might have been strongly dependent on the chemical composition of BER, especially since the H atom of the methyl group of DMF may participate in H-bonding with Br and O on the parent aromatic chain of BER, thus leading to dissolution of BER by DMF.
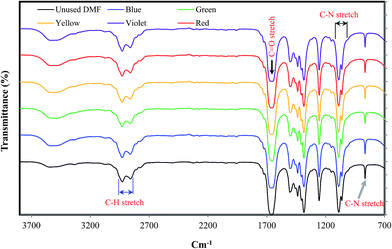
4.3.2.2. FTIR analysis of regenerated DMF. Fig. 13 shows the FTIR spectra analysis of unused and regenerated DMF from WPCB samples. As shown in the figure, the characteristic vibrations for the chemical groups in DMF are as follows: at 3000–2850 cm−1, due to the C–H stretch group; the vibrations of C–N stretch groups at 1250–1020 and 657 cm−1; and the strong band at 1670 cm−1 is the C
![[double bond, length as m-dash]](https://www.rsc.org/images/entities/char_e001.gif) O stretch.34 Also, the FT-IR spectra of the samples of regenerated DMF have the same characteristic vibrations and bands as the sample of unused DMF. Accordingly, regeneration of used DMF is highly recommended due to its significant economic and environmental benefits.
O stretch.34 Also, the FT-IR spectra of the samples of regenerated DMF have the same characteristic vibrations and bands as the sample of unused DMF. Accordingly, regeneration of used DMF is highly recommended due to its significant economic and environmental benefits.
4.4. Morphology of recovered woven fiberglass
Fiberglass is used in printed circuit boards (PCBs) as an electrical insulator element, especially in FR-4 epoxy resin-woven fiberglass laminates, due to its good strength-to-weight ratio, zero water absorption, and high thermal resistance. However, there is a difference between the fiberglass used in different PCB laminates such as G-10, G-11, FR-5 and FR-6.35 The main variation in each type is in the mesh size and fiber orientation.36 Besides that, there are currently some additives used to improve the fiberglass properties that might affect the separation time. Fig. 14 shows the morphology of substrate fiberglass and isolating fiberglass layers of green, blue, violet, red, and yellow samples, with 500 μm scale. As shown in the figure, all the fiberglass layers (substrate and isolating) had plain woven fiberglass structure, but with different fiberglass bundle sizes in the weft “X” and warp “Y” directions. Also, it was observed that the fiberglass remained encapsulated in epoxy resin with bundles attached to each other by the bonding action of resin.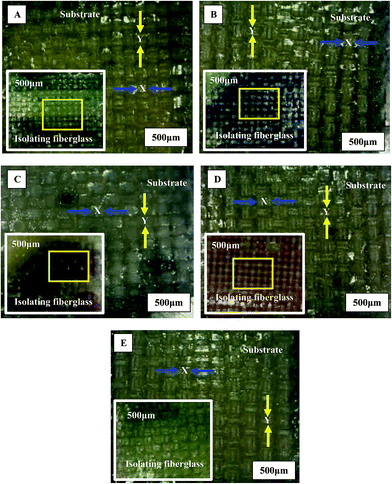 | ||
| Fig. 14 Metallographic photographs of recovered fiberglass layers of (A) green, (B) blue, (C) violet, (D) red, and (E) yellow samples. | ||
4.5. Chemical composition of the recovered metal layers
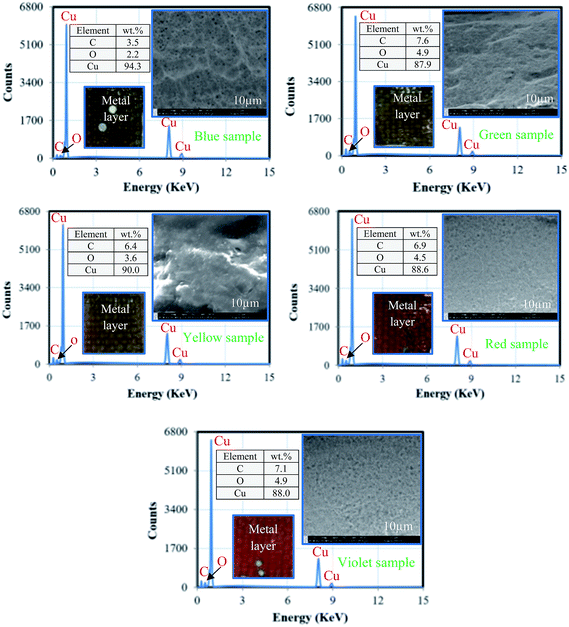
Fig. 15 shows the SEM-EDS analysis of the metal samples recovered from WPCBs, with the analysis made at the cross-section of each sample. As shown in the figure, the fracture surface of all samples has similar features (dull and fibrous surface). Also, chemical analysis shows that Cu has a strong presence in all the samples, with different percentages (88 to 94.2%) since it is a main metal for manufacturing of electrical conductive components of PCB.37 In addition, small amounts of carbon (3.5 to 7.6 wt%) and oxygen (2.2 to 4.9 wt%) were found in all recovered metal samples. These results give strong evidence that Cu is a main metallic element in all the WPCB samples, and there is a slight variation in chemical composition and proportions of each WPCB sample.5. Recovered metal, non-metal, and regenerated DMF mass balances
Table 2 shows the recycling rate for metals and non-metals (fiberglass and epoxy resin) recovered from the WPCB sample as well as regenerated DMF. As illustrated, the recycling rate was relatively high, being, for all the WPCBs, in the range of 97.5–99%, while for DMF these values were 97–98%. There were some variations noticed in the weight of recovered metal—the amount varied from 0.164 to 0.288 g (∼43% variation); the same deviation could be seen in the weight of non-metals (fiberglass and epoxy resin) 0.42–0.51 g (∼17% variation). This means that the recycling output and benefit can be highly dependent on the WPCB model.| Sample code | Initial weight (g) | Mass balance of recovered metal (g) | Mass balance of recovered fiberglass and epoxy resin (g) | Regenerated DMF (g) | Recycling rate (%) | ||||
|---|---|---|---|---|---|---|---|---|---|
| WPCB | DMF | Substrate fiber layers (6) | Isolating fiber layers (2) | Epoxy | WPCB | DMF | |||
| Blue | 0.667 | 1.888944 | 0.1644 | 0.22548 | 0.0372 | 0.2233 | 1.851 | 97.5 | 98 |
| Green | 0.635 | 1.79832 | 0.2064 | 0.2364 | 0.0358 | 0.1437 | 1.762 | 98 | 98 |
| Yellow | 0.685 | 1.93992 | 0.288 | 0.2238 | 0.0394 | 0.1269 | 1.882 | 99 | 97 |
| Red | 0.692 | 1.959744 | 0.177 | 0.2376 | 0.0376 | 0.2328 | 1.90 | 99 | 97 |
| Violet | 0.673 | 1.905936 | 0.2196 | 0.22188 | 0.0368 | 0.1813 | 1.868 | 98 | 98 |
6. Conclusion
In the present work, layers and elements (copper foils, fiberglass layers, and BER) of five samples taken from different WPCB models were recovered by using an organic solvent (DMF) and ultrasonication process performed at low temperatures in order to decrease the emission of toxic gases and power consumption during the separation process. Also, the structure and chemical composition of the recovered layers and elements from the samples were investigated, and their influence on the final separation time was studied. The experimental results highlighted the following:(a) All the WPCB samples had similar structure, which comprises six layers of fiberglass (representing WPCB substrate), two copper foil layers (upper and lower layers), copper tracks, through-hole pads, and two soldermask layers (upper and lower layers).
(b) Substrate fiberglass layers in all the samples were different from isolating fiberglass, with isolating layers having a significantly lower width of fiberglass bundles.
(c) Copper was the main metallic element in all models, but with varying proportions of 86–93 wt%.
(d) Bromine was the main major constituent of epoxy resin polymer in all the WPCB types; it was present in varying percentages of 9–28 wt%. Therefore, different WPCB types contained epoxy resin of different compositions, which may have influenced the separation time.
(e) The current recycling approach can be characterized as more efficient for countries with a hot climate because the developed technique does not require a high heating rate to reach optimum process temperature 50 °C (based on the concentration of BER in organic solvent).
Finally, based on the previously mentioned results, the developed technology seems to be promising in terms of being economical and environment-friendly. Furthermore, it can be applied at the industrial level, since the developed technique does not require a significant amount of facilities; in particular, only sources of sound waves (transducers) and heating (50 °C) are needed, while other recycling techniques often require much higher temperatures and pressures, e.g. supercritical fluid treatment, pyrolysis, and gasification. Also, the recovered metal and non-metals can be used to address the shortage of mineral resources for the electronics industry as well as for composite material applications.
References
- Y. Lu and Z. Xu, Precious metals recovery from waste printed circuit boards: A review for current status and perspective. Resources, Conserv. Recycl., 2016, 113, 28–39 CrossRef.
- J. Guo, J. Guo and Z. Xu, Recycling of non-metallic fractions from waste printed circuit boards: A review, J. Hazard. Mater., 2009, 168, 567–590 CrossRef CAS PubMed.
- K. Huang, J. Guo and Z. Xu, Recycling of waste printed circuit boards: A review of current technologies and treatment status in China, J. Hazard. Mater., 2009, 164, 399–408 CrossRef CAS PubMed.
- S. Guanghan, X. Zhu, Y. Wenyi, Z. Chenglong and M. Wen, Recycling and disposal technology for non-metallic materials from waste printed circuit boards (WPCBs) in China, Procedia Environ. Sci., 2016, 31, 935–940 CrossRef.
- A. Yoshida, A. Terazono, F. C. Ballesteros, D. Q. Nguyen, S. Sukandar, M. Kojima and S. Sakata, E-Waste recycling process in Indonesia, the Philippines, and Vietnam: a case study of cathode ray tube TVs and monitors, Resour., Conserv. Recycl., 2016, 106, 48–58 CrossRef.
- Chapter 2 Electronic Waste: Generation and Management. Electronic Waste, Topics in Mining, Metallurgy and Materials Engineering, ed. H. M. Veit and A. Moura Bernardes, DOI:10.1007/978-3-319-15714-6_2.
- T. Hino, D. Narahara, R. Agawa, Y. Tsugita, M. Nishida and T. Araki, Pulverization of waste printed circuit boards, J. Mater. Cycles Waste Manage., 2003, 5, 137–142 CrossRef.
- C. Duan, X. Wen, C. Shi, Y. Zhao, B. Wen and Y. He, Recovery of metals from waste printed circuit boards by a mechanical method using a water medium, J. Hazard. Mater., 2009, 166, 478–482 CrossRef CAS PubMed.
- W. Jiang, L. Jia and X. Zhen-Ming, A new two-roll electrostatic separator for recycling of metals nonmetals from waste printed circuit board, J. Hazard. Mater., 2009, 161, 257–262 CrossRef PubMed.
- M. Xing and F. S. Zhang, Degradation of brominated epoxy resin and metal recovery from waste printed circuit boards through batch sub/supercritical water treatments, Chem. Eng. J., 2013, 219, 131–136 CrossRef CAS.
- H. L. Le, E. Yamasue, H. Okumura and K. N. Ishihara, Improving sustainable recovery of metals from waste printed circuit boards by the primary copper smelter process, J. Mater. Cycles Waste Manage., 2014, 16, 298–305 CrossRef CAS.
- N. Menad, S. Guignot and J. a. van Houwelingen, New characterisation method of electrical and electronic equipment wastes (WEEE), Waste Manage., 2013, 33, 706–713 CrossRef CAS PubMed.
- S. Ilyas, J. Lee and B. Kim, Bioremoval of heavy metals from recycling industry electronic waste by a consortium of moderate thermophiles: process development and optimization, J. Cleaner Prod., 2014, 70, 194–202 CrossRef CAS.
- H. Brandl, S. Lehmann and M. A. Faramarzi, Microbe-metal interactions for the biotechnological treatment of metal-containing solid waste, China Particuol., 2006, 4(2), 93–97 CrossRef CAS.
- J. Li, C. Liang and C. Ma, Bioleaching of gold from waste printed circuit boards by Chromobacterium violaceum, J. Mater. Cycles Waste Manage., 2014, 17, 529–539 CrossRef.
- T. G. Townsend, Environmental issues and management strategies for waste electronic and electrical equipment, J. Air Waste Manage. Assoc., 2011, 61, 587–610 CAS.
- S. Syed, Recovery of gold from secondary sources-A review, Hydrometallurgy, 2012, 115–116, 30–51 CrossRef CAS.
- S. Fogarasi, F. Imre-Lucaci, P. Ilea and Á. Imre-Lucaci, The environmental assessment of two new copper recovery processes from Waste Printed Circuit Boards, J. Cleaner Prod., 2013, 54, 264–269 CrossRef CAS.
- P. Zhu, Y. Chen, L. Wang, G. Qian, W. Jie Zhang, M. Zhou and J. Zhou, Dissolution of Brominated Epoxy Resins by Dimethyl Sulfoxide To Separate Waste Printed Circuit Boards, Environ. Sci. Technol., 2013, 47, 2654–2660 CrossRef CAS PubMed.
- Z. Huang, L. Yu, Y. Dai and H. Wang, Hydrogen bonding interactions between N, N-dimethylformamide and cysteine: DFT studies of structures, properties, and topologies, Struct. Chem., 2011, 22, 57–65 CrossRef CAS.
- S. B. Wath, M. N. Katariya, S. K. Singh, G. S. Kanade and A. N. Vaidya, Separation of WPCBs by dissolution of brominated epoxy resins using DMSO and NMP: a comparative study, Chem. Eng. J., 2015, 280, 391–398 CrossRef CAS.
- P. Zhu, Y. Chen, L. Y. Wang, G. Y. Qian, M. Zhou and J. Zhou, A new technology for separation and recovery of materials from waste printed circuit boards by dissolving bromine epoxy resins using ionic liquid, J. Hazard. Mater., 2012, 239–240, 270–278 CrossRef CAS PubMed.
- P. Zhu, Y. Chen, L. Y. Wang, G. R. Qian, M. Zhou and J. Zhou, A novel approach to separation of waste printed circuit boards using dimethyl sulfoxide, Int. J. Environ. Sci. Technol., 2013, 10, 175–180 CrossRef CAS.
- H. R. Verma, K. K. Singh and T. R. Mankhand, Dissolution and separation of brominated epoxy resin of waste printed circuit boards by using di-methyl formamide, J. Cleaner Prod., 2016, 139, 586–596 CrossRef CAS.
- A. V. Longobardo, Chapter 4 Glass Fibers for Printed Circuit Boards, Fiberglass and Glass Technology, ed. F. T. Wallenberger and P. A. Bingham, Springer Science, Business Media, LLC, 2010. DOI:10.1007/978-1-4419-0736-3.
- N. D. Singho, N. A. C. Lah, M. R. Johan and R. Ahmad, FTIR studies on silver-poly(methylmethacrylate) nanocomposites via in situ polymerization technique, Int. J. Electrochem. Sci., 2012, 7, 5596–5603 CAS.
- C. Ning, C. S. K. Lin, D. C. W. Hui and G. McKay, Waste Printed Circuit Board (PCB) Recycling Techniques, Top. Curr. Chem., 2017, 375, 43 CrossRef PubMed.
- E. T. Haugan and P. Dalsjø, Characterization of the Material Properties of Two FR4 Printed Circuit Board Laminates, FFI-rapport 2013/01956, 2014.
- S. B. Wath, M. N. Katariya, S. K. Singh, G. S. Kanade and A. N. Vaidya, Separation of WPCBs by dissolution of brominated epoxy resins using DMSO and NMP: A comparative study, Chem. Eng. J., 2015, 280, 391–398 CrossRef CAS.
- H. R. Verma, K. K. Singh and T. R. Mankhand, Liberation of metal clads of waste printed circuit boards by removal of halogenated epoxy resin substrate using dimethylacetamide, Waste Manage., 2017, 60, 652–659, DOI:10.1016/j.wasman.2016.12.031.
- K. Dean, J. Krstina, W. Tian and R. J. Varley, Effect of Ultrasonic Dispersion Methods on Thermal and Mechanical Properties of Organoclay Epoxy Nanocomposites, Macromol. Mater. Eng., 2007, 292, 415–427, DOI:10.1002/mame.200600435.
- N. Y. Yuhana, S. Ahmad and A. R. Shamsul Bahri, The Effect of Ultrasonic Treatment on Thermal Stability of the Cured Epoxy/Layered Silicate Nanocomposite, Adv. Mater. Sci. Eng., 2012, 5, 789815, DOI:10.1155/2012/789815.
- D.-D. Zhang, D.-L. Zhao, R.-R. Yao and W.-G. Xie, Enhanced mechanical properties of ammonia modified graphene nanosheets/epoxy nanocomposites, RSC Adv., 2015, 5, 28098–28104 RSC.
- R. S. Khandpur, Printed Circuit Boards: Design, Fabrication, Assembly and Testing, Tata McGraw-Hill Education, 2005, ISBN 9780070588141 Search PubMed.
- F. T. Wallenberger and P. A. Bingham, Fiberglass and Glass Technology: Energy-Friendly Compositions and Applications, Springer Science & Business Media, 2009, ISBN 9781441907363 Search PubMed.
- J. Li, M. Zhao, X. Gao, X. Wan and J. Zhou, Modeling the stiffness, strength, and progressive failure behavior of woven fabric-reinforced composites, J. Compos. Mater., 2014, 48(6), 735–747 CrossRef.
- C. Duan, X. Wen, C. Shi, Y. Zhao, B. Wen and Y. He, Recovery of metals from waste printed circuit boards by a mechanical method using a water medium, J. Hazard. Mater., 2009, 166, 478–482 CrossRef CAS PubMed.
| This journal is © The Royal Society of Chemistry 2017 |


