 Open Access Article
Synthesis of chelating polyamine fibers and their adsorption properties for nickel(II) ions from aqueous solution
Jianlan Cui†
,
Yanru Li†
 *,
Jian Meng,
Congsan Zhong and
Peng Wang
Department of Chemical Engineering, North University of China, Taiyuan, China 030051. E-mail: 1369456330@qq.com
First published on 18th August 2017
Abstract
A novel fiber supported adsorbent PVAF-g-PEI was first developed by grafting polyethylenimine on polyvinyl alcohol fibers (PVAF). In order to increase the nickel(II) adsorption capacity of PVAF-g-PEI, they were chemically modified with amine-rich reagent tetraethylenepentamine by using a crosslinker, glutaraldehyde (GA). The effect of grafting reaction parameters was investigated. The prepared fiber sorbent PA–PVAF was characterized by using FT-IR, SEM, XPS and element analysis and used for the adsorption of nickel(II) from aqueous solutions. The factors influencing nickel(II) adsorption on PA–PVAF, such as contact time, solution pH, temperature and ionic strength, were also studied. At pH 7.0, the sorption capacity of PA–PVAF was 91.03 mg g−1 for nickel(II). The Langmuir isotherm model precisely explained the equilibrium data. Adsorbent–adsorbate kinetics were pseudo second order. Meanwhile, the adsorption–desorption cycle experiments showed that PA–PVAF had good reuse performance.
 Jianlan Cui | Jianlan Cui: Female, fifty years old, Shanxi Linfen person, Professor, School of chemical engineering and the environment, North University of China, director of the Department of Chemical Engineering, Director of instrument testing center. Mainly engaged in the pharmaceutical, functional polymer materials and fine chemical industry research. Communication e-mail: E-mail: 414559203@qq.com |
 Jian Meng | Jian Meng: Male, twenty-seven years old, Shanxi Huairen person, Doctoral candidate, School of chemical engineering and the environment, North University of China, Shanxi, China. Mainly engaged in the functional polymer materials and fine chemical industry research. Communication e-mail: E-mail: 844986037@qq.com |
At present, the treatment methods for the removal of heavy metal ions in aqueous solution are mainly adsorption, ion exchange, membrane filtration, chemical reduction and reverse osmosis.6–9 Due to the advantages of low running cost, low dissipation of energy and easy operation, the adsorption method has received much attention.10–12
Krishnan et al.10 reported a kind of activated carbon adsorbent prepared from raw sugarcane bagasse pith. The adsorption experiments showed high adsorption capacity of 140.85 mg g−1 for the removal of Ni(II) from aqueous solutions at pH 6.5. Meanwhile, the activated carbon adsorbent showed high adsorption capacity, reusability, low cost and environmental protection. Euvrard et al.11 prepared two new silica-based sorbents. At pH 7.0, the maximum adsorption capacity for Ni(II) on the adsorbent was found to be 182 mg g−1 and 210 mg g−1 respectively. Apart from high sorption capacities, these sorbents presented additional advantages such as cost effective and facile preparation. Wakeel et al.12 performed an investigation on removal of Ni(II) by nano magnetite chitosan films. The prepared films were tested for removal of Ni(II) ions in aqueous solution. The maximum removal percentage for sorption Ni(II) was 91% using the composite films at pH 6.5. Moreover, the sorption–desorption studies showed good recyclability of the films.
Polyethylenimine (PEI) is a kind of heavy metal chelating agent. There are a large number of amino groups on the molecular chain, which makes it have strong complexing ability for heavy metal ions. It has wide application prospect in the treatment of wastewater containing heavy metal and dye.13,14 However, because PEI is soluble in water, it is difficult to recover it if directly used for adsorption, whereas immobilizing the PEI on solid support can resolve that.15 At the same time, no secondary pollution should be taking into account in the removal of pollutants.
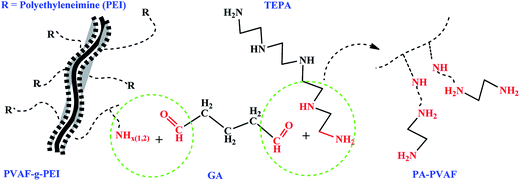
In this study, with an effort to prepare an adsorbent with high efficiency, no secondary pollution and easy operation, polyvinyl alcohol fibers (PVAF) were selected as carrier. First, the PEI chain was grafted onto PVAF surface with the aid of coupling agent γ-glycidoxypropyltrimethoxysilane, obtaining grafted fiber PVAF-g-PEI. Then, the polyamine compound tetraethylenepentamine was bonded to the surface of the PVAF-g-PEI fibers using crosslinking agent glutaraldehyde, and the polyamine chelating fiber (PA–PVAF) was prepared. The specific process was presented in Scheme 1. Furthermore, the adsorption behavior of PA–PVAF to Ni(II) was investigated. The results indicated that the PA–PVAF was an efficient fibrous sorbent for the effective removal of Ni(II). The polyamine adsorbent PA–PVAF not only has good adsorption performance, but also has the advantages of environmental protection. It will not cause secondary pollution to the environment after be abandoned.
1 Experimental section
1.1 Reagents and instruments
Polyvinyl alcohol fiber (PVAF, SY-9, Sichuan Vigny fiber factory); γ-glycidoxypropyltrimethoxysilane (GPTMS), polyethyleneimine (PEI, 50 wt% aqueous solution), glutaraldehyde (GA, 50% in water), tetraethylenepentamine (TEPA), nickel nitrate were purchased from Shanghai Aladdin Chemistry Co. Ltd. (Shanghai, China); other reagents were pure chemical reagents. Deionized water was produced by our own. The glassware used in the experiments was soaked in 0.1 M HNO3 solution for 12 h, then washed several times with deionized water, dried for standby.Thermo Nikolet 6700 Infrared Spectrometer (FT-IR, Nicolet Company, America); S4800 Scanning Electron Microscope (SEM, Hitachi company, Japan); Axis UTLTRADLD X-ray photoelectron spectrometer (XPS, Shimadzu company, Japan); Elemental Analyzer (EA, Elementar Vario EL, Germany); AA6300C Atomic Absorption Spectrometer (AAS, Hitachi company, Japan).
1.2 Preparation and characterization of functional chelating fiber PA–PVAF
A certain amount of PVA fiber was placed in acetone solvent ultrasonic cleaning for half an hour, drying for standby.(1) 1.0 g treated fiber was placed into 50 mL isopropanol, while adding 8 mL GPTMS, the reaction was performed at 65 °C for 10 h. The reaction products GPTMS/PVAF were washed several times with ethanol to remove unreacted silane physically adsorbed on the fiber surface, and then vacuum dried to constant weight.
(2) The product obtained in step one was placed in a flask containing 50 mL isopropanol. Then 5 mL 50 wt% PEI solution was added into the flask and adjusted the solution pH to 10 by using Na2CO3 solution. The grafting reaction was carried out at 50 °C for 12 h. The products PVAF-g-PEI were repeatedly washed with distilled water to neutral, and vacuum dried to constant weight.
(3) The resultant fibers in step two were placed in 50 mL of water was added. Followed by the addition of 3 mL TEPA and stirring for 30 min. Afterwards, 8 mL 3 wt% GA solution was added using constant pressure dropping funnel with stirring in 30 min. The crosslinking reaction was conducted at 40 °C for 6 h. After the reaction was finished, the products PA–PVAF were separated by filtration and rinsed several times with distilled water, and dried under vacuum.
The chemical structure of the resultant products was characterized and confirmed by using FT-IR, EA and XPS. The changes of fiber morphology were observed by using SEM.
1.3 Study on adsorption properties of chelate fiber PA–PVAF
500 mg L−1 of Ni(II) based solution was prepared by using Ni(NO3)2·6H2O, and different concentrations of Ni(II) were diluted from the basic solution. The concentration of Ni(II) in the solution was determined by using AAS and all the experiments were repeated three times. The pH value of Ni(II) solution was adjusted by 0.1 M HCl and 0.1 M NaOH.300 mg L−1 of Ni(II) solution was prepared using the above based solution. PVAF-g-PEI and PA–PVAF were used as adsorbent, and the adsorption kinetics were carried out. The results showed that the adsorption equilibrium time was about 90 min. 0.05 g PA–PVAF was introduced into 30 mL Ni(II) solution with different concentration (from 30 to 300 mg L−1). The isothermal adsorption experiments were performed for 90 min in a constant temperature oscillator. Then the adsorbent was separated by filtration and the Ni(II) concentration in the solution was determined by using AAS. The equilibrium adsorption amount was calculated according to eqn (1.1). The desorption rate of Ni(II) in desorption experiment was calculated by using eqn (1.2).
 | (1.1) |
 | (1.2) |
2 Results and discussion
2.1 Characterization of functional fibers
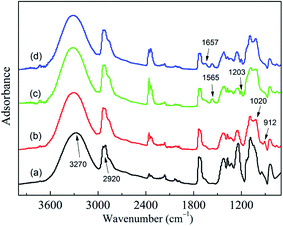
Fig. 1 shows the FT-IR spectra of different fibers.According to ref. 16 and 17, the infrared spectrum of PVAF (Fig. 1a) shows a band at 3270 cm−1 due to the elongation of the O–H bonds. The band at 2920 cm−1 could be attributed to the C–H (CH3, CH2) bond elongation, this band was characteristic of materials with saturated carbons or sp3. In spectrum of GPTMS/PVAF (Fig. 1b), the band at 912 cm−1 is assigned to the epoxide rings. In addition, the band at around 1020 cm−1 is the characteristic absorption bands of Si–O bond. In the spectrum of PVAF-g-PEI (Fig. 1c), the characteristic absorption band of the epoxy groups at 910 cm−1 weaken a lot, whereas the characteristic absorption bands of N–H and C–N appear at 1565 cm−1 and 1203 cm−1 respectively. The appearances of the bands reveal that PEI has been grafted onto the fiber surface. In the spectrum of PA–PVAF (Fig. 1d), the characteristic absorption band of C![[double bond, length as m-dash]](https://www.rsc.org/images/entities/char_e001.gif) N bond appears at 1657 cm−1, indicating that the aldehyde groups of GA have been reacted with the amino groups of PEI. The characteristic absorption peaks appear above fully demonstrates that PA–PVAF has been prepared.
N bond appears at 1657 cm−1, indicating that the aldehyde groups of GA have been reacted with the amino groups of PEI. The characteristic absorption peaks appear above fully demonstrates that PA–PVAF has been prepared.
The studied fibers were fixed on the sample table with conductive adhesive, and then coated with platinum. As can be seen in Fig. 2, the surface of the PVA fiber (Fig. 2a) is smooth. The fiber diameter is about 20–40 μm. Through the grafting reaction of PEI on PVA fibers and subsequent crosslinking modification, the structure of the obtained fibers PA–PVAF (Fig. 2b and c) remains nearly unchanged. However, the surface of the fibers has become a little rough and scraggy after reaction. This may be due to the macromolecular reaction which leading the accumulation of polyethyleneimine molecular chain on the fiber surface, indicating that the polyamine chelating fiber PA–PVAF has been prepared.
The exact amount of various elements in different types of fibers was analyzed by CHN organic element analyzer. The data obtained are presented in Table 1. The result shows the presence of C and H in the PVAF, and the calculations indicate that the amounts of C and H are approximately 54.73% and 8.68%, respectively. For polyethyleneimine-grafted fibers PVAF-g-PEI, a nitrogen percentage of 2.12% is determined, corresponding to the grafted chains PEI. Meanwhile, PA–PVAF presents a nitrogen content of 3.28%. The elevated percentage suggests that TEPA (nitrogen content at about 37%) is attached to PVAF-g-PEI surface.
| Samples | C (%) | H (%) | N (%) |
|---|---|---|---|
| PVAF | 54.73 | 8.68 | — |
| PVAF-g-PEI | 55.02 | 9.13 | 2.12 |
| PA–PVAF | 54.83 | 9.35 | 3.46 |
The chemical environment of the fiber surface was analyzed by using XPS, wherein the light source is monochromatized Al Kα (1486.6 eV), and the working cavity pressure is better than 6.65 × 10⁷ Pa. All binding energies were calibrated by C1s hydrocarbon peak at 284.8 eV. The linear background was used in the analysis process.
Fig. 3 shows the full spectrum of various fibers.18 For PVAF (Fig. 3a), the characteristic peaks of C1s and O1s are detected at 284 eV and 399 eV respectively. After modification with GPTMS, the peak of Si2p is detected at 102 eV (Fig. 3b). Then, the peak of N1s is detected at 530 eV by grafting PEI on the surface (Fig. 3c). After the surface modification of PVAF-g-PEI with TEPA, the species of element has not changed while the peak intensity of the modified surface changes (Fig. 3d).
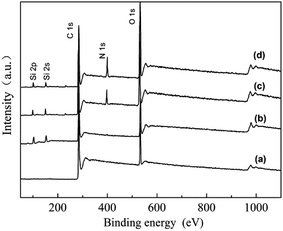 | ||
| Fig. 3 XPS survey spectra of different fibers (a) PVAF, (b) GPTMS/PVAF, (c) PVAF-g-PEI, (d) PA–PVAF. | ||
As shown in Fig. 4 and Table 2, the XPS spectra of C1s is curve-fitted into three individual peaks to represent three types of carbon atoms, including C1 (C–C, C–H), C2 (C–O, C–N) and C3 (C![[double bond, length as m-dash]](https://www.rsc.org/images/entities/char_e001.gif) O, C
O, C![[double bond, length as m-dash]](https://www.rsc.org/images/entities/char_e001.gif) N).19,20 In the C1s spectrum of original fibers PVAF, C1 component is mainly from the carbon skeleton of PVA molecular chain. The C2 component is due to a carbon bound to hydroxyl oxygen atom. And C3 component is assigned to residual acetyl groups on the molecular chain of PVA. In the C1s spectrum of PVAF-g-PEI, as the PEI which contains a large number of amino is adhered on the surface, the percentage content of C2 species increases while that of C3 species decreases. In the C1s spectrum of PA–PVAF, the TEPA is bonded onto the PVAF-g-PEI surface by crosslinking reaction with GA. The resultant imine produced by the reaction leads to the increase of C3 species.
N).19,20 In the C1s spectrum of original fibers PVAF, C1 component is mainly from the carbon skeleton of PVA molecular chain. The C2 component is due to a carbon bound to hydroxyl oxygen atom. And C3 component is assigned to residual acetyl groups on the molecular chain of PVA. In the C1s spectrum of PVAF-g-PEI, as the PEI which contains a large number of amino is adhered on the surface, the percentage content of C2 species increases while that of C3 species decreases. In the C1s spectrum of PA–PVAF, the TEPA is bonded onto the PVAF-g-PEI surface by crosslinking reaction with GA. The resultant imine produced by the reaction leads to the increase of C3 species.
| Samples | C1 (%) C–C/C–H | C2 (%) C–O/C–N | C3 (%) C![[double bond, length as m-dash]](https://www.rsc.org/images/entities/char_e001.gif) O/C O/C![[double bond, length as m-dash]](https://www.rsc.org/images/entities/char_e001.gif) N N |
|---|---|---|---|
| PVAF | 54.03 | 41.42 | 4.55 |
| PVAF-g-PEI | 41.16 | 57.3 | 1.54 |
| PA–PVAF | 42.21 | 50.71 | 7.08 |
2.2 Influence of the main factors on the preparation of PA–PVAF
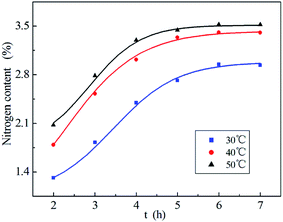
In this study, the effect of reactant ratio, reaction temperature, reaction time and dosage of GA on PA–PVAF preparation were investigated. The preferred conditions for the reaction were selected by measuring the nitrogen content of the products.By fixing the other reaction condition, the nitrogen content of PA–PVAF varies with time at different temperature are shown in Fig. 5. With the increase of temperature, the nitrogen content increases at the same time. The results indicate that increase of temperature is beneficial to the reaction. Therefore, the suitable reaction temperature and time is 40 °C and 6 h.
The amount of reactant PVAF-g-PEI was fixed at 1.0 g. As shown in Table 3, the nitrogen content of product PA–PVAF increases by increasing the GA amount. When the dosage of GA is 8 mL, the nitrogen content is up to 3.25%. With further increasing the GA amount, the subsequent addition of GA does not participate in the cross-linking reaction, resulting in little change in nitrogen content.
In addition, it can be observed that the nitrogen content increases with increasing the dosage of TEPA solution. When the addition amount is 3.0 mL, the nitrogen content is up to 3.46%. But the nitrogen content decreases when the amount of TEPA increases continue. The main reason is that when the amount of TEPA solution is too large, the intermolecular crosslinking reaction of TEPA or PEI increased. Therefore, the bonded amount of TEPA decreases and the nitrogen content of product PA–PVAF decreases.
2.3 Study on adsorption properties of chelating fiber PA–PVAF
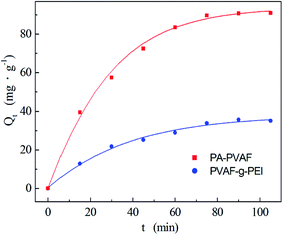 | ||
| Fig. 6 Effect of contact time on Ni(II) adsorption by PVAF-g-PEI and PA–PVAF. C0 (Ni(II)) 300 mg L−1; pH 7.0; temperature 293 K. | ||
Additionally, the maximum amount of Ni(II) adsorption in Fig. 6 is found to be 35.67 mg g−1 for PVAF-g-PEI, and 91.03 mg g−1 for PA–PVAF, respectively. The polyethyleneimine chains on the surface of PVAF-g-PEI can adsorb heavy metal ions through the abundant amino. Through the amino-modification of PVAF-g-PEI with the aid of crosslinking agent GA, the number of nitrogen atoms with lone pairs of electrons on PA–PVAF chains increases, which gives rise to more adsorption sites and leads to greater capacity of adsorption for Ni(II).
The adsorption kinetic data were fitted with the pseudo first order (eqn (2.1)) and pseudo second order kinetics model (eqn (2.2)) to further study the adsorption kinetics.21,22 They corresponding kinetic controlling mechanism is assumed of liquid film diffusion and surface chemical adsorption, respectively. The corresponding expressions are as follows:
ln(Qe − Qt) = ln![[thin space (1/6-em)]](https://www.rsc.org/images/entities/char_2009.gif) Qe − k1t Qe − k1t
| (2.1) |
 | (2.2) |
As shown in Table 4, the correlation coefficient R2 of pseudo-second order model is closer to 1 than that of pseudo-first order model. The equilibrium adsorption amount of Qe obtained by the pseudo-second order model is closer to the experimental value (Qtest). The adsorption rate k2 of PA–PVAF is faster than that of PVAF-g-PEI due to the strong surface chelation. It is shown that the adsorption process can be described by pseudo-second order model, and the adsorption rate is controlled by surface chemical reaction.
| Adsorbent | Qexperimental/(mg g−1) | Pseudo-first-order model | Pseudo-second order model | ||||
|---|---|---|---|---|---|---|---|
| Qe/(mg g−1) | k1/min−1 | R2 | Qe/(mg g−1) | k2/(g mg−1 min−1) | R2 | ||
| PVAF-g-PEI | 35.67 | 57.74 | 0.040 | 0.958 | 45.63 | 1.43 × 10⁻⁴ | 0.988 |
| PA–PVAF | 91.03 | 198.13 | 0.066 | 0.971 | 115.20 | 3.12 × 10⁻⁴ | 0.991 |
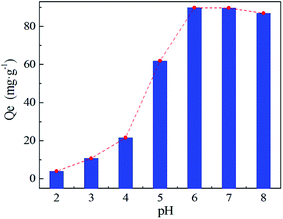
The solution pH not only affects the form of heavy metal ions, but also determines the surface charge of the adsorbent. The adsorption behavior of Ni(II) on PA–PVAF surface has been investigated within pH range of 2.0–8.0 at an initial Ni(II) concentration of 300 mg L−1. High value of pH was not tested due to the precipitation of Ni(II) as hydroxides.23,24 As can be seen in Fig. 7, the adsorption capacity of Ni(II) is obviously low under low pH. This is because amino groups on the PA–PVAF surface are in the protonation state at low pH. This leads to electrostatic repulsion with the positively charged Ni(II), reducing the adsorption capacity. With increasing pH, the fiber surface protonation decreases and promotes the adsorption of Ni(II). When pH is 7.0, the equilibrium adsorption capacity of PVAF-g-CACTS to Ni(II) reaches 89.70 mg g−1. Moreover, the pH selected for further experiments is 7.0.
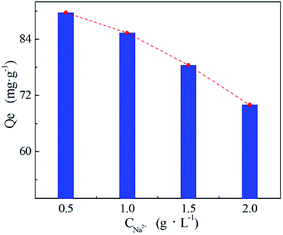
The effect of ionic strength on Ni(II) adsorption onto PA–PVAF was investigated by adding NaCl at different concentrations (from 0.5 g L−1 to 2.0 g L−1). The initial Ni(II) concentration in the aqueous solution was 300 mg L−1, the results are illustrated in Fig. 8. It can be seen that the decrease in saturated adsorption quantity with increase in salt concentration. At the highest salt concentration (2.0 g L−1), the amounts of adsorbed Ni(II) decrease to 71.23 mg g−1. That may be due to the high salt concentrations exist in aqueous solution, which not only affects the ionic strength of the water, but also may compete for adsorption sites against heavy metal ions.25 The effective adsorption sites of adsorbent PA–PVAF were occupied by Na+, resulting in the reduction of Ni(II) adsorption.
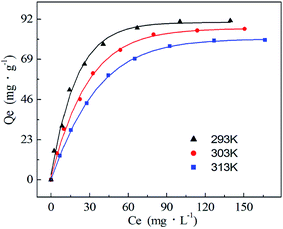 | ||
| Fig. 9 Adsorption isotherms of Ni(II) adsorption by PA–PVAF at different temperatures. C0 (Ni(II)) 300 mg L−1; pH 7.0. | ||
The Langmuir (eqn (2.3)) and Freundlich (eqn (2.4)) isothermal models are used to describe experimental data of adsorption isotherm.25,26 The Langmuir isotherm assumes monolayer coverage of the adsorption surface, and no further adsorption can occur when the adsorption saturates; the Freundlich isotherm describes the adsorption of the polymer layer at the heterogeneous interface. The corresponding expressions are as follows:
 | (2.3) |
 | (2.4) |
Table 5 lists the parameters derived from the Langmuir and Freundlich models. It can be seen that the values of R2 for Langmuir model are exceedingly high in comparison to value of R2 for Freundlich model. It is obvious that the data were fitted to the Langmuir model. Isotherm with n > 1 is implying a high affinity between PA–PVAF and Ni(II) and is indicative of chemisorption.12
| T/K | Langmuir model | Freundlich model | |||||
|---|---|---|---|---|---|---|---|
| Qm/(g mg−1) | b (L mg−1) | R2 | RL | n | kF/(mg g−1) | R2 | |
| 313 | 85.01 | 0.028 | 0.990 | 0.11–0.54 | 1.887 | 6.713 | 0.908 |
| 303 | 93.52 | 0.037 | 0.992 | 0.08–0.47 | 1.919 | 8.215 | 0.934 |
| 293 | 101.69 | 0.063 | 0.997 | 0.05–0.35 | 2.207 | 12.820 | 0.940 |
At the same time, the applicability of the Langmuir model can be articulated according to the dimensionless parameter, RL (eqn (2.5)). Where b is the Langmuir constant and C0 is the initial concentration of Ni(II). The value of RL reveals whether the type of isotherm adsorption is unfavorable (RL > 1), favorable (0 < RL < 1), irreversible (RL = 0) or linear (RL = 1).26 As can be seen from Table 5, the values of RL over an initial Ni(II) concentration range of 30–300 mg L−1 at different temperature were between 0 and 1, which indicated that the experimental conditions were favorable for adsorption.
 | (2.5) |
Compared with other adsorbents reported in literature, the polyamine chelating fiber PA–PVAF exhibits better adsorption performance than most reported ones (Table 6). The difference in maximum adsorption capacity (Qmax) is most likely caused by various functional groups, different types of structures, and diverse adsorption conditions.
| Adsorbent | Temperature/K | Solution pH | Qmax (mg g−1) | Reference | |
|---|---|---|---|---|---|
| Activated carbon (SBP-AC) | 298 | 6.5 | 140.85 | 10 | |
| Silica/based composites | SiO2/CS | 298 | 7.0 | 182 | 11 |
| SiO2(CO2H)/CS | 210 | ||||
| Nano magnetite chitosan film (NMag–CS) | Room temp. | 6.5 | 109.8 | 12 | |
| Chitosan/magnetite composite | Room temp. | 6.0 | 52.55 | 27 | |
| Carbohydrate-based activated carbon | AC-Glu | 298 | 6.0 | 48.5 | 28 |
| AC-Suc | 42.4 | ||||
| AC-Sta | 41.1 | ||||
| AC-Pa | 28.7 | ||||
| Fe3O4/cyclodextrin polymer nanocomposites | 298 | 5.5 | 13.2 | 29 | |
| Ceramic adsorbent PPTs/PS | Room temp. | 7.5 | 19.9 | 30 | |
| Poly(chitosan-acrylamide)flocculant | 298 | 7.0 | 63.15 | 31 | |
| Chelating fibers PA–PVAF | 298 | 7.0 | 91.03 | This study | |
2.4 Regeneration and reusability
The desorption of Ni(II) from the PA–PVAF was carried out with distilled water, 0.1 M NaCl, 0.05 M NaCl and 0.05 M Na2EDTA, and the corresponding desorption rate was 1.65%, 9.52%, 82.36% and 93.39%, respectively (Fig. 10). The results revealed that 0.05 M Na2EDTA was a more suitable eluent. The adsorption–desorption experiments were carried out for 5 times, and the reusability versus recycling time is shown in Fig. 11. It can be seen that the adsorption capacity of PVAF-g-CACTS to Cd(II) decreases only slightly after 5 cycles. The adsorption capacity in the fifth cycle is still 86.35 mg L−1. It proves that PA–PVAF shows excellent performance of reuse.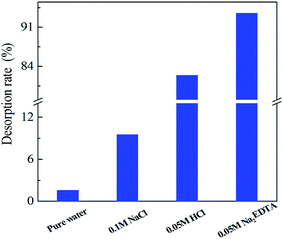 | ||
| Fig. 10 Desorption rate of Ni(II) from PA–PVAF using different desorption eluents C0 (Ni(II)) 300 mg L−1; pH 7.0; temperature 293 K. | ||
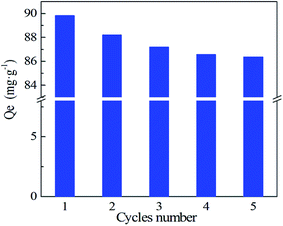 | ||
| Fig. 11 Five adsorption–desorption cycles of PA–PVAF adsorbent for Ni(II) C0 (Ni(II)) 300 mg L−1; pH 7.0; temperature 293 K. | ||
3 Conclusions
A novel polyamine chelating fiber material PA–PVAF was prepared with crosslinking PEI and TEPA using GA as crosslinker. The optimal reaction conditions for the preparation of PA–PVAF were investigated. The appropriate reaction temperature is 40 °C and the suitable reaction time is 6 h. Moreover, the adsorption property of PA–PVAF to Ni(II) was evaluated. The maximum adsorption of Ni(II) was observed at pH 7.0, and the adsorption amount can reach up to 91.03 mg g−1. The adsorption capacity decreased with the increase of temperature, indicating that the adsorption of Ni(II) ions on PA–PVAF was spontaneous. The Langmuir isotherm model precisely explained the equilibrium data. Adsorbent–adsorbate kinetics exhibited pseudo second order. 0.05 M Na2EDTA solution showed excellent desorption efficiency for Ni(II) with a recovery of 92.6%. The adsorption–desorption cycle experiments showed that PA–PVAF had good performance of reuse. After five cycles, the adsorption capacity of PA–PVAF towards Ni(II) still reached 86.35 mg L−1. Apart from its great performance for the retention of Ni(II), the new sorbents presented additional advantages such as simple technique and facile preparation.Acknowledgements
We are grateful to National Natural Science Foundation of China (Project No. 22404093), Fund for Postgraduate of North University of China (Project No. 20151230).Notes and references
- P. Z. Ray and H. J Shipley, RSC Adv., 2015, 5, 29885–29907 RSC.
- O. Ozay, S. Ekici, Y. Baran, N. Aktas and N. Sahiner, Water Res., 2009, 43, 4403–4411 CrossRef CAS PubMed.
- H. H. Najafabadi, M. Irani, L. R Rad, A. H Haratameh and I. Haririan, RSC Adv., 2015, 5, 16532–16539 RSC.
- S. T. Yang, G. D Sheng, X. L. Tan, J. Hu, J. Z. Du, G. Montavon and X. K. Wang, Geochim. Cosmochim. Acta, 2011, 75, 6520–6534 CrossRef CAS.
- C. E. Borba, R. Guirardello, E. A. Silva, M. T. Veit and C. R. G. Tavares, Biochem. Eng. J., 2006, 30, 184–191 CrossRef CAS.
- A. H. Gedam and R. S. Dongre, RSC Adv., 2015, 5, 54188–54201 RSC.
- C. Santhosh, V. Velmurugan, G. Jacob, S. K. Jeong, A. N. Grace and A. Bhatnagar, Chem. Eng. J., 2016, 306, 1116–1137 CrossRef CAS.
- M. Xu, Y. S Zhang, Z. M Zhang, Y. Shen, M. J Zhao and G. T Pan, Chem. Eng. J., 2011, 168, 737–745 CrossRef CAS.
- T. Budinova, D. Savova and B. Tsyntsarski, Appl. Surf. Sci., 2009, 255, 4650–4657 CrossRef CAS.
- K. Anoop Krishnan, K. G. Sreejalekshmi and R. S. Baiju, Bioresour. Technol., 2011, 102, 10239–10247 CrossRef CAS PubMed.
- R. Singhon, J. Husson, M. Knorr, B. Lakard and M. Euvrard, Colloids Surf., B, 2012, 93, 1–7 CrossRef CAS PubMed.
- M. R. Lasheen, I. Y. El-Sherif, M. E. Tawfik, S. T. El-Wakeel and M. F. El-Shahat, Mater. Res. Bull., 2016, 80, 344–350 CrossRef CAS.
- A. Denizli, S. Senel, G. Alsancak, N. Tuzmen and R. Say, React. Funct. Polym., 2003, 55, 121–130 CrossRef CAS.
- B. J. Gao, F. Q. An and K. K. Liu, Appl. Surf. Sci., 2006, 253, 1946–1952 CrossRef CAS.
- A. K. Thakura, G. M. Nisolaa, L. A. Limjucoa, K. J. Parohinog, R. E. C. Torrejos, V. K. Shahi and W. J. Chung, J. Ind. Eng. Chem., 2017, 49, 133–144 CrossRef.
- Y. Shirosaki, K. Tsuru, S. Hayakawa, A. Osaka, M. A. Lopes, J. D. Santos, M. A. Costa and M. H. Fernandes, Acta Biomater., 2009, 5, 346–355 CrossRef CAS PubMed.
- S. Pouranvari, F. Ebrahimi, G. Javadi and B. Maddah, Mater. Tehnol., 2016, 50(5), 663–666 CrossRef.
- S. Altenor, B. Carene, E. Emmanuel, J. Lambert, J. J. Ehrhardt and S. Gaspard, J. Hazard. Mater., 2009, 165, 1029–1039 CrossRef CAS PubMed.
- G. X. Zhang, S. H. Sun, D. Q. Yang, J. P. Dodelet and E. Sacher, Carbon, 2008, 46, 196–205 CrossRef CAS.
- H. Chen and Z. Hashisho, Fuel, 2012, 95, 178–182 CrossRef CAS.
- Y. Cheng, C. P. Yang, H. J. He, G. M. Zeng, K. Zhao and Z. Yan, J. Environ. Eng., 2016, 142, C4015001 CrossRef.
- C. Yang, J. Q. Wang, M. Lei, G. X. Xie, G. M. Zeng and S. L. Luo, J. Environ. Sci., 2010, 22(5), 675–680 CrossRef CAS.
- Y. Vijaya, S. R. Popuri, V. M. Boddu and A. Krishnaiah, Carbohydr. Polym., 2008, 72, 261–271 CrossRef CAS.
- E. Ahmet, N. Tirtom, T. Aydemir, S. Becerik and A. Dincer, Chem. Eng. J., 2012, 210, 590–596 CrossRef.
- Y. Q. Huang, C. P. Yang, Z. C. Sun, G. G. Zeng and H. J. He, RSC Adv., 2015, 5, 11475–11484 RSC.
- R. Sharma, A. Sarswat, C. U. Pittman Jr and D. Mohan, RSC Adv., 2017, 7, 8606–8624 RSC.
- H. V. Tran, L. D. Tra and T. N. Nguyen, Mater. Sci. Eng., C, 2010, 30, 304–310 CrossRef CAS.
- H. Liu, J. Zhang, H. H. Ngo, W. S. Guo, H. M. Wu, C. Cheng, Z. Z. Guo and C. L. Zhang, RSC Adv., 2015, 5, 52048–52056 RSC.
- A. Z. M. Badruddozaa, Z. B. Z. Shawona, T. W. D. Tay, K. Hidajat and M. S. Uddin, Carbohydr. Polym., 2013, 91, 322–332 CrossRef PubMed.
- M. A. A Gonzalez, A. A. Z. Cadena, C. N. Aguilar and E. M. Muzquiz, RSC Adv., 2015, 5, 29748–29756 RSC.
- A. S. Saleh, A. G. Ibrahim, F. Abdelhai, E. M. Elsharma, E. Metwally and T. Siyam, Radiat. Phys. Chem., 2017, 134, 33–39 CrossRef CAS.
Footnote |
| † These authors contributed equally to this work. |
| This journal is © The Royal Society of Chemistry 2017 |

