DOI:
10.1039/C7RA06914F
(Paper)
RSC Adv., 2017,
7, 40227-40236
Preparation of PEI/CS aerogel beads with a high density of reactive sites for efficient Cr(VI) sorption: batch and column studies†
Received
21st June 2017
, Accepted 4th August 2017
First published on 16th August 2017
Abstract
In view of the sustainable character and high-density of reactive sorption sites, a new kind of poly(ethylenimine)/chitosan (PEI/CS) aerogel beads were successfully synthesized using controllable sol–gel and freeze drying methods, with the aim of using them for efficient Cr(VI) removal from aqueous acid solutions. Compared with the reported CS-based sorbents for hexavalent chromium [Cr(VI)], not only is the synthetic process used simple but the bead-like samples could be easily separated from solutions for recycling. Structural characterization and batch experiments were compared to illustrate the adsorption performance of the aerogel beads which were synthesized using various processes. Out of the three samples (CS–glutaraldehyde (GA), CS–GA–PEI and CS/PEI–GA beads), the one referred to as CS–GA–PEI exhibited the highest adsorption capacity and the maximum amount of Cr(VI) removal was 402.9 mg g−1 at pH 2.0 and 298 K. The pseudo-second-order and Langmuir model preferably fitted the adsorption process best. After five cycles of desorption–regeneration tests, more than 80% of Cr(VI) could still be removed by these newly designed CS–GA–PEI beads. Adsorption mechanisms could be explained using electrostatic attraction and reduction reaction theories, on the basis of comprehensive analysis. More importantly, taking advantage of the micrometer sized particles and three-dimensional network that developed, fixed-bed column tests were also conducted on the resultant bead-like sample, which also exhibited excellent sorption performance under testing conditions. These superiorities of CS–GA–PEI beads make them a potential candidate for use in remediating the pollution caused by Cr(VI) ions.
1. Introduction
Because of the high mobility, toxicity and non-biodegradable nature of heavy metal ions in nature, the majority of them can enter the human body easily through the food chain.1–4 As a member of the toxic priority heavy metals which affect human health, hexavalent chromium [Cr(VI)], which is widely produced from many industries such as electroplating, leather tanning, pigments, metallurgy, and textiles, has been significantly interesting people.5 When confronted with the highest warning limit (0.05 mg L−1) for total chromium {including trivalent chromium [Cr(III)], Cr(VI) and its other forms} in drinking water from World Health Organization (WHO),1 the important task is to decrease the total concentration, in drinking water and industrial effluents, to a desirable level for the conservation of the environment.
Various useful methods, such as reduction, biological, membrane filtration, ion exchange, chemical and adsorption, have been used to remove Cr(VI) from wastewater.6–11 However, amongst them, adsorption is generally accepted as an attractive method, because of its high efficiency, simple preparation process, and lower secondary pollution than other techniques.12,13
Considering the various resources that decrease every day, many researchers and the authors of this paper have turned to biomass derived materials. For example, utilizing byproducts of the agriculture and marine industries, i.e., rice husks and sodium alginate, several types of effective adsorbents have been prepared to remove heavy metal ions or dyes, for which they exhibited expected sorption performances.14–18 In addition to the starting materials previously mentioned, because of the abundant presence of –OH and –NH2 groups, renewable chitosan (CS) has been extensively studied for the removal of heavy metal ions from aqueous solutions.19 Meanwhile, as a renewable resource, CS can be easily obtained from shellfish and the wastes of the seafood processing industry.20 Because of the natural, easy-to-dissolve properties of CS, it is difficult to recycle and re-use it as a traditional CS-based adsorbent in acidic conditions. Because of this, there is high demand to improve its mechanical strength using surface modification or crosslinking using specific reagents. As a widely used crosslinking agent, glutaraldehyde (GA) has been successfully applied to solve this problem for CS-based composites.21–23
Because of the favorable affinity of the amine group towards the adsorption of heavy metal ions,24 including Cr(VI), branched polyethylenimine (PEI), which contains numerous amine groups in each molecular unit, and many more than other amino-containing chemicals, can be used as a coating and/or modifying agent to improve the adsorption performance.25,26 Sun and co-workers have successfully prepared PEI-modified iron(II,III) oxide–silicon dioxide (Fe3O4–SiO2)–CS magnetic microspheres, nevertheless, not only was the maximum adsorption amount relatively low, only 236.4 mg g−1 at 298 K for Cr(VI), but also the preparative procedures for this composites consisted of multiple steps which were complicated.27 In addition, when compared to other CS-based membrane or bead-like adsorptive materials,28,29 magnetic powdery materials have had to be separated from solutions using an extra strong magnet, which would unavoidably result in secondary pollution derived from non-magnetic components. More significantly, from a practical point of view, there are problems of preparative cost and small particles which might cause bottlenecks for this type of adsorptive material. Within this context, taking the unique advantages of the abundant amino groups of both PEI and CS molecules, searching for a controllable method to fabricate bead-like high-performance sorbents toward Cr(VI) removal is of practical significance.
Following the previously mentioned discussion, in this research, renewable CS and branched PEI were used to synthesize three type of aerogel beads: CS–GA, CS–GA–PEI and CS/PEI–GA using the controllable sol–gel and freeze-drying processes with different synthesis procedures. Batch adsorption experiments (determining solution pH, primal solution concentration, regeneration conditions and the effect of co-existing ions) and column studies were used to test the removal capacity of Cr(VI) from aqueous solutions using these newly synthesized adsorbents. At the same time, the adsorption isotherms and kinetic models were further discussed to accurately investigate the adsorption process. Therefore, a feasible adsorption mechanism was proposed based on the extensive experimental data and testing conditions.
2. Materials and methods
2.1 Materials and reagents
PEI (molecular weight (Mw) ∼ 600 Da) was purchased from Aladdin Chemical Co., Ltd., China. CS (degree of deacetylation: 80.0–95.0%, Mw ∼ 1.3 × 10⁵ Da) was provided by Sinopharm Chemical Reagent Co., Ltd, China. GA (50% in water), glacial acetic acid, potassium dichromate (K2Cr2O7), 1,5-diphenylcarbazide, sodium hydroxide (NaOH), hydrochloric acid (HCl), sodium chloride, sodium nitrate, sodium sulfate and trisodium phosphate dodecahydrate were obtained from Kermel (Tianjin, China). All chemical reagents were of analytical grade and no further purification was required before use.
2.2 Synthesis of CS–GA beads
Firstly, CS solution was prepared by dissolving 0.75 g of CS in 25 mL of a 5.0% aqueous solution (w/w) of glacial acetic acid with stirring. The CS hydrogel beads, with a mean diameter of 3 mm, were obtained by dropwise addition (controlled by a peristaltic pump) of the prepared CS solution (3%, w/v) into an aqueous solution of 2.5 M NaOH (100 mL) with continuous magnetic stirring. After 30 min, the CS hydrogel beads obtained were washed several times with deionized water.
The neutral CS hydrogel beads were poured into 100 mL of deionized water, and then, 1 mL of GA was added into the system. After stirring for two hours, the CS–GA hydrogel beads obtained were washed three times with deionized water and washed once with ethanol. Finally, a vacuum freeze-drying method was applied for 12 hours to obtain the CS–GA aerogel beads.
2.3 Synthesis of CS–GA–PEI beads
The neutral CS hydrogel beads that were synthesized using the previous method were poured into 100 mL of deionized water, and then, 0.5 g of PEI was added into the system. After one hour, 1 mL of GA was added into the system with continuous stirring. After two hours, the CS–GA–PEI hydrogel beads obtained were washed with deionized water and ethanol. The vacuum freeze-drying was applied uniformly to obtain CS–GA–PEI aerogel beads. The preparation process of CS–GA–PEI aerogel beads is presented in Scheme 1.
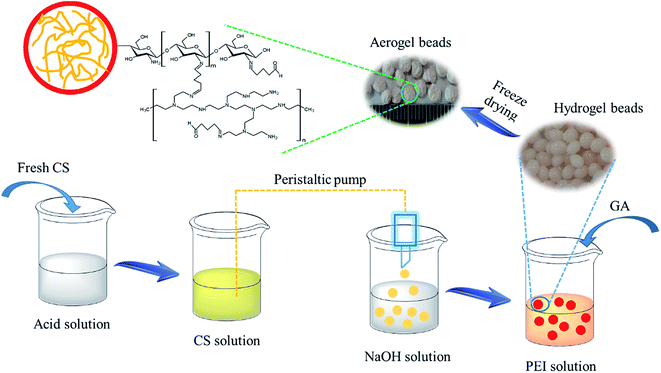 |
| | Scheme 1 Schematic demonstration of the preparation process of the CS–GA–PEI aerogel beads. | |
2.4 Synthesis of CS/PEI–GA beads
Firstly, a mixed CS/PEI solution was prepared by dissolving 0.75 g of CS and 0.5 g of PEI into 25 mL of a 5.0% aqueous solution (w/w) of glacial acetic acid with stirring. The CS/PEI hydrogel beads were obtained by the addition of the prepared mixture into a 2.5 M aqueous solution of NaOH (100 mL) with continuous magnetic stirring. After 30 min, the hydrogel beads obtained were washed several times with deionized water.
The synthesized CS/PEI hydrogel beads were added into 100 mL of deionized water, and 1 mL of GA was added into the beaker at the same time. After stirring for two hours, the CS/PEI–GA hydrogel beads obtained were washed several times with deionized water and once with ethanol. In addition, as for the CS–GA–PEI aerogel beads, a similar treatment method was applied to obtain the CS/PEI–GA aerogel beads.
2.5 Adsorption experiments in a batch system
During the testing process, 1.413 g of K2Cr2O7 was dissolved in 1000 mL of deionized water to prepare the Cr(VI)-containing stock solution at a concentration of 500 mg L−1. The stock solution was diluted to the specific concentrations that were required in the next experiments. To determine the effect of pH, the initial Cr(VI) concentration, contact time, coexisting ion competition, and reusability were tested in a batch method. All the batch adsorption experiments were performed with magnetic stirring at a speed of 160 rpm. Solutions of 0.5 M HCl and 0.5 M NaOH were used to determine the effect of pH in the range of 2.0–9.0. The amount of Cr(VI) that was removed onto the adsorbent materials was calculated using the following formulae:30| |
 | (1) |
| |
 | (2) |
| |
 | (3) |
where C0, Ct and Ce are the concentration of Cr(VI) ions at the initial condition (mg L−1), at time t (mg L−1) and at equilibrium state (mg L−1), respectively. V, m and R represent the mass of adsorbent (g), the volume of the solution (mL) and the removal efficiency (%), respectively. In addition, qe is the equilibrium adsorption capacity of adsorbent in solution (mg g−1), and qt is the adsorption capacity of the adsorbent at time t (mg g−1).
Kinetic experiments were conducted at pH 2.0 with Cr(VI) solution (100 mg L−1) at set time periods. Pseudo-first-order [eqn (4)] and pseudo-second-order models [eqn (5)] were applied to investigate the adsorption kinetics of the adsorption process and these are expressed as:20
| |
 | (5) |
where
k1 (min
−1) and
k2 (g mg
−1 min
−1) are the rate constants of pseudo-first-order and pseudo-second-order adsorptions, respectively.
For the adsorption isotherm tests, the adsorption of Cr(VI) was continued for 24 h at pH 2.0 and carried out with initial concentrations ranging from 75 to 500 mg L−1. Langmuir and Freundlich adsorption isotherm models were utilized to determine the experimental adsorption data and study the adsorption mechanism. The nonlinear equations for the Langmuir isotherm model [eqn (6)] and the Freundlich isotherm model [eqn (7)] are:31
| |
 | (6) |
where
b (L mg
−1) is the equilibrium constant related to adsorption energy, and
qm (mg g
−1) is the maximum adsorption capacity.
where
KF and
n are the Freundlich constants related to adsorption capacity and adsorption intensity, respectively.
2.6 Fixed bed column studies
Continuous fixed-bed adsorption experiments were carried out in this research using a glass column with a height of 80 mm and internal diameter of 12 mm, which was filled with the CS–GA–PEI bead adsorbent (0.346 g). The initial concentration of Cr(VI) ions was 50 mg L−1 at pH 2.0 and the input flow rate was 1 mL min−1, 2 mL min−1 and 3 mL min−1 controlled by a peristaltic pump. The concentration of the effluent solution was recorded using an ultraviolet-visible (UV-vis) spectrometer after suitable time intervals until the time when Ct/C0 = 95%.
The total mass of Cr(VI) adsorbed, qtotal (mg), can be calculated as follows:
| |
 | (8) |
where
C0 (mg L
−1) and
Ct (mg L
−1) are the concentration of the ions in the feeding solution and effluent solution at time
t, respectively.
Q (mL min
−1) is the flow rate of the solution, and
t (min) is the total flow time.
The equilibrium adsorption capacity, qe, of the CS–GA–PEI beads for Cr(VI) can be calculated as follows:
| |
 | (9) |
where
m (g) is the mass of the total adsorbents in the column.
The Thomas model [eqn (10)] and the Adams–Bohart model [eqn (11)] were used to analyze the breakthrough curves:32
| |
 | (10) |
| |
 | (11) |
where
KT (mL min
−1 mg
−1) and
KAB (mL min
−1 mg
−1) belong to the constant of the Thomas model and the Adams–Bohart model, respectively.
q0 (mg g
−1) is the adsorption capacity of the adsorbent.
N0 (mg mL
−1) is the saturation concentration and
Z (cm) is the bed depth of the column.
F (cm min
−1) is the linear velocity calculated by dividing the flow rate by the column section area.
2.7 Desorption and regeneration
For the cyclical desorption and regeneration experiments, the original concentration of Cr(VI) was 100 mg L−1. In addition, other conditions were the same when compared with other adsorption experiments. After running the adsorption process for 24 h, the Cr-loaded CS–GA, CS–GA–PEI and CS/PEI–GA beads were washed with deionized water, and then, 50 mL of eluent (0.2 M NaOH) was added to the system for 2 h. After each cycle, regenerated CS–GA, CS–GA–PEI and CS/PEI–GA beads were washed with deionized water and then freeze-dryed before being reused. The regeneration performance of the adsorbents was tested five times for each one.
2.8 Characterization
Field-emission-scanning electron microscopy (FE-SEM; Jeol, Japan) was used to survey the surface images and morphology of the synthesized materials. Fourier transform-infrared spectrophotometry (FT-IR; Shimadzu, Japan) was used to determine the chemical bands of the corresponding materials in the range of 4000–400 cm−1 with potassium bromide pellets. X-ray photoelectron spectroscopy (XPS) measurements were carried out using an Axis spectrometer (Kratos) equipped with Al-Kα radiation. The surface areas and pore diameter of the adsorbents were obtained using an ASAP 2020 (Micromeritics, USA) with a nitrogen (N2) adsorption–desorption method at 77 K. The ions' concentration was obtained using a UV-vis spectrometer (Shimadzu, Japan) the corresponding calculation formula.
3. Results and discussion
3.1 Characterization of materials
Fig. 1a, c and e show the electronic images of the CS–GA, CS–GA–PEI, and CS/PEI–GA beads. The inset images are the CS–GA, CS–GA–PEI, and CS/PEI–GA hydrogel beads, respectively. We can observe that these beads are about 3 mm in diameter and their colors are white, light red and beige. Compared with CS–GA and CS–GA–PEI, it is obvious that parts of prepared CS/PEI–GA beads have broken up in the crosslinking process, for which the most likely reason is that the GA does not completely enter the inside of CS/PEI complex hydrogel beads. The microscopic morphologies of the three adsorbents were characterized by using FE-SEM and the results are shown in Fig. 1b, d and f. Among these, CS–GA–PEI exhibited an ideal microscopic three-dimensional network structure compared to CS–GA, and CS/PEI–GA. Clearly, this obvious network structure might be helpful for increasing the adsorption capacity for heavy metal ions from aqueous solutions.
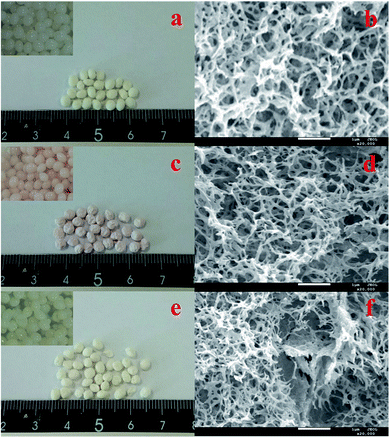 |
| | Fig. 1 Optical microscopy images of (a) CS–GA, (c) CS–GA–PEI, (e) CS/PEI–GA beads, and the inset images are the equivalent hydrogel beads before freeze-drying. (b), (d) and (f) are the FE-SEM images of three different beads, respectively. | |
Fig. 2 shows the FT-IR spectra of CS, CS–GA–PEI and CS–GA–PEI–Cr. In the spectrum of the initial CS (Fig. 2a), the peak at 3434 cm−1 was because of the stretching vibration of –NH and –OH bands, and the peaks at 2920 and 2874 cm−1 (between 2800 and 3000 cm−1) were attributed to the stretching vibration of the unsaturated C–H band.33,34 The two bands at 1660 and 1603 cm−1 represent bending vibrations of the free amine and acetylated amine, respectively, indicating that the fresh CS is not fully deacetylated. The bands at 1157 cm−1 and 1083 cm−1 came from the symmetric stretching of the bridge C–O–C and the skeletal C![[double bond, length as m-dash]](https://www.rsc.org/images/entities/char_e001.gif) O stretching.35 More importantly, the peak at 1645 cm−1 shown in Fig. 2b could be attributed to the stretching vibration of the C
O stretching.35 More importantly, the peak at 1645 cm−1 shown in Fig. 2b could be attributed to the stretching vibration of the C![[double bond, length as m-dash]](https://www.rsc.org/images/entities/char_e001.gif) N band that generated by Schiff base reaction or Michael addition reaction between the amine groups from CS or PEI and the carboxyl from GA, which indicated that CS was successfully modified with PEI.
N band that generated by Schiff base reaction or Michael addition reaction between the amine groups from CS or PEI and the carboxyl from GA, which indicated that CS was successfully modified with PEI.
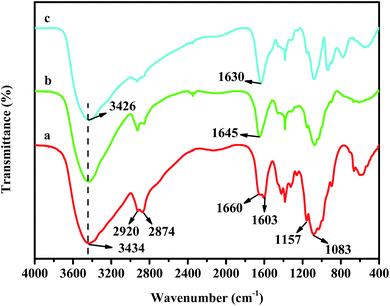 |
| | Fig. 2 FT-IR spectra of (a) fresh CS, (b) CS–GA–PEI and (c) CS–GA–PEI beads after adsorption. | |
Fig. S1 [ESI†] shows the N2 adsorption–desorption isotherms of CS–GA, CS–GA–PEI and CS/PEI–GA beads. These three types of adsorption materials show the obvious type-IV curves with hysteresis loops, clearly proving that these samples are porous materials with developed mesopores. As is shown in Table S1 (ESI†), the surface areas of CS–GA, CS–GA–PEI and CS/PEI–GA were 59.4, 13.7 and 23.0 m2 g−1, respectively. The average pore diameters of these three different adsorbents were approximately 19.5, 22.7 and 3.8 nm, respectively. Taking these results together, the ones of CS–GA–PEI show that it can be considered as a potential adsorbent with favorable textural characteristics.
3.2 Effect of pH on adsorption
The different pH values of a solution cannot only influence the form in which the Cr(VI), exists, but can also affect the adsorption capacity of the adsorbents. The results of Cr(VI) adsorption using adsorbents with the original Cr(VI) concentration of 100 mg L−1 are shown in Fig. 3. As the pH increases from 2.0 to 9.0, the removal rates of CS–GA, CS–GA–PEI, and CS/PEI–GA decreased from 93.42%, 96.34%, 95.34% to 13.48%, 26.09%, 14.18%, respectively, and the highest removal capacity was appeared at pH 2.0. Similarly, compared to CS–GA and CS/PEI–GA, CS–GA–PEI always showed the best adsorption capacity under same pH testing conditions. According to these reports, the main form of Cr(VI) is CrO42− when the pH is greater than 6.5 and the main form would change to HCrO4− while the pH < 6.5 in solution.36 Compared with CrO42−, HCrO4− is more likely to adsorb on the surface active sites because of the low adsorption free energy. When the solution is alkaline, the existence of OH− would also compete with CrO42− for the limited active sites, and lead to an obvious decrease for the adsorption capacity. In a similar way, in the acidic system, the protonated active sites would have a higher adsorption capacity because of the electrostatic attraction for Cr(VI). In conclusion, the acidic condition is effective for the removal of Cr(VI).37
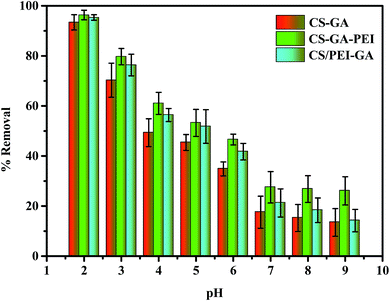 |
| | Fig. 3 Effect of pH on the adsorption of Cr(VI) onto CS–GA, CS–GA–PEI and CS/PEI–GA beads (adsorbent dose: 20 mg, volume: 20 mL, initial Cr(VI) concentration: 100 mg L−1, contact time: 24 h and temperature: 298 K). | |
3.3 Adsorption kinetics
One of the critical parameters for wastewater treatment, the adsorption kinetics were determined and their nonlinear fits and kinetic parameters are shown in Fig. S2 (ESI†) and Table 1 for the three adsorbents. From Fig. S2 (ESI†), it is clearly revealed that the adsorption equilibrium time was at 240 min for CS–GA, CS–GA–PEI, CS/PEI–GA beads for the adsorption of Cr(VI) (100 mg L−1). In addition, the equilibrium sorption capacity of CS–GA, CS–GA–PEI, CS/PEI–GA beads in 100 mg L−1 Cr(VI) solutions were 94.2, 99.9, 96.3 mg g−1, respectively. It was clear, that CS–GA–PEI exhibited a higher removal capacity than CS–GA and CS/PEI–GA beads, which might be associated with the porous network it had developed, making it to be more easily accessible to probe the Cr(VI) ions.
Table 1 Kinetic parameters for the adsorption of Cr(VI) onto different adsorbents
| Different adsorbents |
Kinetic parameters |
| CS–GA |
CS–GA–PEI |
CS/PEI–GA |
| qe,exp (mg g−1) |
94.15 |
99.87 |
96.31 |
![[thin space (1/6-em)]](https://www.rsc.org/images/entities/char_2009.gif) |
| Pseudo-first-order model |
| qe,cal (mg g−1) |
89.596 |
95.337 |
91.605 |
| k1 (min−1) |
0.03513 |
0.06451 |
0.04438 |
| R2 |
0.95609 |
0.97965 |
0.96461 |
![[thin space (1/6-em)]](https://www.rsc.org/images/entities/char_2009.gif) |
| Pseudo-second-order model |
| qe,cal (mg g−1) |
98.478 |
102.107 |
99.608 |
| k2 (g mg−1 min−1) |
0.00053 |
0.00069 |
0.00102 |
| R2 |
0.98941 |
0.99806 |
0.99564 |
Comparing the correlation coefficients (R2) of the kinetic models for the three adsorbent beads, the pseudo-second-order model (R2 > 0.98) exhibited more consistent data than the pseudo-first-order model (R2 < 0.98). It was also observed that the calculated qe data (qe,cal) of the pseudo-second-order model fit the experimental data better. As a general trend, the pseudo-second-order model describes the adsorption process for Cr(VI) better and indicates that the adsorption process is primarily controlled by the chemical interaction between Cr(VI) and the active sites of the adsorbents.38,39
3.4 Adsorption isotherms
Fig. 4 shows the adsorption isotherms of Cr(VI) on CS–GA, CS–GA–PEI and CS/PEI–GA at 298 K. The correlative data of the two isotherm parameters are shown in Table S2 (ESI†). The correlation coefficients (R2) were compared, and the adsorption process fitted better with the Langmuir model than the Freundlich model, suggesting that the adsorption process of Cr(VI) onto the three adsorbents is a monolayer coverage. According to the Langmuir isotherm model, the adsorption capacity of Cr(VI) on the adsorbents was calculated to be 284.6, 402.9 and 363.1 mg g−1 at 298 K, for CS–GA, CS–GA–PEI and CS/PEI–GA, respectively. In the synthesis process of CS/PEI–GA, the CS/PEI compound hydrogel beads which were prepared first were washed several times with deionized water, so the water-soluble PEI could be easily detached from the compound beads, and this would lead to some wastage of PEI then the prepared process of CS–GA–PEI beads. The comparison of adsorption capacity for Cr(VI) ions between CS–GA–PEI and other similar adsorbents in previous reports is shown in Table 2 and clearly demonstrates the superiority of CS–GA–PEI beads for removing Cr(VI) from aqueous solution.
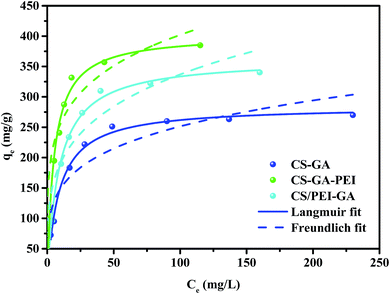 |
| | Fig. 4 Adsorption isotherms of Langmuir and Freundlich models of Cr(VI) onto CS–GA, CS–GA–PEI and CS/PEI–GA beads. | |
Table 2 The comparison of adsorption capacity of various adsorbents for the removal of Cr(VI) at 298 Ka
| Adsorbent |
pH |
qm (mg g−1) |
Ref. |
| MSCG: Fe3O4@SiO2@CS/graphene oxide (GO). |
| Fe3O4–SiO2–CS–PEI microspheres |
2.5 |
236.4 |
27 |
| MSCG microspheres |
2.5 |
233.1 |
28 |
| CS-biochar/γ-Fe2O3 composite |
2.0 |
167.3 |
40 |
| Titanium crosslinked chitosan composite |
5.0 |
171 |
41 |
| CS/GO composite nanofibrous |
2.0 |
310.4 |
42 |
| CS–GA beads |
2.0 |
284.6 |
This work |
| CS–GA–PEI beads |
2.0 |
402.9 |
This work |
| CS/PEI–GA beads |
2.0 |
363.1 |
This work |
3.5 Effect of coexisting ions
In most cases, the wastewater produced from industrial production does not contain Cr(VI) alone, that is, the presence of other cations and anions is highly possible. Considering the presence of electrostatic interactions or other removal mechanisms, it is possible that the anions present in solution would affect the removal ability of Cr(VI).43
Thus, detailed experiments were conducted to study the influence of coexisting anions, such as Cl−, NO3−, SO42−, and PO43− (C0 = 200, 400, 800, 1200 and 2000 mg L−1) on the adsorption process of CS–GA–PEI beads. The influence from four anions with different concentrations is illustrated in Fig. 5, which could be expressed by the following order of the adsorbability: Cl− > NO3− > SO42− > PO43−.
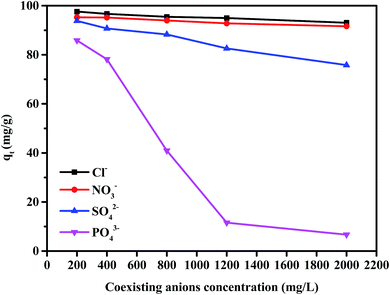 |
| | Fig. 5 The effect of coexisting ions on the CS–GA–PEI beads on Cr(VI) (adsorbent dose: 20 mg, volume: 20 mL, Cr(VI) concentration: 100 mg L−1, contact time: 4 h, and temperature: 298 K). | |
Based on these results, the former three anions had less negative effect on the adsorption process, however, when the concentration of PO43− changed from 200 mg L−1 to 1200 mg L−1, the removal capacity for Cr(VI) rapidly decreased from 85.9 to 11.6 mg g−1. When the PO43− concentration increased continually, the qt showed a slow decrease. Competition mechanism can be used to account for these results. Of the four types of ions, Cl−, NO3− are monovalent anions, and SO42−, PO43− are multivalent ions. This would produce a small competition with the HCrO4− for the efficient active sites on the CS–GA–PEI by the monovalent ions. In comparison, there is a more obvious competitive effect with the chromium anions from the multivalent anions on the adsorbents.
The trivalent PO43− cannot exist stably in the experimental condition. It could produce HPO42− and OH− through the hydrolytic process, thus, the system pH would increase from 2.0 to a larger value, resulting in an obvious effect for the adsorbed capacity. Notably, the graphical trend is similar to the effect of pH that was described in Fig. 3.
3.6 Fixed-bed column studies
The breakthrough curves of the CS–GA–PEI beads for removing Cr(VI) with different flow rates are shown in Fig. 6, and the corresponding parameters from the fitted models and calculations are summarized in Table 3. It is shown that the breakthrough time (tb, Ct/C0 = 10%) changed from 10 min to 6 min when the flow rate increased from 1 to 3 mL min−1. The same conclusion could be obtained from the flow rate and exhaustion time (te, Ct/C0 = 95%). In addition, the Cr(VI) ions' adsorption capacity was 214.1, 110.4 and 71.8 mg g−1 at the flow rate for 1.0, 2.0 and 3.0 mL min−1, respectively. Therefore, it is suitable to choose a lower value as the flow rate for the elimination of heavy metal ions in the practical application.
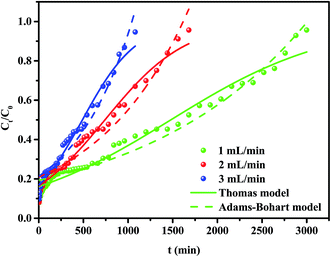 |
| | Fig. 6 Experimental and predicted breakthrough curves (Thomas and Adams–Bohart models) of Cr(VI) adsorption by CS–GA–PEI beads at different flow rates (1 mL min−1, 2 mL min−1 and 3 mL min−1). | |
Table 3 Parameters of the Thomas and Adams–Bohart models determined for Cr(VI) removed by CS–GA–PEI beads in the fixed-bed column
| Flow rate (mL min−1) |
tb (min) |
te (min) |
qe (mg g−1) |
Thomas model constants |
Adams–Bohart model constants |
| KT (L min−1 mg−1) |
q0 (mg g−1) |
R2 |
KAB (mL min−1 mg−1) |
N0 (mg L−1) |
R2 |
| 1 |
10 |
3000 |
214.1 |
2.22 × 10⁻⁵ |
214.61 |
0.9701 |
0.0110 |
16![[thin space (1/6-em)]](https://www.rsc.org/images/entities/char_2009.gif) 875 875 |
0.9587 |
| 2 |
8 |
1680 |
110.4 |
4.4 × 10⁻⁵ |
213.73 |
0.9753 |
0.0193 |
8952 |
0.9392 |
| 3 |
6 |
1080 |
71.8 |
6.58 × 10⁻⁵ |
211.85 |
0.9762 |
0.0296 |
5774 |
0.9478 |
For a better understanding of the column experiment, all the experimental data were applied to fit the Thomas model and the Adams–Bohart model. As is shown in Table 3, the Thomas model is found to be more suitable than the Adams–Bohart model from a comparison of their own R2 values. With the increase of the flow rate, the value of KT increased whereas the value of q0 decreased. This result could be because of the decreased contact time with Cr(VI) and the CS–GA–PEI beads at higher flow rates, and in turn this leads to a lower removal percentage. Thus, the lower flow rate would be more suitable for a higher removal percentage of Cr(VI) onto CS–GA–PEI beads in the column sorption system.
3.7 Desorption and regeneration
In this study, 0.2 M NaOH was used as the eluent. The repeated adsorption/regeneration experiment was carried out for five cycles to compare the recycling properties of the three different adsorbents. After the fifth regeneration, the removal capacity of Cr(VI) by CS–GA–PEI remained at more than 80% of its original capacity (see Fig. 7). As compared to two other different materials, CS–GA–PEI exhibited a sustainable adsorption capacity. The gradually decreased adsorption capacity after each cycle may be attributed to the loss of partial reduction property of adsorbents and the gradual wastage of mass under the continuous adsorption/regeneration circulation processes.37 In brief, the CS–GA–PEI beads could be regenerated easily and could be used in an acid wastewater system which was polluted by Cr(VI).
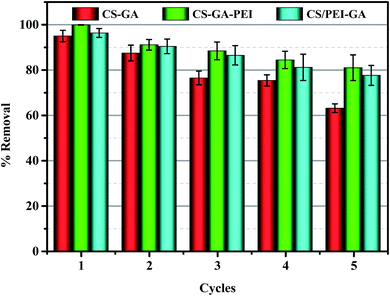 |
| | Fig. 7 Recycling performance over five successive cycles for CS–GA, CS–GA–PEI and CS/PEI–GA beads. | |
3.8 Adsorption mechanisms
In order to verify whether any redox reaction occurred during the adsorption process, the chromium content after adsorption of CS–GA–PEI beads at 298 K and pH 2.0 were measured by different techniques. The concentration of total Cr [including Cr(VI) and Cr(III)] and the Cr(VI) in the solution were measured using inductively coupled plasma optical emission spectroscopy (ICP-OES) and a diphenylcarbazide method through the UV-vis spectrometry. The results are shown in Table 4. Clearly, the concentration of Cr(VI) was below the concentration of total Cr, indicating that the valence of Cr was partly changed and turned to Cr(III) from Cr(VI) after the adsorption process.
Table 4 Chromium contents after adsorption of CS–GA–PEI beads at 298 K and pH 2.0 for different initial concentrations
| C0 (mg L−1) |
100 |
200 |
300 |
400 |
500 |
| Total Cr (mg L−1) |
52.24 |
62.24 |
80.80 |
132.10 |
246.95 |
| Cr(VI) (mg L−1) |
0.17 |
5.23 |
12.63 |
42.96 |
115.17 |
The chemical compositions of CS–GA–PEI and CS–GA–PEI–Cr were measured using XPS to determine the removal mechanism. As shown in Fig. 8a, of the total survey spectrums, the peaks at 577 and 587 eV could be attributed to Cr 2p3/2 and Cr 2p1/2, respectively. Furthermore, the characteristic peaks of C 1s, N 1s and O 1s appeared at the binding energies of 286, 399 and 532 eV, respectively, and the Cr 2p spectrum is shown in Fig. 8b. On the basis of the experimental data, the binding energies of 587.6 and 585.69.7 eV should be assigned to the Cr(VI) and Cr(III) from Cr 2p1/2, respectively, and the 578.5 and 576.8 eV were assigned to Cr(VI) and Cr(III) from Cr 2p3/2, respectively,44 which also indicated the existence of Cr(III) after the adsorption process. Fig. 8c and d show the N 1s spectra of CS–GA–PEI before and after Cr(VI) adsorption. In Fig. 8c, the peaks at 400.68 and 399.78 eV were attributed to –NH– and –N![[double bond, length as m-dash]](https://www.rsc.org/images/entities/char_e001.gif) , respectively.45 As shown in Fig. 8d, the peaks at 400.28, 399.58 and 399.08 eV were attributed to –NH–, –N
, respectively.45 As shown in Fig. 8d, the peaks at 400.28, 399.58 and 399.08 eV were attributed to –NH–, –N![[double bond, length as m-dash]](https://www.rsc.org/images/entities/char_e001.gif) and N–Cr, respectively, after the adsorption process.
and N–Cr, respectively, after the adsorption process.
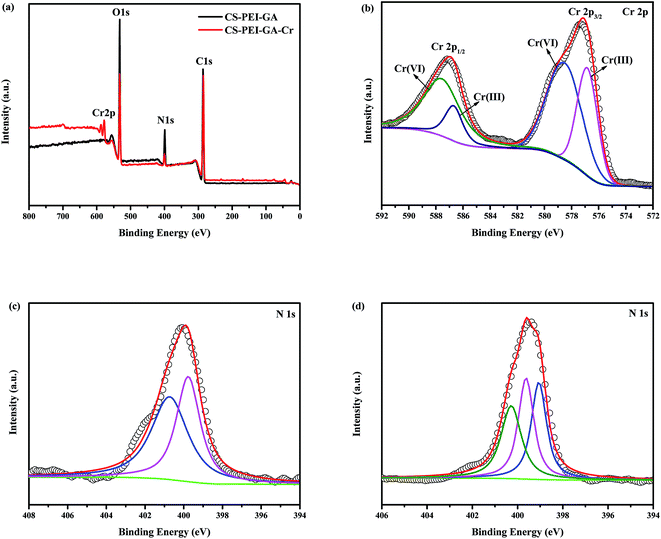 |
| | Fig. 8 XPS total survey spectra (a) of the survey before and after adsorption, (b) Cr 2p peaks, N 1s pattern of (c) before and (d) after adsorption on CS–GA–PEI beads. | |
Comparing the spectrum of Fig. 2b, with the spectrum of Fig. 2c, the C![[double bond, length as m-dash]](https://www.rsc.org/images/entities/char_e001.gif) N groups had a shift from 1645 cm−1 to 1630 cm−1, and the broad band changed from 3434 cm−1 to 3426 cm−1 after Cr(VI) adsorption. These changes indicated the importance of –NH and –OH in the removal process.46
N groups had a shift from 1645 cm−1 to 1630 cm−1, and the broad band changed from 3434 cm−1 to 3426 cm−1 after Cr(VI) adsorption. These changes indicated the importance of –NH and –OH in the removal process.46
The visual removal mechanism for Cr(VI) is shown in Scheme 2. Under acidic conditions, the main form of Cr(VI) in solution is negatively charged HCrO4−, and this could shift to protonated –OH and –NH2 groups under the influence of electrostatic attraction:47,48
| | |
–OH2+ + HCrO4− → –OH2+⋯HCrO4−
| (12) |
| | |
–NH3+ + HCrO4− → –NH3+⋯HCrO4−
| (13) |
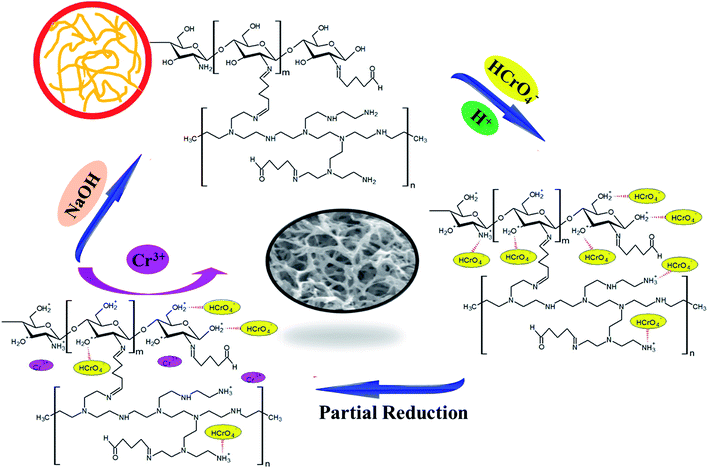 |
| | Scheme 2 The possible Cr(VI) removal mechanisms for CS–GA–PEI beads. | |
In addition, because of the strong reduction ability of C–H and C–OH groups of the adsorbent beads, Cr(VI) was partially reduced to Cr(III) in the adsorption process. It could be thought that some Cr(III) enters into the solution, and meanwhile, some was deposited on the surface of the samples. As a result, this is one of the reasons why the removal efficiency of the adsorbent is gradually shrinking after each cycle in this study. The corresponding relationship is described as follows:49
| | |
–C–H + Cr(VI) + H2O → –C–OH + Cr(III) + H+
| (14) |
| |
–C–OH + Cr(VI) + H2O → –C![[double bond, length as m-dash]](https://www.rsc.org/images/entities/char_e001.gif) O + Cr(III) + H+ O + Cr(III) + H+
| (15) |
| |
–C![[double bond, length as m-dash]](https://www.rsc.org/images/entities/char_e001.gif) O + Cr(VI) + H2O → –COOH + Cr(III) + H+ O + Cr(VI) + H2O → –COOH + Cr(III) + H+
| (16) |
| | |
–C–COOH + Cr(VI) + H2O → –C–H + Cr(III) + H+ + CO2↑
| (17) |
4. Conclusions
In summary, using both molecules enriched with abundant amino groups as starting materials, three types of PEI/CS aerogel beads with a high-density of reactive sorption sites have been synthesized successfully using controllable sol–gel and freeze-drying methods, and then used for the efficient elimination of Cr(VI) from aqueous solutions of acid using batch and column systems. In contrast to another two samples, the CS–GA–PEI beads exhibited the best adsorption effect for Cr(VI) which was demonstrated using various characterization methods and models. Not only is the preparation process of CS–GA–PEI beads simple, but the adsorption capacity (402.9 mg g−1) is also higher than that of reported CS-based adsorbents. Desorption–regeneration analysis displayed reusable features of the CS–GA–PEI beads after five cycles. The column removal studies showed that the Cr(VI) uptake capacity decreased with the increase of flow rate, and the Thomas model fitted the results better than the Adams–Bohart models for the fixed-bed column tests. The adsorption mechanisms prove that the adsorption process for Cr(VI) on CS–GA–PEI beads can be explained by electrostatic interactions and reduction reaction theory. Resulting from the previously mentioned advantages, these types of aerogel bead can be considered as a promising candidate for treat water pollution caused by anionic Cr(VI) ions.
Conflicts of interest
There are no conflicts to declare.
Acknowledgements
Financial support from the National Natural Science Foundation of China (21676039) and the Opening Foundation of State Key Laboratory of Inorganic Synthesis and Preparative Chemistry of Jilin University (2016-04) is kindly appreciated.
References
- A. R. C. Rodríguez, J. Saiz-Poseu, J. García-Pardo, B. García, J. Lorenzo, I. Ojea-Jimenez, D. Komilis, J. Sedo, F. Busque, A. Sanchez, D. Ruiz-Molinab and X. Fonta, RSC Adv., 2016, 6, 40058–40066 RSC.
- X. Zhang, X. Jia, G. Zhang, J. Hu, W. Sheng, Z. Ma, J. Lu and Z. Liu, Appl. Surf. Sci., 2014, 314, 166–173 CrossRef CAS.
- S. Yang, N. Okada and M. Nagatsu, J. Hazard. Mater., 2016, 301, 8–16 CrossRef CAS PubMed.
- S. Liu, B. Huang, L. Chai, Y. Liu, G. Zeng, X. Wang, W. Zeng, M. Shang, J. Deng and Z. Zhou, RSC Adv., 2017, 7, 10891–10900 RSC.
- N. Shevchenko, V. Zaitsev and A. Walcarius, Environ. Sci. Technol., 2008, 42, 6922–6928 CrossRef CAS PubMed.
- N. Daneshvar, D. Salari and S. Aber, J. Hazard. Mater., 2002, 94, 49–61 CrossRef CAS PubMed.
- A. Demir and M. Arisoy, J. Hazard. Mater., 2007, 147, 275–280 CrossRef CAS PubMed.
- A. A. Taha, Y. Wu, H. Wang and F. Li, J. Environ. Manage., 2012, 112, 10–16 CrossRef CAS PubMed.
- Y. Xing, X. Chen and D. Wang, Environ. Sci. Technol., 2007, 41, 1439–1443 CrossRef CAS PubMed.
- C. E. Barrera-Díaz, V. Lugo-Lugo and B. Bilyeu, J. Hazard. Mater., 2012, 223, 1–12 CrossRef PubMed.
- U. Habiba, A. M. Afifi, A. Salleh and B. C. Ang, J. Hazard. Mater., 2017, 322, 182–194 CrossRef CAS PubMed.
- T. Wen, Q. Fan, X. Tan, Y. Chen, C. Chen, A. Xu and X. Wang, Polym. Chem., 2016, 7, 785–794 RSC.
- Y. Pan, P. Cai, M. Farmahini-Farahani, Y. Li, X. Hou and H. Xiao, Appl. Surf. Sci., 2016, 385, 333–340 CrossRef CAS.
- Z. Lei, S. Zhai, J. Lv, Y. Fan, Q. An and Z. Xiao, RSC Adv., 2015, 5, 77932–77941 RSC.
- Y. Fan, S. Zhai, N. Liu, J. Lv, Z. Lei and Q. An, Res. Chem. Intermed., 2016, 42, 869–891 CrossRef CAS.
- Y. Fan, R. Yang, Z. Lei, N. Liu, J. Lv, S. Zhai, B. Zhai and L. Wang, Korean J. Chem. Eng., 2016, 33, 1416–1424 CrossRef CAS.
- W. Zheng, Q. An, Z. Lei, Z. Xiao, S. Zhai and Q. Liu, RSC Adv., 2016, 6, 104897–104910 RSC.
- Y. Yan, Q. An, Z. Xiao, W. Zheng and S. Zhai, Chem. Eng. J., 2017, 313, 475–486 CrossRef CAS.
- M. Aliabadi, M. Irani, J. Ismaeili and S. Najafzadeh, J. Taiwan Inst. Chem. Eng., 2014, 45, 518–526 CrossRef CAS.
- H. Beheshti, M. Irani, L. Hosseini, A. Rahimi and M. Aliabadi, Chem. Eng.
J., 2016, 284, 557–564 CrossRef CAS.
- S. Gao, Z. Yuan, W. Guo, M. Chen, S. Liu, T. Xi and Q. Guo, Mater. Sci. Eng., C, 2017, 71, 891–900 CrossRef CAS PubMed.
- S. Kumar, I. Haq, J. Prakash and A. Raj, Int. J. Biol. Macromol., 2017, 98, 24–33 CrossRef CAS PubMed.
- N. Hu, L. Meng, R. Gao, Y. Wang, J. Chai, Z. Yang, E. S. Kong and Y. Zhang, Nano-Micro Lett., 2011, 3, 215–222 CrossRef CAS.
- R. Karthik and S. Meenakshi, Int. J. Biol. Macromol., 2015, 72, 711–717 CrossRef CAS PubMed.
- L. Xu, L. Yang, M. Luo, X. Ling, X. Wei, J. Zhao and H. Liu, J. Hazard. Mater., 2011, 189, 787–793 CrossRef CAS PubMed.
- X. Tian, W. Wang, Y. Wang, S. Komarneni and C. Yang, Microporous Mesoporous Mater., 2015, 207, 46–52 CrossRef CAS.
- X. Sun, L. Yang, T. Dong, Z. Liu and H. Liu, J. Appl. Polym. Sci., 2016, 133, 43078–43088 Search PubMed.
- X. Sun, Q. Li, L. Yang and H. Liu, Particuology, 2016, 26, 79–86 CrossRef CAS.
- Z. Modrzejewska and W. Kaminski, Ind. Eng. Chem. Res., 1999, 38, 4946–4950 CrossRef CAS.
- R. Verma, A. Asthana, A. K. Singh, S. Prasad and M. B. H. Susan, Microchem. J., 2017, 130, 168–178 CrossRef CAS.
- Y. Pang, G. Zeng, L. Tang, Y. Zhang, Y. Liu, X. Lei, Z. Li, J. Zhang and G. Xie, Desalination, 2011, 281, 278–284 CrossRef CAS.
- Y. Liu, G. Zhong, Z. Liu, M. Meng, Y. Jiang, L. Ni, W. Guo and F. Liu, RSC Adv., 2015, 5, 85691–85704 RSC.
- C. Yuan, J. Zhang, G. Chen and J. Yang, Chem. Commun., 2011, 47, 899–901 RSC.
- C. Gao and G. Chen, J. Mater. Chem. A, 2016, 4, 11299–11306 CAS.
- P. D. Chethan and B. Vishalakshi, Int. J. Biol. Macromol., 2015, 75, 179–185 CrossRef CAS PubMed.
- J. Hu, G. Chen and I. M. C. Lo, Water Res., 2005, 39, 4528–4536 CrossRef CAS PubMed.
- Z. M. Lei, Q. D. An, Y. Fan, J. L. Lv, C. Gao, S. R. Zhai and Z. Y. Xiao, New J. Chem., 2016, 40, 1195–1204 RSC.
- F. Li, X. Wang, T. Yuan and R. Sun, J. Mater. Chem. A, 2016, 4, 11888–11896 CAS.
- R. Yu, Y. Shi, D. Yang, Y. Liu, J. Qu and Z. Z. Yu, ACS Appl. Mater. Interfaces, 2017, 9, 21809–21819 CAS.
- M. Zhang, Y. Liu, T. Li, W. Xu, B. Zheng, X. Tan, H. Wang, Y. Guo, F. Guo and S. Wang, RSC Adv., 2015, 5, 46955–46964 RSC.
- L. Zhang, W. Xia, X. Liu and W. Zhang, J. Mater. Chem. A, 2015, 3, 331–340 CAS.
- H. H. Najafabadi, M. Irani, L. R. Rad, A. H. Haratameh and I. Haririan, RSC Adv., 2015, 5, 16532–16539 RSC.
- L. Deng, Z. Shi and X. Peng, RSC Adv., 2015, 5, 49791–49801 RSC.
- F. Lin, Y. Wang and Z. Lin, RSC Adv., 2016, 6, 33055–33062 RSC.
- A. A. Qaiser, M. M. Hyland and D. A. Patterson, J. Phys. Chem. B, 2011, 115, 1652–1661 CrossRef CAS PubMed.
- X. Huang, Y. Liu, S. Liu, X. Tan, Y. Ding, G. Zeng, Y. Zhou, M. Zhang, S. Wang and B. Zheng, RSC Adv., 2016, 6, 94–104 RSC.
- M. Dakiky, M. Khamis, A. Manassra and M. Mer'eb, Adv. Environ. Res., 2002, 6, 533–540 CrossRef CAS.
- X. Yao, S. Deng, R. Wu, S. Hong, B. Wang, J. Huang, Y. Wang and G. Yu, RSC Adv., 2016, 6, 8797–8805 RSC.
- L. Zhuang, Q. Li, J. Chen, B. Ma and S. Chen, Chem. Eng. J., 2014, 253, 24–33 CrossRef CAS.
Footnote |
| † Electronic supplementary information (ESI) available. See DOI: 10.1039/c7ra06914f |
|
| This journal is © The Royal Society of Chemistry 2017 |
Click here to see how this site uses Cookies. View our privacy policy here.  Open Access Article
 *a,
Zuo-Yi Xiaoa,
Bin Zhaia,
Shang-Ru Zhai
 *a and
Zhan Shi
 b
b


![[double bond, length as m-dash]](https://www.rsc.org/images/entities/char_e001.gif) O stretching.35 More importantly, the peak at 1645 cm−1 shown in Fig. 2b could be attributed to the stretching vibration of the C
O stretching.35 More importantly, the peak at 1645 cm−1 shown in Fig. 2b could be attributed to the stretching vibration of the C![[double bond, length as m-dash]](https://www.rsc.org/images/entities/char_e001.gif) N band that generated by Schiff base reaction or Michael addition reaction between the amine groups from CS or PEI and the carboxyl from GA, which indicated that CS was successfully modified with PEI.
N band that generated by Schiff base reaction or Michael addition reaction between the amine groups from CS or PEI and the carboxyl from GA, which indicated that CS was successfully modified with PEI.![[thin space (1/6-em)]](https://www.rsc.org/images/entities/char_2009.gif)
![[thin space (1/6-em)]](https://www.rsc.org/images/entities/char_2009.gif)


![[thin space (1/6-em)]](https://www.rsc.org/images/entities/char_2009.gif) 875
875![[double bond, length as m-dash]](https://www.rsc.org/images/entities/char_e001.gif) , respectively.45 As shown in Fig. 8d, the peaks at 400.28, 399.58 and 399.08 eV were attributed to –NH–, –N
, respectively.45 As shown in Fig. 8d, the peaks at 400.28, 399.58 and 399.08 eV were attributed to –NH–, –N![[double bond, length as m-dash]](https://www.rsc.org/images/entities/char_e001.gif) and N–Cr, respectively, after the adsorption process.
and N–Cr, respectively, after the adsorption process.
![[double bond, length as m-dash]](https://www.rsc.org/images/entities/char_e001.gif) N groups had a shift from 1645 cm−1 to 1630 cm−1, and the broad band changed from 3434 cm−1 to 3426 cm−1 after Cr(VI) adsorption. These changes indicated the importance of –NH and –OH in the removal process.46
N groups had a shift from 1645 cm−1 to 1630 cm−1, and the broad band changed from 3434 cm−1 to 3426 cm−1 after Cr(VI) adsorption. These changes indicated the importance of –NH and –OH in the removal process.46![[double bond, length as m-dash]](https://www.rsc.org/images/entities/char_e001.gif) O + Cr(III) + H+
O + Cr(III) + H+
![[double bond, length as m-dash]](https://www.rsc.org/images/entities/char_e001.gif) O + Cr(VI) + H2O → –COOH + Cr(III) + H+
O + Cr(VI) + H2O → –COOH + Cr(III) + H+


