
 Open Access Article
 This Open Access Article is licensed under a
 Creative Commons Attribution 3.0 Unported Licence
Occurrence and attenuation of pharmaceuticals and their transformation products in rivers impacted by sewage treatment plants†
Daoping Zhaa,
Ying Li *a,
Li Wangb,
Cunman Yanga and
Guanghua Lua
*a,
Li Wangb,
Cunman Yanga and
Guanghua Lua
aKey Laboratory of Integrated Regulation and Resource Development on Shallow Lakes, Ministry of Education, College of Environment, HoHai University, Nanjing, Jiangsu Province 210098, China. E-mail: hj6688@hhu.edu.cn; Tel: +86-25-83786696
bJiangsu Province Hydrology and Water Resources Investigation Bureau, Nanjing, Jiangsu Province 210029, China
First published on 22nd August 2017
Abstract
Pharmaceuticals and their transformation products (TPs) have been generally detected in the aquatic environment. They threaten human health and increase environmental risk, but knowledge on their fate and attenuation in environmental ecosystems is still lacking. In this study, 13 parent pharmaceuticals and 8 of their TPs in wastewater containing rivers were investigated. We detected all of the compounds except carboxyibuprofen and sulfacetamide in at least one site in all sampling points and found that sewage treatment plants were the principal source of these substances. The majority of parent pharmaceuticals were attenuated in Yangtze River and Qinhuai River, but only a small number were attenuated in the Yunliang River. All detected TPs except 4-chlorobenzoic acid were attenuated in the three rivers. Photodegradation, sorption to sediments, and biotransformation may be important attenuation processes for these substances. We found the largest extent of attenuation in the Yangtze River, where conditions for attenuation were most favorable. Extents of attenuation values for some substances obtained by active and passive sampling were roughly the same; thus, using a polar organic chemical integrative sampler may be an appropriate method for determining the extent of attenuation of organic micropollutants in rivers.
Introduction
With the increasing severity of aquatic system pollution, pharmaceuticals have become recognized as emerging contaminants. These compounds have prompted attention around the world because of their unpredictable ability to disrupt ecosystems and human health.1–3 Even at very low levels, they can have effects on the environment.4,5 They are released into rivers and streams via wastewater from sewage treatment plants (STPs), agricultural activity, and animal husbandry.4,6 The inappropriate treatment of pharmaceuticals leads to their continuous input into aquatic systems. As a result, a multitude of pharmaceuticals at nanogram-per-liter to microgram-per-liter levels have been detected in surface water, groundwater, and even in drinking water.7–10 Moreover, the transformation products (TPs) of pharmaceuticals by microorganisms under natural conditions are present in aquatic environments. In aquatic environments, some TPs may form at higher concentrations or may be more toxic compared with their parent compounds.11–13 Studies have shown that pharmaceuticals and some of their TPs can be toxic to organisms, posing a threat to ecosystems and human health through food-chain transmission and enrichment.12,14 After entry of these pharmaceuticals and their TPs into the aquatic environment, they flow downstream with the water and eventually undergo absorption and degradation, resulting in their attenuation.Knowledge about the attenuation of pharmaceuticals and other polar micropollutants in rivers and streams has increased,15–17 but information on the attenuation of their TPs remains limited, despite the growing number of TPs that have been detected.18,19 The majority of research into the attenuation of pharmaceuticals has been done under laboratory conditions because of the complexity of actual environmental conditions. Since application of simulation results under laboratory conditions to actual environments is limited, further research is needed to prove the feasibility of the experimental results. The attenuation of pharmaceuticals and their TPs in rivers is affected by numerous factors. Processes related to such attenuation may depend in part on water quality parameters of the rivers, such as water velocity, dissolved oxygen levels, total suspended solid concentration, temperature, and pH.16,20 Furthermore, studies have shown that cation exchange capacity, complexation, and hydrogen bonding can affect attenuation.21 These substances undergo physical (dilution and volatilization), chemical (adsorption and photolysis), and biological processes (uptake and accumulation) as they are transported downstream, leading to changes in their concentrations.20,22 Many approaches to calculating the attenuation of these substances have been developed. These include relative attenuation (RA),13,15 in situ attenuation16,22 and comparable model-based approach.20 The attenuation was evaluated by using first-order kinetic for latter two approaches, but tracer study was essential in order to determine travel time. While relative attenuation was calculated by using concentration of compounds between two sites. Such calculation is still significant in the assessment of attenuation of pharmaceuticals and their TPs in aquatic environments.
In studies on the fate of polar organic micropollutants in aquatic environments, samples were typically collected using active sampling. It is cost and labor intensive to collect and analyze large numbers of samples. Polar organic chemical integrative samplers (POCIS) as a complementary approach can obtain time-weighted average (TWA) concentration of these contaminants in the aquatic environment during a specific period. In addition, POCIS do not require a power supply in the field and are flexible enough to be deployed at sites that are difficult to access. POCIS have been successfully used for monitoring a various of polar organic pollutants, such as polar pharmaceuticals, endocrine disrupting compounds and pesticides.23–25
In this study, we assessed the occurrence and attenuation of 13 pharmaceuticals and 8 TPs in rivers downstream of 3 STPs. We observed the variability of concentration and attenuation of the different pharmaceuticals. Because of the convenience and economy of using POCIS, our main objective was to explore the feasibility of using a POCIS in studying the attenuation of these substances. Simultaneously, we compared the attenuation rates of the pharmaceuticals and their TPs in the three rivers, and we analyzed the effects of different river characteristics on attenuation. Our study provides a theoretical basis for determining the attenuation of these substances in rivers.
Material and methods
Reagents and materials
Details of all reagents and materials are provided in the ESI.† The physical and chemical properties of all target compounds are shown in Table 1.| Chemical | MFa | MWb | log![[thin space (1/6-em)]](https://www.rsc.org/images/entities/char_2009.gif) Kowc Kowc |
pKad |
|---|---|---|---|---|
| a MF refer to molecular formula.b MW refer to molecular weight (g mol−1).c Kow refer to octanol–water partition coefficient.d pKa refer to acid dissociation constant.e Substances are TPs. | ||||
| Acetaminophen (ACE)e | C8H9NO2 | 151.16 | 0.46 | 9.46 |
| Phenacetin (PHE) | C10H13NO2 | 179.22 | 1.58 | 5.20 |
| Antipyrine (ATP) | C11H12N2O | 188.22 | −1.55 | 1.40 |
| Bezafibrate (BZB) | C19H20ClNO4 | 361.83 | 3.99 | 3.83 |
| 4-Chlorobenzoic acid (4-CBA)e | C7H5ClO2 | 156.57 | 2.23 | 4.07 |
| Clofibric acid (CA) | C10H11ClO3 | 214.64 | 2.90 | 3.37 |
| Carbamazepine (CBZ) | C15H12N2O | 236.27 | 2.77 | 7.00 |
| Carbamazepine 10,11-epoxide (CBZE)e | C15H12N2O2 | 252.27 | 2.58 | 5.13 |
| Diclofenac acid (DCF) | C14H11Cl2NO2 | 296.15 | 4.51 | 4.06 |
| 4-Hydroxydiclofenac acid (4-OHDCF)e | C14H11Cl2NO3 | 312.15 | 3.96 | 3.76 |
| Ibuprofen (IPF) | C13H18O2 | 206.28 | 3.97 | 4.85 |
| 2-Hydroxy ibuprofen (2-OHIPF)e | C13H18O3 | 222.28 | 2.37 | 4.63 |
| Carboxy ibuprofen (CIPF)e | C13H16O4 | 236.26 | 2.78 | 3.97 |
| Nifedipine (NP) | C17H18N2O6 | 346.34 | 2.2 | <3.50 |
| Naproxen (NPX) | C14H14O3 | 230.26 | 3.18 | 4.15 |
| 1-Naphthol (1-NT) | C10H8O | 144.17 | 2.66 | 9.60 |
| Sulfadiazine (SDZ) | C10H10N4O2S | 250.27 | −0.34 | 2.00/6.48 |
| Sulfacetamide (STM)e | C8H10N2O3S | 214.23 | −0.96 | 5.40 |
| Sulfathiazole (ST) | C9H9N3O2S2 | 255.31 | 0.05 | 2.32/7.24 |
| Sulfamethoxazole (SMZ) | C10H11N3O3S | 253.27 | 0.89 | 1.39/5.70 |
| N4-Acetyl sulfamethoxazole (NAST)e | C12H13N3O4S | 295.31 | 0.86 | 0.38/5.90 |
The POCIS consists of 200 mg of Oasis HLB sorbent sandwiched between polyether sulfone (PES) membranes (0.1 μm pore size, 47 mm diameter, Lu Na Sheng Bio Technology Company, China) locked with two Plexiglas flanges. The filler was washed with methanol and ultrapure water before use. All parts of the POCIS were soaked in methanol, rinsed with ultrapure water, and then finally packed with aluminum foil.
Study sites and river characteristics
Field experiments were performed at four rivers affected by STP effluents in Nanjing, China. The four rivers were Jinchuan (JC) River and Yangtze (YZ) River, which are affected by northern city (NC) STP; Qinhuai (QH) River, which is impacted by science park STP; and Yunliang (YL) River, which is affected by eastern city STP. For the JC River and YZ River, water was sampled at five different locations: the STP effluent itself (N2); 200 m upstream of the STP outfall (N1); 500 m downstream of the STP outlet (N3), which converge with the YZ River; and at two locations at distances of 2000 m (N4) and 4100 m (N5) from N3. Therefore, the attenuation in the JC River at short distances was not computed. Five sampling points in the QH River were selected: the STP effluent itself (S2); 100 m upstream of the convergence of sewage outflow and the QH River (S1, sewage flows into the QH River at 250 m); and three points at distances of 200 m (S3), 1200 m (S4), and 3500 m (S5) from convergence. Water samples from the YL River were collected at four sampling sites: 100 m downstream of the STP outfall (E2), 200 m upstream of the outfall (E1), and at two sites 2000 m and 3000 m from E2. A detailed map of the sampling sites is given in Fig. 1. The water quality parameters of the four studied rivers were considerably different (Table 2). | ||
| Fig. 1 Sampling locations in the studied rivers (JC, YZ, QH and YL river) marking the STPs. Sampling sites are digitally marked along the river flow direction. | ||
| a Average values was obtained from three measurements located in the middle of the study area.b Mean and standard deviation were calculated from the values at points N1 and N2 for JC river, N3 and N5 for YZ river, S3 and S5 for QH river, E2 and E4 for YL river. | ||||
|---|---|---|---|---|
| River name | Jinchuan (JC) | Yangtze (YZ) | Qinhuai (QH) | Yunliang (YL) |
| STP | North city (NC) | North city (NC) | Science park (SP) | East city (EC) |
| Mean velocitya (m s−1) | 0.244 | 1.205 | 0.25 | 0.21 |
| Temperatureb (°C) | 15.8 ± 0.6 | 16 ± 1.0 | 11.7 ± 0.7 | 16.8 ± 0.3 |
| pHb | 7.2 ± 0.13 | 7.9 ± 0.24 | 7.7 ± 0.1 | 7.49 ± 0.3 |
| Dissolved oxygenb (mg L−1) | 7.16 ± 0.3 | 8.77 ± 0.4 | 8.73 ± 0.4 | 5.17 ± 0.2 |
| Electrical conductivityb (μS cm−1) | 590 ± 19 | 600 ± 40 | 404 ± 28 | 496 ± 55 |
| Total suspended solidsb (mg L−1) | 13.6 ± 3.5 | 214 ± 53 | 41.2 ± 10 | 19.1 ± 2.2 |
| Sampling period | 2016/11/05–2016/11/12 | 2016/11/05–2016/11/12 | 2016/11/26–2016/12/02 | 2016/12/16–2016/12/23 |
Sampling methods
Extraction methods
:50 methanol/water (v/v) solution. The new eluent was filtered into a brown 1.5 mL chromatography bottle using a 0.22 μm hydrophilic polytetrafluoroethylene syringe filter prior to analysis.Analytical methods
Analysis of all target compounds was performed on an ultraperformance liquid chromatography system (Waters Acquity UPLC, USA) coupled to a triple quadrupole mass spectrometer (Waters AcquityXevo TQ) with electrospray ionization (ESI). An ultraperformance liquid chromatograph equipped with a Waters BEH C18 column (2.1 × 100 mm, 1.7 μm particle diameter) was used for chromatographic separation, and the column temperature was maintained at 40 °C. The target compounds were analyzed by gradient elution at a flow rate of 0.4 mL min−1 and injection volume of 5 μL. A 98:2 (v/v) water/methanol solution (phase A) and methanol solution (phase B), both containing 0.05% formic acid, were used as mobile phases for positive-ion mode; mobile phases of 98:2 (v/v) water/methanol solution with 5 mM ammonium acetate (phase A) and acetonitrile (phase B) were used for negative ion mode. Details of the gradient for the mobile phase and the acquisition parameters for mass spectrometry are given in Table S1 and S2 (ESI†).
Quality assurance and quality control
Recovery experiments of all of the target compounds in top water and river water were performed by spiking samples to different levels. Recoveries of target compounds in top water (with concentration of 10 and 100 ng L−1) were at a satisfactory range of between 62.4 (NP) and 135.36% (4-OHDCF) (Table S3†) and recoveries in river water (with concentration of 100 ng L−1) ranged from 48% for 4-CBA to 126.5% for IPF (Fig. S1†). Recoveries were computed by comparing the concentrations measured in the sample after the extraction process with the initial spiked level. The concentrations measured in the sample were determined by using internal sample calibration. Blank control experiments containing only the internal standard were analyzed; here, no target substances were detected. For passive sampling during POCIS deployment in the field, unexposed blank POCISs (n = 3) wrapped with aluminum foil were placed in the refrigerator, and analysis was performed when the field exposure experiment was finished. Moreover, the blank filler (HLB, 200 mg) was analyzed in order to determine background concentration of each target compound. In addition, the solvent blank was analyzed. None of the target compound was detected in the blanks. For active sampling, analogous blank experiments were done and no target substance was detected.Limits of detection and limits of quantification (LOQ), defined as the lowest concentrations corresponding to signal-to-noise ratios of 3 and 10, respectively (Table S3†), were determined. The standard deviations from the recovery experiments were <14%.
Calculations of attenuation rate
The attenuation rates of pharmaceutical and their TPs along the river indicate their concentration changes relative to a compound, which can remain for long periods in the aquatic environment.15 This means that concentrations at the downstream site compared to the upstream site are expected to be equal for persistent compounds or lower for substances affected by loss processes. We used CBZ, a compound that is widely detected in sewage and has a long half-life in aquatic systems.28,29 The RA value of a substance was computed by dividing its concentration at site 2 by the concentration at site 1. The ratio was then normalized by the concentration ratio of CBZ at both sites and finally multiplied by 100%. A positive value indicates that the pharmaceutical is attenuated along the river, whereas a negative value indicates an increase in concentration. A value equal to zero indicates that the substance is persistent or that its attenuation rate is approximately equal to its rate of production. The RA (%) was calculated as follows:13,15,30
 | (1) |
For the attenuation of substances on the POCIS, because of the concentration from POCIS is calculated by the formula, and require calibration of the POCIS. Moreover, calibration results depend on the hydrological conditions of the river. Therefore, we computed the RA of the compound from the POCIS by considering its enrichment in the POCIS. This method does not need calibration of the POCIS, and it assumes that the uptake kinetics of analytes at the two sites is the same.
Results and discussion
Occurrence of pharmaceuticals and their TPs in the four rivers
Among the target compounds, CIPF and STM were not detected in all sampling sites; hence, they are not discussed here. Twelve target compounds were detected at all sampling sites in the four rivers. NP was the only one that was detected in sampling site N2, which was the outlet of NC STP. This result implies that NP is derived only from STP. CA, ST, NPX, and DCF were not detected in the QH River, but DCF and NPX were detected at the STP outlet. Concentrations of all analytes that were detected at sites 1 and 2 are shown in Fig. 2, and concentrations of the detected substances at all sites are listed in Table S4 (ESI†). In general, the JC River and YZ River, which were affected by NC STP, had a high concentration of target compounds. After all, NC STP has a dense population around it, a majority of pharmaceuticals caused by people were transported to the STP, so that the STP discharges a large amount of wastewater containing high concentrations of contaminants; concentrations of the detected compounds at N2 ranged from 0.68 ng L−1 (CA) to 544.0 ng L−1 (CBZE). Moreover, the concentrations of DCF, CBZ, and IPF were essentially the same as those in a study by Liu et al.,26 who analyzed concentrations of these substances downstream of the NC STP outlet. Upstream of the NC STP outlet, most of the compounds were detected at high concentrations, with some even higher than the outlet concentration (such as ACE, IPF, SMZ, NAST). Besides the effluent from STP, the site located upstream is also a source of these substances. For the YZ River, the analyte concentrations at site 1 (N3) ranged from 1.1 ng L−1 (CA) to 448.0 ng L−1 (CBZE). NP and 1-NT were not detected there, but they were detected in the JC River. The concentration of the majority of these substances in the outlet of the QH River was substantially lower than that at the NC STP outlet. The highest concentration detected was 124.0 ng L−1 for ACE; 4-OHDCF reached the lowest concentration, 1.4 ng L−1. ACE is metabolite of PHE, which is widely used as an analgesic and antipyretic around the world. PHE has a high concentration in rivers receiving treated wastewater;31,32 it was widely detected in wastewater, surface water, groundwater, and even drinking water.32,33 The concentration distribution of other sampling points in QH River is shown in Table S4.† The concentrations of these compounds at E2 along the YL River ranged from 0.43 ng L−1 (SDZ) to 244.0 ng L−1 (PHE). The concentrations of most of the compounds at most sampling points were higher than those in the QH River (Table S4†). | ||
| Fig. 2 Concentration from active sampling of 16 compounds detected at sampling sites 1 and 2. ACE, 4-CBA, CBZE, 4-OHDCF, 2-OHIPF and NAST are TPs. | ||
Attenuation of pharmaceuticals and their TPs
The attenuation data were obtained from points 1 and 2. The change in concentration between these two points may be attributed to dilution due to inflow of surface water or to the elimination or formation of these compounds by various factors downstream of the river. The calculation of attenuation rate relative to that of CBZ, a persistent compound, can be done to explain the dilution; RA > 0 indicates attenuation. The succeeding discussion is based on the results of active sampling at the YZ, QH, and YL Rivers. | ||
| Fig. 3 Relative attenuation (RA, %) of these parent pharmaceuticals detected from site 1 to site 2 in the rivers based on samples collected with active sampling. It is shown that the eleven of 13 parent pharmaceuticals that were detected in at least one river. No data indicates that the substance was not detected at two points. | ||
The attenuation of pharmaceuticals in the three rivers was analyzed. Most of the pharmaceuticals except for ATP, SDZ, and CA in the YZ River were more susceptible to attenuation than they were in the other rivers (Fig. 3). Attenuation conditions for these substances might have been favorable in the YZ River, that is, favorable light and microbial conditions, fast flow velocity, and so forth. River flow rate has a significant effect on the attenuation, with higher velocity of water resulting in a larger RA.36 On the other hand, a large amount of sewage discharged from the NC STP into the YZ River (previous study shows that BOD, COD and TOC were 1.73 mg L−1, 24.4 mg L−1 and 15.05 g kg−1, respectively39) contributes to a multitude of microorganisms and bacteria in the water, which can form biofilms at the water–sediment interface. Both processes absorb and transform organic micropollutants.40,41 Moreover, the total organic carbon present in the sediments may affect the attenuation of these substances; low total organic carbon content leads to high attenuation.13,36 DCF, NPX, and SMZ were attenuated in at least one river. Studies have shown that DCF and NPX tend to undergo photodegradation, having a short half-life in sunlit river; SMZ tends to undergo biodegradation.34,42,43 The photolysis of SMZ has been shown to be strongly pH dependent and higher photolysis at lower pH,44 and studied rivers have relatively high pH values (Table 2). Consequently, it conclude that photodegradation contributes little to the total removal of SMZ in rivers. However, photodegradation processes are complex, we have to further explore the process to provide more information on the removal by photolysis.
The attenuation pattern of the substances in the three rivers were varied and complex. In order to understand the relationship between the physical and chemical properties of these substances and their attenuation rates, relevant analysis was conducted. The results show that no correlation between them (p > 0.05, Table S5†); hence, the physical and chemical properties of these substances do not reflect the attenuation. In the YZ River, the flow rate, photodegradation, biotransformation, and total suspended solids may lead to attenuation. However, sorption to suspended solids cannot be an attenuation process for these substances in the QH River and YL River because the particle load of the water samples was low. Therefore, biotransformation and adsorption of sediments and photolysis can result in attenuation in the QH and YL River. However, comparison between different rivers is complicated due to the different hydraulics and sediments.
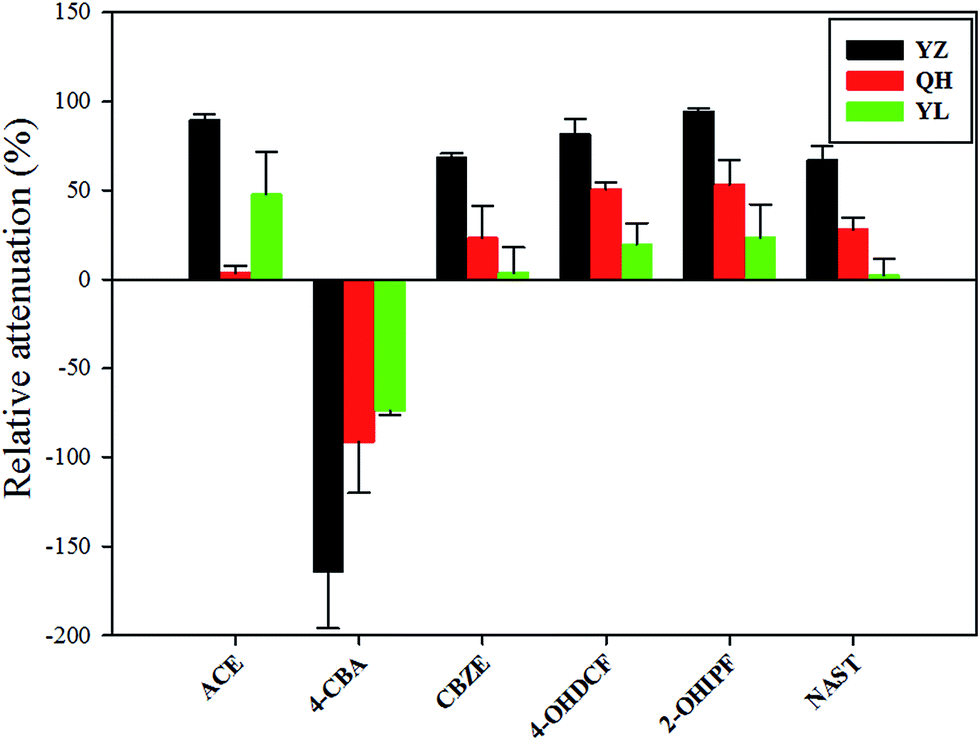 | ||
| Fig. 4 Relative attenuation (RA, %) of transformation products (TPs) detected from site 1 to site 2 in the three rivers based on active sampling of samples. | ||
Although several parent compounds were attenuated downstream of the rivers, the corresponding TPs (except 4-CBA) did not increase in concentration. This result may be explained as follows: during transformation of the parent compounds, the resulting TPs were attenuated because of their short half-life. Because the sampling period between sites 1 and 2 (correspond to N3 and N5 for YZ, E2 and E4 for YL, S3 and S5 for QH) was short (<24 h), transformation of all parent compounds during this period is unlikely. Thus, we can conclude that the vast majority of these TPs were due to the discharge of STP.
Comparison of attenuation results from active and passive sampling
The purpose of comparing the attenuation results from active and passive sampling was to determine whether passive sampling can be applied to compute the attenuation of these substances and perhaps organic micropollutants in rivers. Attenuation rates of pharmaceuticals and their TPs from active and passive sampling in the QH River and YL River are shown in Fig. 5 (details are given in Table S6†). The 83% confidence intervals of the five pharmaceuticals and five their TPs overlap with the 1:1 line, indicating good agreement between attenuation rates calculated from the two sampling approaches. Results for ACE and 4-CBA from active and passive sampling in the YL River were also markedly different. The computed rates for ACE and 4-CBA from passive sampling were 89.1% and 30.5%, respectively, and those from active sampling were 47.6% and −73.4%, respectively. The former value was greater than the latter. The 4-CBA concentration increased during active sampling, and it decreased during passive sampling. The river flow rate has an impact on the rates of POCIS uptake,47,48 but an additional performance reference compound (PRC) needs to be used to correct for flow rate effects. Another explanation could be additional inputs of these two compounds between E2 and E4 during periods of time that were not captured by grab sampling but were continuously accumulated by deployed POCIS. The attenuation rates for BZB, SDZ, and IPF were negative. Although the values were slightly different, they showed the same attenuation trend as that obtained with active sampling. Active sampling was thus likely to be instantaneous sampling, and passive sampling involved continuous accumulation of contaminants. Overall, passive sampling with an appropriate PRC may be a reliable method for monitoring attenuation of most of the compounds.
 | ||
| Fig. 5 Relative attenuation (RA, %) in the QH and YL river derived from active and passive sampling for part of analytes. The solid 1:1 line indicates that the results from active and passive sampling are identical. | ||
Conclusions
In this study, the occurrence and attenuation of pharmaceuticals and their TPs in rivers receiving treated wastewater were investigated. The results show that 19 of 21 compounds were detected at in least one sampling point in each river. The maximum concentration of the outlet of the STP was 544.0 ng L−1 (CBZE), and the minimum value was 0.43 ng L−1 (SDZ). The majority of the pharmaceuticals and their TPs were attenuated in the rivers except in the YL River. Activities of the residents along the river might have affected the river, resulting in negative attenuation for some of the compounds. Photodegradation, sorption to sediments, and biotransformation may be the major removal mechanisms for many of the compounds. Results from active and passive sampling suggest that passive sampling may be a reliable alternative to spot sampling for determining the attenuation rates of many compounds. Passive sampling can also be used for long-term monitoring, which is too resource demanding by spot sampling. However, its potential for measuring the attenuation rates of more organic micropollutants needs in-depth exploration.Conflicts of interest
There are no conflicts to declare.Acknowledgements
The presented study was supported by the National Natural Science Foundation of China (No. 51479067), the Fundamental Research Funds for the Central Universities (No. 2017B13514) and the Project Founded by the Priority Academic Program Development of Jiangsu Higher Education Institutions.References
- J. Wang and L. Chu, Radiat. Phys. Chem., 2016, 125, 56–64 CrossRef CAS.
- J. L. Liu and M. H. Wong, Environ. Int., 2013, 59, 208–224 CrossRef CAS PubMed.
- P. J. Ferguson, M. J. Bernot, J. C. Doll and T. E. Lauer, Sci. Total Environ., 2013, 458–460, 187–196 CrossRef CAS PubMed.
- D. Alvarez-Munoz, B. Huerta, M. Fernandez-Tejedor, S. Rodriguez-Mozaz and D. Barcelo, Talanta, 2015, 136, 174–182 CrossRef CAS PubMed.
- J. Rivera-Utrilla, M. Sanchez-Polo, M. A. Ferro-Garcia, G. Prados-Joya and R. Ocampo-Perez, Chemosphere, 2013, 93, 1268–1287 CrossRef CAS PubMed.
- H. Auvinen, I. Havran, L. Hubau, L. Vanseveren, W. Gebhardt, V. Linnemann, D. Van Oirschot, G. Du Laing and D. P. L. Rousseau, Ecol. Eng., 2017, 100, 157–164 CrossRef.
- E. Vulliet and C. Cren-Olive, Environ. Pollut., 2011, 159, 2929–2934 CrossRef CAS PubMed.
- J. Fick, H. Soederstrom, R. H. Lindberg, C. Phan, M. Tysklind and D. G. J. Larsson, Environ. Toxicol. Chem., 2009, 28, 2522–2527 CAS.
- E. Godfrey, W. W. Woessner and M. J. Benotti, Ground Water, 2007, 45, 263–271 CrossRef CAS PubMed.
- U. Hass, U. Duennbier and G. Massmann, Water Res., 2012, 46, 6013–6022 CrossRef CAS PubMed.
- M. D. Celiz, J. Tso and D. S. Aga, Environ. Toxicol. Chem., 2009, 28, 2473–2484 CrossRef CAS PubMed.
- L. Schlüter-Vorberg, C. Prasse, T. A. Ternes, H. Mückter and A. Coors, Environ. Sci. Technol. Lett., 2015, 2, 342–346 CrossRef.
- Z. Li, A. Sobek and M. Radke, Environ. Sci. Technol., 2016, 50, 5614–5621 CrossRef CAS PubMed.
- M. Rodríguez-Delgado, C. Orona-Navar, R. García-Morales, C. Hernandez-Luna, R. Parra, J. Mahlknecht and N. Ornelas-Soto, Int. Biodeterior. Biodegrad., 2016, 108, 34–41 CrossRef.
- U. Kunkel and M. Radke, Water Res., 2012, 46, 5551–5565 CrossRef CAS PubMed.
- V. Acuna, D. von Schiller, M. J. Garcia-Galan, S. Rodriguez-Mozaz, L. Corominas, M. Petrovic, M. Poch, D. Barcelo and S. Sabater, Sci. Total Environ., 2015, 503–504, 133–141 CrossRef CAS PubMed.
- A. M. Greenhagen, M. E. Lenczewski and M. Carroll, Chemosphere, 2014, 115, 13–19 CrossRef CAS PubMed.
- E. Brezina, C. Prasse, J. Meyer, H. Muckter and T. A. Ternes, Environ. Pollut., 2017, 225, 261–269 CrossRef CAS PubMed.
- O. Koba, O. Golovko, R. Kodesova, A. Klement and R. Grabic, Environ. Pollut., 2016, 218, 574–585 CrossRef CAS PubMed.
- I. Aymerich, V. Acuna, D. Barcelo, M. J. Garcia, M. Petrovic, M. Poch, S. Rodriguez-Mozaz, I. Rodriguez-Roda, S. Sabater, D. von Schiller and L. Corominas, Water Res., 2016, 100, 126–136 CrossRef CAS PubMed.
- B. F. Da Silva, A. Jelic, R. Lopez-Serna, A. A. Mozeto, M. Petrovic and D. Barcelo, Chemosphere, 2011, 85, 1331–1339 CrossRef PubMed.
- J. H. Writer, R. C. Antweiler, I. Ferrer, J. N. Ryan and E. M. Thurman, Environ. Sci. Technol., 2013, 47, 9781–9790 CrossRef CAS PubMed.
- A. Vallejo, A. Prieto, M. Moeder, A. Usobiaga, O. Zuloaga and N. Etxebarria, Water Res., 2013, 47, 2851–2862 CrossRef CAS PubMed.
- I. Ibrahim, A. Togola and C. Gonzalez, Talanta, 2013, 116, 495–500 CrossRef CAS PubMed.
- J. A. Baz-lomba, C. Harman, M. Reid and K. V. Thomas, Water Res., 2017, 121, 221–230 CrossRef CAS PubMed.
- J. C. Liu, G. H. Lu, Z. X. Xie, Z. H. Zhang, S. Li and Z. H. Yan, Sci. Total Environ., 2015, 511, 54–62 CrossRef CAS PubMed.
- S. L. Kaserzon, K. Kennedy, D. W. Hawker, J. Thompson, S. Carter, A. C. Roach, K. Booij and J. F. Mueller, Environ. Sci. Technol., 2012, 46, 4985–4993 CrossRef CAS PubMed.
- V. Calisto, M. R. M. Domingues, G. L. Erny and V. I. Esteves, Water Res., 2011, 45, 1095–1104 CrossRef CAS PubMed.
- H. Zou, M. Radke, A. Kierkegaard, M. MacLeod and M. S. McLachlan, Environ. Sci. Technol., 2015, 49, 1646–1653 CrossRef CAS PubMed.
- Z. Li, S. L. Kaserzon, M. M. Plassmann, A. Sobek, M. J. Gomez Ramos and M. Radke, Environ. Sci.: Processes Impacts, 2017, 19, 488–498 CAS.
- X. Zhang, F. Wu, X. W. Wu, P. Chen and N. Deng, J. Hazard. Mater., 2008, 157, 300–307 CrossRef CAS PubMed.
- P. H. Roberts and K. V. Thomas, Sci. Total Environ., 2006, 356, 143–153 CrossRef CAS PubMed.
- C. Wang, H. Shi, C. D. Adams, S. Gamagedara, I. Stayton, T. Timmons and Y. Ma, Water Res., 2011, 45, 1818–1828 CrossRef CAS PubMed.
- A. Y. C. Lin and M. Reinhard, Environ. Toxicol. Chem., 2005, 24, 1303–1309 CrossRef CAS PubMed.
- L. J. Fono, E. P. Kolodziej and D. L. Sedlak, Environ. Sci. Technol., 2006, 40, 7257–7262 CrossRef CAS PubMed.
- Y. Luo, L. Xu, M. Rysz, Y. Q. Wang, H. Zhang and P. J. J. Alvarez, Environ. Sci. Technol., 2011, 45, 1827–1833 CrossRef CAS PubMed.
- B. Li and T. Zhang, Environ. Sci. Technol., 2010, 44, 3468–3473 CrossRef CAS PubMed.
- A. Y. C. Lin, M. H. Plumlee and M. Reinhard, Environ. Toxicol. Chem., 2006, 25, 1458–1464 CrossRef CAS PubMed.
- W. R. Liu, J. L. Zhao, Y. S. Liu, Z. F. Chen, Y. Y. Yang, Q. Q. Zhang and G. G. Ying, Environ. Pollut., 2015, 200, 53–63 CrossRef CAS PubMed.
- D. Wicke, U. Bockelmann and T. Reemtsma, Water Res., 2007, 41, 2202–2210 CrossRef CAS PubMed.
- J. H. Writer, J. N. Ryan and L. B. Barber, Environ. Sci. Technol., 2011, 45, 7275–7283 CrossRef CAS PubMed.
- S. Poirier-Larabie, P. A. Segura and C. Gagnon, Sci. Total Environ., 2016, 557–558, 257–267 CrossRef CAS PubMed.
- T. Su, H. Deng, J. P. Benskin and M. Radke, Chemosphere, 2016, 148, 518–525 CrossRef CAS PubMed.
- D. E. Moore and W. Zhou, Photochem. Photobiol., 1994, 59, 497–502 CrossRef CAS PubMed.
- Y. Magara, T. Aizawa, N. Matumoto and F. Souna, Water Sci. Technol., 1994, 30, 119–128 CAS.
- R. Müller and F. Lingens, Angew. Chem., Int. Ed., 1986, 25, 779–789 CrossRef.
- C. M. Yang, Y. Li, D. P. Zha, G. H. Lu, Q. Sun and D. H. Wu, Chemosphere, 2017, 167, 1–9 CrossRef CAS PubMed.
- M. Di Carro, L. Bono and E. Magi, Talanta, 2014, 120, 30–33 CrossRef CAS PubMed.
Footnote |
| † Electronic supplementary information (ESI) available. See DOI: 10.1039/c7ra06852b |
| This journal is © The Royal Society of Chemistry 2017 |