 Open Access Article
Creative Commons Attribution 3.0 Unported Licence
Low temperature catalytic hydrolysis of carbon disulfide over nano-active carbon based catalysts prepared by liquid phase deposition
Kai Lia,
Xin Songa,
Guijian Zhanga,
Chi Wangb,
Ping Ning *a,
Xin Suna and
Lihong Tanga
aFaculty of Environmental Science and Engineering, Kunming University of Science and Technology, Kunming, 650500, China. E-mail: ningpingkmust@163.com; Fax: +86-871-65920507; Tel: +86-871-65920507
bFaculty of Chemical Engineering, Kunming University of Science and Technology, Kunming, 650500, China
First published on 18th August 2017
Abstract
In this work, a series of nano-carbon based catalysts loaded with metal oxides were prepared via liquid phase deposition, and used for low temperature catalytic hydrolysis of carbon disulfide (CS2). The influences of preparation conditions for catalytic activity were investigated. These factors included species and content of metal oxides, ratio of F![[thin space (1/6-em)]](https://www.rsc.org/images/entities/char_2009.gif) :
:![[thin space (1/6-em)]](https://www.rsc.org/images/entities/char_2009.gif) Fe, solution pH, and calcination temperature. The results showed that catalysts with 0.2 mol L−1 Fe ion after calcining at 500 °C had good catalytic activity for the catalytic hydrolysis of CS2. Furthermore, the catalytic hydrolysis activity could reach the best performance with the optimum preparation conditions with an F
Fe, solution pH, and calcination temperature. The results showed that catalysts with 0.2 mol L−1 Fe ion after calcining at 500 °C had good catalytic activity for the catalytic hydrolysis of CS2. Furthermore, the catalytic hydrolysis activity could reach the best performance with the optimum preparation conditions with an F![[thin space (1/6-em)]](https://www.rsc.org/images/entities/char_2009.gif) :
:![[thin space (1/6-em)]](https://www.rsc.org/images/entities/char_2009.gif) Fe ratio of 3
Fe ratio of 3![[thin space (1/6-em)]](https://www.rsc.org/images/entities/char_2009.gif) :
:![[thin space (1/6-em)]](https://www.rsc.org/images/entities/char_2009.gif) 1, and a solution pH of 5.1. The metal species affected the catalytic hydrolysis of CS2 and the oxidation of H2S. The solution pH and fluoride affected the generation of Fe3+ (Fe2O3). The chemical composition, structure and surface properties were characterized by X-ray diffractometry (XRD), temperature programmed desorption of carbon monoxide (CO-TPD), X-ray photoelectron spectrum (XPS) and Brunauer–Emmett–Teller measurements (BET). The XRD and BET results showed that the calcination temperature controlled the crystalline phase and generation of Fe2O3 and affected the properties of specific surface area and pore structure.
1, and a solution pH of 5.1. The metal species affected the catalytic hydrolysis of CS2 and the oxidation of H2S. The solution pH and fluoride affected the generation of Fe3+ (Fe2O3). The chemical composition, structure and surface properties were characterized by X-ray diffractometry (XRD), temperature programmed desorption of carbon monoxide (CO-TPD), X-ray photoelectron spectrum (XPS) and Brunauer–Emmett–Teller measurements (BET). The XRD and BET results showed that the calcination temperature controlled the crystalline phase and generation of Fe2O3 and affected the properties of specific surface area and pore structure.
1. Introduction
Carbon disulfide (CS2), as a major component of organic sulfur compounds, derives mainly from industrial tail gases, such as in the coal, natural gas, petroleum, crude oil, and streams industries.1,2 It has a negative effect in many catalysis and synthesis processes (even as low as 1 ppm concentration).3 CS2 can not only pollute the environment but also poison the catalysts.3,4 Therefore, the removal of CS2 is necessary. Many methods have been developed to remove CS2 from Claus tail gas and other processed gas streams. The main methods for CS2 removal includes reduction, adsorption, photolysis, oxidation, catalytic hydrolysis, etc.5–11 Among these methods, catalytic hydrolysis was recognized as the most suitable removal process due to the characteristics of mild reaction conditions, low cost, and higher conversion efficiency.12 Recently, many studies focused on high temperature catalytic hydrolysis over 200 °C, but few researches focused on low temperature catalytic hydrolysis below 100 °C. Therefore, it is valuable to study CS2 removal at low temperature (<100 °C) due to that it will be more economical.13 In the recent years, researchers have prepared kinds of new catalysts to increase the efficiency of CS2 catalytic hydrolysis at low temperature, such as γ-Al2O3, TiO2, hydrotalcite-like compounds, carbon based catalyst.14–17 Activated carbon has the special characteristics of stable structure, well-developed porous structure, large surface area and porous structure and potential bio-compatibility, and it has got a lot of attention.4 Many people have modified the surface properties of activated carbons to improve its function, which made it meet the growing needs of removal CS2 at low temperature.14,18,19With the development of nanotechnology, further studies have been carried out on nanoparticles, which defined a kind of ordered assembly structure that a nanoparticle is covered with another through a bond or other forces.20 Recently, nanoparticles have attracted considerable interest because of the fact that their characteristics, such as magnetic, optical, electrical and catalysis. These characteristics can be easily controlled by changing their structure, compositions and particle size by appropriate method. Many reports also have showed that nanoparticles covered by the shell (such as noble metal, metal oxides and magnetic ferrites) had improved the performance in removing environmental pollutants.21–23 Many methods have been developed to prepare nanoparticles include the sol–gel method, hydrothermal treatment method, self-assembly method and liquid phase deposition method (LPD), etc.24–27 Among these methods, LPD was treated as the most promising process due to mild reaction condition, cost-effective and adjustability of nanoparticle properties.28
In the recent studies, there were a large number of researches about the nanoparticles catalysts for aqueous environmental pollutants.21–23 However, few researches focused on removing gas pollutants in the atmospheric, especially catalytic hydrolysis of CS2 at low temperature (<100 °C). In this study, nano-carbon based catalysts were used for CS2 removal at low-temperature (50 °C). The influences of the preparation conditions included species and content of metal oxides, molar ratio of F![[thin space (1/6-em)]](https://www.rsc.org/images/entities/char_2009.gif) :
:![[thin space (1/6-em)]](https://www.rsc.org/images/entities/char_2009.gif) metal ions, solution pH and calcination temperature were investigated. Meanwhile, the chemical composition, structure and surface properties were characterized by X-ray diffractometry (XRD), X-ray photoelectron spectrum (XPS), temperature programmed desorption of carbon-monoxide (CO-TPD) and Brunauer–Emmett–Teller measurements (BET).
metal ions, solution pH and calcination temperature were investigated. Meanwhile, the chemical composition, structure and surface properties were characterized by X-ray diffractometry (XRD), X-ray photoelectron spectrum (XPS), temperature programmed desorption of carbon-monoxide (CO-TPD) and Brunauer–Emmett–Teller measurements (BET).
2. Materials and methods
2.1 Catalysts preparation
All reagents were at analytical grade. The nano-carbon (the average particle size is 40 nm) came from the Beijing DK nano technology Co. LTD. The nanoparticles catalysts were synthesized with liquid phase deposition method.29 Fluoride was used to prepare the precursor of Fe3+ (Fe2O3). 40 wt% hydrofluoric acid solution (HF) was introduced into a 50 mL metal salt (NiCl2·6H2O, Cu(CH3COO)2, Zn(CH3COO)2·2H2O, FeCl2·4H2O and Mn(CH3COO)2·4H2O) solution, and the concentration of metal salt was kept at specific (0.05–0.4 mol L−1). When the influence of metal species and content were investigated, the content of F was fixed. When the influence of F was investigated, the content of Fe was fixed. The addition amount of hydrofluoric acid solution was according to the expected molar ratio of F to metal atoms in the mixed solution. In this study, the range of molar ratio of F to metal atoms was from 1![[thin space (1/6-em)]](https://www.rsc.org/images/entities/char_2009.gif) :
:![[thin space (1/6-em)]](https://www.rsc.org/images/entities/char_2009.gif) 1 to 5
1 to 5![[thin space (1/6-em)]](https://www.rsc.org/images/entities/char_2009.gif) :
:![[thin space (1/6-em)]](https://www.rsc.org/images/entities/char_2009.gif) 1. The solution pH was adjusted to 4.7–5.3 by adding dropwise 25 wt% ammonia hydroxide solution. Then, 50 mL nano-carbon suspension (the mass fraction of nanocarbon was 1% in the suspension) was added into above mixed solution. Next, these samples were treated with bathing at 60 °C and stirring for 2 h, and then were separated by centrifugal. In this process, Fe2+ was converted into Fe3+. Then, they were washed twice with distilled water, and dried at 60 °C in the drying oven for 12 h. Finally, these samples were calcined for 2 h at specific temperatures (300 °C, 400 °C, 500 °C, 600 °C, 700 °C) in a pipe furnace in nitrogen atmosphere with 82.4 kPa of atmospheric pressure.
1. The solution pH was adjusted to 4.7–5.3 by adding dropwise 25 wt% ammonia hydroxide solution. Then, 50 mL nano-carbon suspension (the mass fraction of nanocarbon was 1% in the suspension) was added into above mixed solution. Next, these samples were treated with bathing at 60 °C and stirring for 2 h, and then were separated by centrifugal. In this process, Fe2+ was converted into Fe3+. Then, they were washed twice with distilled water, and dried at 60 °C in the drying oven for 12 h. Finally, these samples were calcined for 2 h at specific temperatures (300 °C, 400 °C, 500 °C, 600 °C, 700 °C) in a pipe furnace in nitrogen atmosphere with 82.4 kPa of atmospheric pressure.
2.2 Desulfurization test
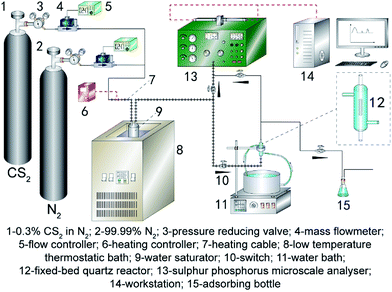
At the first, the nanoparticles prepared in above process was crushed and sieved to 40–60 mesh size for this study. Desulfurization tests were carried out under atmospheric pressure in a fixed-bed quartz reactor system (3 mm inside diameter × 100 mm length). Fig. 1 shows a schematic diagram of the apparatus for the catalytic activity measurements.To ensure that the catalyst could not escape from the vessel during the operation, the catalyst was loaded into the fixed bed and a wad of cotton wool was inserted into the reactor. CS2 from a gas cylinder (0.3% CS2 in N2) was diluted with nitrogen (99.99%) to the required concentration (CS2: 80–90 ppm). The overall flow rate was controlled using calibrated mass flow controllers, and the overall gas hourly space velocity (GHSV) of the reaction mixture was standardized at 10![[thin space (1/6-em)]](https://www.rsc.org/images/entities/char_2009.gif) 000 h−1. Water was introduced using a saturator system. The temperature of this reactor was controlled by a water-bath with a circulating pump to an accuracy of ±0.1 °C. The relative humidity (RH) of mixture gas was 11.8%. The concentrations of CS2 in the feed and effluent of reactor were collected by a HC-6 sulfur phosphorus microscale analyzer. The conversion of CS2 is determined by analyzing the inlet and outlet concentrations of CS2:
000 h−1. Water was introduced using a saturator system. The temperature of this reactor was controlled by a water-bath with a circulating pump to an accuracy of ±0.1 °C. The relative humidity (RH) of mixture gas was 11.8%. The concentrations of CS2 in the feed and effluent of reactor were collected by a HC-6 sulfur phosphorus microscale analyzer. The conversion of CS2 is determined by analyzing the inlet and outlet concentrations of CS2:
In addition, all the experimental operating conditions are the same so that no other external factor to affect the susceptibility of catalysts. Therefore, a longer reaction time (keeping above 90% of CS2 conversion) represents a higher catalytic hydrolysis activity.
2.3 Characterization
X-ray diffraction (XRD, D/MAX-2200 from Rigaku company) patterns were recorded with a diffractometer operated at 36 kV and 30 mA by using Ni filtered Cu Kα radiation (λ = 0.15406 nm) at a rate of 5° min−1 from 2θ = 10° to 80°. X-ray photoelectron spectrum (XPS, AXIS-ultra from Kratos) analysis used Al Kα radiation with energy of the Al target and a power of 200 W. The metal oxides dispersion on catalyst surface was measured by a temperature programmed desorption of carbon monoxide (CO-TPD, Belcat II from Belcat) with a thermal conductivity detector (TCD) setup using 100 mg of catalyst. Nitrogen adsorption–desorption measurements were carried out using a Quantachrome NOVA2000e surface area analyzer. Specific surface areas, mesoporous and micropore parameter data calculated by Brunauer–Emmett–Teller (BET), Barrett–Joyner–Halenda (BJH) and Horvath–Kawazoe (HK) methods.3. Results and discussion
3.1 Influence of metal oxide species on catalytic hydrolysis of CS2
The catalytic hydrolysis of CS2 over a series of nano-catalysts with different metal oxides additives were investigated at 50 °C. In this section, the content of metal ion were all 0.1 mol L−1; F![[thin space (1/6-em)]](https://www.rsc.org/images/entities/char_2009.gif) :
:![[thin space (1/6-em)]](https://www.rsc.org/images/entities/char_2009.gif) Fe was 3
Fe was 3![[thin space (1/6-em)]](https://www.rsc.org/images/entities/char_2009.gif) :
:![[thin space (1/6-em)]](https://www.rsc.org/images/entities/char_2009.gif) 1; pH was 5.1; calcination temperature was 500 °C. From Fig. 2, it can be seen that there was a significant difference of activity among these catalysts. The CS2 conversions of a series nano-catalysts were lower than that of blank nano-AC, excepted for Fe/nano-AC. Meanwhile, the following order of activity was obtained: Fe/nano-AC > nano-AC > Zn/nano-AC > Cu/nano-AC > Mn/nano-AC > Ni/nano-AC. So only the Fe/nano-AC catalyst could effectively enhance the CS2 conversion. From the results of activity test, for Fe/nano-AC, above 90% CS2 conversion was observed for about 330 min. However, for blank nano-AC, above 90% CS2 conversion only last 240 min. It indicated that the removal process of CS2 might be adsorption reaction on the surface of nano-AC, and might be catalytic hydrolysis reaction on the surface of Fe2O3.
1; pH was 5.1; calcination temperature was 500 °C. From Fig. 2, it can be seen that there was a significant difference of activity among these catalysts. The CS2 conversions of a series nano-catalysts were lower than that of blank nano-AC, excepted for Fe/nano-AC. Meanwhile, the following order of activity was obtained: Fe/nano-AC > nano-AC > Zn/nano-AC > Cu/nano-AC > Mn/nano-AC > Ni/nano-AC. So only the Fe/nano-AC catalyst could effectively enhance the CS2 conversion. From the results of activity test, for Fe/nano-AC, above 90% CS2 conversion was observed for about 330 min. However, for blank nano-AC, above 90% CS2 conversion only last 240 min. It indicated that the removal process of CS2 might be adsorption reaction on the surface of nano-AC, and might be catalytic hydrolysis reaction on the surface of Fe2O3.
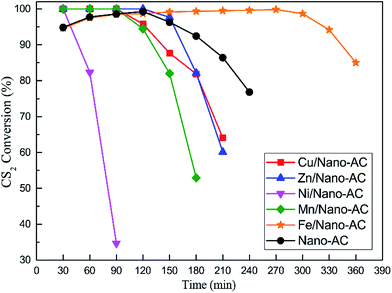 | ||
Fig. 2 Catalytic hydrolysis of CS2 over nano-AC modified by different metal oxides (reaction conditions: 90 ppm CS2; GHSV = 10![[thin space (1/6-em)]](https://www.rsc.org/images/entities/char_2009.gif) 000 h−1; reaction temperature = 50 °C; RH = 11.8%). 000 h−1; reaction temperature = 50 °C; RH = 11.8%). | ||
The reason may be that Fe (as a transition metal) can promote the catalytic hydrolysis activity of CS2. From previous studies, it's apparent that the Fe–S binding energy of intermediate strength (−4.5 eV) provided the optimum catalyst performance.30 Besides, the outer shell of the Fe ion is a kind of unfilled structure, which provides more effective nuclear charge. Therefore, the kind of texture is conducive to generate coordination compounds in the process of reaction. As an intermediate product, the coordination compounds can provide coordination catalysis effect and related surface reaction to promote the catalysis reaction. In previous study, Fe also showed high catalytic hydrolysis activity for CS2 and low oxidation activity for H2S.4 Due to high catalytic hydrolysis activity, Fe could improve the hydrolysis efficiency. Furthermore, low oxidation activity decreased the generation of sulfate (the oxidation product of H2S), which could prolong the lifetime of catalyst. Therefore, Fe was the optimal metal.
3.2 Influence of Fe content on catalytic hydrolysis of CS2
In order to investigate the influence of different Fe contents in the preparation process of Fe/nano-AC for catalytic hydrolysis activity of CS2, 0.05 mol L−1, 0.1 mol L−1, 0.2 mol L−1, 0.3 mol L−1 and 0.4 mol L−1 Fe content were investigated. In this section, other preparation conditions were as follows: F![[thin space (1/6-em)]](https://www.rsc.org/images/entities/char_2009.gif) :
:![[thin space (1/6-em)]](https://www.rsc.org/images/entities/char_2009.gif) Fe was 3
Fe was 3![[thin space (1/6-em)]](https://www.rsc.org/images/entities/char_2009.gif) :
:![[thin space (1/6-em)]](https://www.rsc.org/images/entities/char_2009.gif) 1; pH was 5.1; calcination temperature was 500 °C. As shown in Fig. 3, the CS2 removal efficiency over Fe/nano-AC catalysts initially increased and then decreased with increasing Fe content. Fe/nano-AC showed best catalytic activity when the Fe content was 0.2 mol L−1, and above 90% CS2 conversion last 540 min at least. Contrarily, Fe(0.05)/nano-AC showed lowest catalytic activity, and above 90% CS2 conversion only last 210 min. Furthermore, the catalysts coated by different Fe contents could increase the catalytic activity compared to blank nano-AC.
1; pH was 5.1; calcination temperature was 500 °C. As shown in Fig. 3, the CS2 removal efficiency over Fe/nano-AC catalysts initially increased and then decreased with increasing Fe content. Fe/nano-AC showed best catalytic activity when the Fe content was 0.2 mol L−1, and above 90% CS2 conversion last 540 min at least. Contrarily, Fe(0.05)/nano-AC showed lowest catalytic activity, and above 90% CS2 conversion only last 210 min. Furthermore, the catalysts coated by different Fe contents could increase the catalytic activity compared to blank nano-AC.
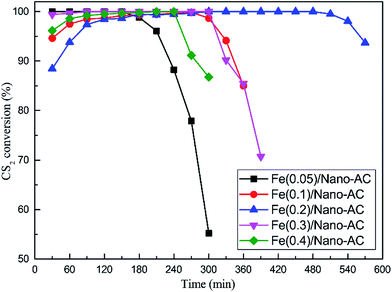 | ||
Fig. 3 Catalytic hydrolysis of CS2 over Fe/nano-AC modified by different Fe content (reaction conditions: 90 ppm CS2; GHSV = 10![[thin space (1/6-em)]](https://www.rsc.org/images/entities/char_2009.gif) 000 h−1; reaction temperature = 50 °C; RH = 11.8%). 000 h−1; reaction temperature = 50 °C; RH = 11.8%). | ||
Generally, the process of the crystal growth is divided into two types: homogeneous nucleation and heterogeneous nucleation. In comparison to the homogeneous nucleation, the new phase formed and developed on the original solid phase surface in the processes of crystal nucleation and growth of heterogeneous system. Meanwhile, the increase of the surface free energy in heterogeneous system is less than that of homogeneous. As a result, the molecules nucleation and growth in the interface of heterogeneous is better than that of homogeneous system. Therefore, in order to decrease homogeneous nucleation as much as possible and deposit a large amount of reactants on nano-AC surface, the saturation degree of solution should be controlled reasonable range when the Fe/nano-AC was prepared by LPD. Meanwhile, many studies showed that the supersaturation degree of solution was directly affected by metal ion content and pH, etc.24
Therefore, the Fe could deposit largely on the surface of nano-carbon when the Fe content was close to 0.2 mol L−1, and the catalyst had highest efficiency on catalytic hydrolysis of CS2. When the Fe content was above 0.3 mol L−1, the self-condensation of iron complex compound is formed with increasing of Fe content. Table 1 showed the metal dispersion on the surface of Fe/nano-AC modified by different Fe content. From Table 1, the metal dispersion increased from 1.99% to 8.01% when Fe content was low (0.05–0.2 mol L−1), but the metal dispersion decreased from 8.01% to 5.45% when Fe contents was high (>0.2 mol L−1). Furthermore, the micropores or mesoporous on the surface of nano-carbon may be blocked by the excessive Fe2O3. The surface adsorption sites or active of catalysts would be excessively overlapped, which leads to the catalytic efficiency decrease. From Table 2, it can be concluded that Fe content (0.05–0.3 mol L−1) affected the surface area and pore volume. Furthermore, there was no obvious influence for the surface area and pore volume when Fe content was above 0.3 mol L−1. When the Fe content was below 0.2 mol L−1, there was not enough Fe deposited on the nano-AC surface. As the main active component, low Fe dispersion led to low catalytic hydrolysis activity.
| Samples | Dispersion (%) | Fe content (Fe2O3, wt%) |
|---|---|---|
| Fe(0.05)/nano-AC | 1.99 | 15.5 |
| Fe(0.2)/nano-AC | 8.01 | 25.7 |
| Fe(0.4)/nano-AC | 5.45 | 29.3 |
| Samples | Surface area (m2 g−1) | Total pore volume (cm3 g−1) | Average pore diameter (nm) |
|---|---|---|---|
| Fe(0.05)/nano-AC | 395 | 0.32 | 3.28 |
| Fe(0.2)/nano-AC | 381 | 0.32 | 3.26 |
| Fe(0.3)/nano-AC | 354 | 0.29 | 3.27 |
| Fe(0.4)/nano-AC | 357 | 0.29 | 3.33 |
3.3 Influence of molar ratio of F![[thin space (1/6-em)]](https://www.rsc.org/images/entities/h3_char_2009.gif) :
:![[thin space (1/6-em)]](https://www.rsc.org/images/entities/h3_char_2009.gif) Fe on catalytic hydrolysis of CS2
Fe on catalytic hydrolysis of CS2
When the Fe content was confirmed, the molar ratio of F![[thin space (1/6-em)]](https://www.rsc.org/images/entities/char_2009.gif) :
:![[thin space (1/6-em)]](https://www.rsc.org/images/entities/char_2009.gif) Fe was determined with the content of F. It means that higher ratio of F
Fe was determined with the content of F. It means that higher ratio of F![[thin space (1/6-em)]](https://www.rsc.org/images/entities/char_2009.gif) :
:![[thin space (1/6-em)]](https://www.rsc.org/images/entities/char_2009.gif) Fe represents a higher content of F. The relationship between the catalytic hydrolysis activity of CS2 and the ratio of F
Fe represents a higher content of F. The relationship between the catalytic hydrolysis activity of CS2 and the ratio of F![[thin space (1/6-em)]](https://www.rsc.org/images/entities/char_2009.gif) :
:![[thin space (1/6-em)]](https://www.rsc.org/images/entities/char_2009.gif) Fe was investigated, and the desulfurization tests showed in Fig. 4. In this section, the content of Fe was 0.2 mol L−1; pH was 5.1; calcination temperature was 500 °C. The CS2 removal efficiency initially increased and then decreased with increasing molar ratio of F
Fe was investigated, and the desulfurization tests showed in Fig. 4. In this section, the content of Fe was 0.2 mol L−1; pH was 5.1; calcination temperature was 500 °C. The CS2 removal efficiency initially increased and then decreased with increasing molar ratio of F![[thin space (1/6-em)]](https://www.rsc.org/images/entities/char_2009.gif) :
:![[thin space (1/6-em)]](https://www.rsc.org/images/entities/char_2009.gif) Fe. Compared to blank nano-AC, the catalysts prepared by different ratio of F
Fe. Compared to blank nano-AC, the catalysts prepared by different ratio of F![[thin space (1/6-em)]](https://www.rsc.org/images/entities/char_2009.gif) :
:![[thin space (1/6-em)]](https://www.rsc.org/images/entities/char_2009.gif) Fe could enhance the catalytic hydrolysis activity of CS2. Fe/nano-AC showed best catalytic activity when the F
Fe could enhance the catalytic hydrolysis activity of CS2. Fe/nano-AC showed best catalytic activity when the F![[thin space (1/6-em)]](https://www.rsc.org/images/entities/char_2009.gif) :
:![[thin space (1/6-em)]](https://www.rsc.org/images/entities/char_2009.gif) Fe was 3
Fe was 3![[thin space (1/6-em)]](https://www.rsc.org/images/entities/char_2009.gif) :
:![[thin space (1/6-em)]](https://www.rsc.org/images/entities/char_2009.gif) 1, and above 90% CS2 conversion last 540 min at least. Contrarily, Fe/nano-AC showed lowest catalytic activity when F
1, and above 90% CS2 conversion last 540 min at least. Contrarily, Fe/nano-AC showed lowest catalytic activity when F![[thin space (1/6-em)]](https://www.rsc.org/images/entities/char_2009.gif) :
:![[thin space (1/6-em)]](https://www.rsc.org/images/entities/char_2009.gif) Fe was 5
Fe was 5![[thin space (1/6-em)]](https://www.rsc.org/images/entities/char_2009.gif) :
:![[thin space (1/6-em)]](https://www.rsc.org/images/entities/char_2009.gif) 1.
1.
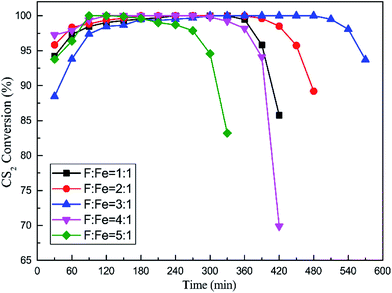 | ||
Fig. 4 Catalytic hydrolysis of CS2 over Fe/nano-AC modified by different F![[thin space (1/6-em)]](https://www.rsc.org/images/entities/char_2009.gif) : :![[thin space (1/6-em)]](https://www.rsc.org/images/entities/char_2009.gif) Fe ratio (reaction conditions: 90 ppm CS2; GHSV = 10 Fe ratio (reaction conditions: 90 ppm CS2; GHSV = 10![[thin space (1/6-em)]](https://www.rsc.org/images/entities/char_2009.gif) 000 h−1; reaction temperature = 50 °C; RH = 11.8%). 000 h−1; reaction temperature = 50 °C; RH = 11.8%). | ||
The previous research29 showed that the F content was a main influence factor for the formation of Fe3+ (Fe2O3) when the Fe content was fixed. Therefore, when F![[thin space (1/6-em)]](https://www.rsc.org/images/entities/char_2009.gif) :
:![[thin space (1/6-em)]](https://www.rsc.org/images/entities/char_2009.gif) Fe was higher than 3
Fe was higher than 3![[thin space (1/6-em)]](https://www.rsc.org/images/entities/char_2009.gif) :
:![[thin space (1/6-em)]](https://www.rsc.org/images/entities/char_2009.gif) 1, the amount of F inevitably increased, which reduced the amount of Fe3+ (Fe2O3). As a result, the catalytic hydrolysis efficiency of CS2 over Fe/nano-AC would be weakened, which could be attributed that the amount of iron depositions directly decreased on the surface. Besides, when the F
1, the amount of F inevitably increased, which reduced the amount of Fe3+ (Fe2O3). As a result, the catalytic hydrolysis efficiency of CS2 over Fe/nano-AC would be weakened, which could be attributed that the amount of iron depositions directly decreased on the surface. Besides, when the F![[thin space (1/6-em)]](https://www.rsc.org/images/entities/char_2009.gif) :
:![[thin space (1/6-em)]](https://www.rsc.org/images/entities/char_2009.gif) Fe was below 3
Fe was below 3![[thin space (1/6-em)]](https://www.rsc.org/images/entities/char_2009.gif) :
:![[thin space (1/6-em)]](https://www.rsc.org/images/entities/char_2009.gif) 1, the role of F could be decreased, and the amount of Fe3+ (Fe2O3) would be reduced. Thus, the catalytic hydrolysis efficiency of CS2 over Fe/nano-AC would be also weakened when the F
1, the role of F could be decreased, and the amount of Fe3+ (Fe2O3) would be reduced. Thus, the catalytic hydrolysis efficiency of CS2 over Fe/nano-AC would be also weakened when the F![[thin space (1/6-em)]](https://www.rsc.org/images/entities/char_2009.gif) :
:![[thin space (1/6-em)]](https://www.rsc.org/images/entities/char_2009.gif) Fe was below 3
Fe was below 3![[thin space (1/6-em)]](https://www.rsc.org/images/entities/char_2009.gif) :
:![[thin space (1/6-em)]](https://www.rsc.org/images/entities/char_2009.gif) 1. Table 3 showed the metal dispersion and Fe contents (Fe2O3, wt%) on the surface of Fe/nano-AC modified by different F
1. Table 3 showed the metal dispersion and Fe contents (Fe2O3, wt%) on the surface of Fe/nano-AC modified by different F![[thin space (1/6-em)]](https://www.rsc.org/images/entities/char_2009.gif) :
:![[thin space (1/6-em)]](https://www.rsc.org/images/entities/char_2009.gif) Fe. From Table 3, the metal dispersion increased from 2.73% to 8.01% when F
Fe. From Table 3, the metal dispersion increased from 2.73% to 8.01% when F![[thin space (1/6-em)]](https://www.rsc.org/images/entities/char_2009.gif) :
:![[thin space (1/6-em)]](https://www.rsc.org/images/entities/char_2009.gif) Fe was below 3
Fe was below 3![[thin space (1/6-em)]](https://www.rsc.org/images/entities/char_2009.gif) :
:![[thin space (1/6-em)]](https://www.rsc.org/images/entities/char_2009.gif) 1. When F
1. When F![[thin space (1/6-em)]](https://www.rsc.org/images/entities/char_2009.gif) :
:![[thin space (1/6-em)]](https://www.rsc.org/images/entities/char_2009.gif) Fe was higher (above 3
Fe was higher (above 3![[thin space (1/6-em)]](https://www.rsc.org/images/entities/char_2009.gif) :
:![[thin space (1/6-em)]](https://www.rsc.org/images/entities/char_2009.gif) 1), the metal dispersion decreased from 8.01% to 5.10%. Meanwhile, the results of Fe content are according with above analysis. It indicated that the content of F affected the formation of Fe3+ (Fe2O3) and then affected the dispersion of Fe.
1), the metal dispersion decreased from 8.01% to 5.10%. Meanwhile, the results of Fe content are according with above analysis. It indicated that the content of F affected the formation of Fe3+ (Fe2O3) and then affected the dispersion of Fe.
![[thin space (1/6-em)]](https://www.rsc.org/images/entities/char_2009.gif) :
:![[thin space (1/6-em)]](https://www.rsc.org/images/entities/char_2009.gif) Fe ratio
Fe ratio
| Samples | Dispersion (%) | Fe content (Fe2O3, wt%) |
|---|---|---|
F![[thin space (1/6-em)]](https://www.rsc.org/images/entities/char_2009.gif) : :![[thin space (1/6-em)]](https://www.rsc.org/images/entities/char_2009.gif) Fe = 1 Fe = 1![[thin space (1/6-em)]](https://www.rsc.org/images/entities/char_2009.gif) : :![[thin space (1/6-em)]](https://www.rsc.org/images/entities/char_2009.gif) 1 1 |
2.73 | 12.6 |
F![[thin space (1/6-em)]](https://www.rsc.org/images/entities/char_2009.gif) : :![[thin space (1/6-em)]](https://www.rsc.org/images/entities/char_2009.gif) Fe = 3 Fe = 3![[thin space (1/6-em)]](https://www.rsc.org/images/entities/char_2009.gif) : :![[thin space (1/6-em)]](https://www.rsc.org/images/entities/char_2009.gif) 1 1 |
8.01 | 25.7 |
F![[thin space (1/6-em)]](https://www.rsc.org/images/entities/char_2009.gif) : :![[thin space (1/6-em)]](https://www.rsc.org/images/entities/char_2009.gif) Fe = 5 Fe = 5![[thin space (1/6-em)]](https://www.rsc.org/images/entities/char_2009.gif) : :![[thin space (1/6-em)]](https://www.rsc.org/images/entities/char_2009.gif) 1 1 |
5.10 | 21.3 |
To further research the influence of different F![[thin space (1/6-em)]](https://www.rsc.org/images/entities/char_2009.gif) :
:![[thin space (1/6-em)]](https://www.rsc.org/images/entities/char_2009.gif) Fe, the phase and crystalline orientations of 1
Fe, the phase and crystalline orientations of 1![[thin space (1/6-em)]](https://www.rsc.org/images/entities/char_2009.gif) :
:![[thin space (1/6-em)]](https://www.rsc.org/images/entities/char_2009.gif) 1, 3
1, 3![[thin space (1/6-em)]](https://www.rsc.org/images/entities/char_2009.gif) :
:![[thin space (1/6-em)]](https://www.rsc.org/images/entities/char_2009.gif) 1, 5
1, 5![[thin space (1/6-em)]](https://www.rsc.org/images/entities/char_2009.gif) :
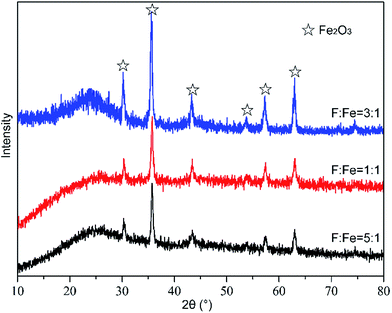
:![[thin space (1/6-em)]](https://www.rsc.org/images/entities/char_2009.gif) 1 were investigated by XRD analysis and presented in Fig. 5. It can be seen that peaks with strong intensity appear at 2θ = 30.33°, 35.74°, 43.41°, 53.78°, 57.39° and 63.06°. These diffraction peaks are matched to Fe2O3, which exists on the surface nano-carbon and is treated as an active component. As shown in the Fig. 5, the change of peak intensity of Fe2O3 could be used to investigate the influence of F
1 were investigated by XRD analysis and presented in Fig. 5. It can be seen that peaks with strong intensity appear at 2θ = 30.33°, 35.74°, 43.41°, 53.78°, 57.39° and 63.06°. These diffraction peaks are matched to Fe2O3, which exists on the surface nano-carbon and is treated as an active component. As shown in the Fig. 5, the change of peak intensity of Fe2O3 could be used to investigate the influence of F![[thin space (1/6-em)]](https://www.rsc.org/images/entities/char_2009.gif) :
:![[thin space (1/6-em)]](https://www.rsc.org/images/entities/char_2009.gif) Fe. When F
Fe. When F![[thin space (1/6-em)]](https://www.rsc.org/images/entities/char_2009.gif) :
:![[thin space (1/6-em)]](https://www.rsc.org/images/entities/char_2009.gif) Fe rose from 1
Fe rose from 1![[thin space (1/6-em)]](https://www.rsc.org/images/entities/char_2009.gif) :
:![[thin space (1/6-em)]](https://www.rsc.org/images/entities/char_2009.gif) 1 to 3
1 to 3![[thin space (1/6-em)]](https://www.rsc.org/images/entities/char_2009.gif) :
:![[thin space (1/6-em)]](https://www.rsc.org/images/entities/char_2009.gif) 1, the peak intensity of Fe2O3 increased with increasing F
1, the peak intensity of Fe2O3 increased with increasing F![[thin space (1/6-em)]](https://www.rsc.org/images/entities/char_2009.gif) :
:![[thin space (1/6-em)]](https://www.rsc.org/images/entities/char_2009.gif) Fe. It indicated that FeCl2 could turn into Fe2O3 with increasing of F
Fe. It indicated that FeCl2 could turn into Fe2O3 with increasing of F![[thin space (1/6-em)]](https://www.rsc.org/images/entities/char_2009.gif) :
:![[thin space (1/6-em)]](https://www.rsc.org/images/entities/char_2009.gif) Fe, and Fe2O3 could enhance the hydrolytic activity. However, the peak intensity of Fe2O3 reduced rapidly when F
Fe, and Fe2O3 could enhance the hydrolytic activity. However, the peak intensity of Fe2O3 reduced rapidly when F![[thin space (1/6-em)]](https://www.rsc.org/images/entities/char_2009.gif) :
:![[thin space (1/6-em)]](https://www.rsc.org/images/entities/char_2009.gif) Fe rose above 3
Fe rose above 3![[thin space (1/6-em)]](https://www.rsc.org/images/entities/char_2009.gif) :
:![[thin space (1/6-em)]](https://www.rsc.org/images/entities/char_2009.gif) 1. It indicated that high molar ratio of F
1. It indicated that high molar ratio of F![[thin space (1/6-em)]](https://www.rsc.org/images/entities/char_2009.gif) :
:![[thin space (1/6-em)]](https://www.rsc.org/images/entities/char_2009.gif) Fe was not conducive to the generation of Fe2O3. Therefore, F
Fe was not conducive to the generation of Fe2O3. Therefore, F![[thin space (1/6-em)]](https://www.rsc.org/images/entities/char_2009.gif) :
:![[thin space (1/6-em)]](https://www.rsc.org/images/entities/char_2009.gif) Fe could lead to the change of active component on the surface of nano-AC. The XRD results can confirm the analysis of above paragraph.
Fe could lead to the change of active component on the surface of nano-AC. The XRD results can confirm the analysis of above paragraph.
3.4 Influence of pH on catalytic hydrolysis of CS2
Generally, the saturation degree of solution was closely relative to the solution pH, which denotes OH− concentration and could obviously affect the formation of precursor of Fe3+ in the preparation processes of catalysts.31 Thus, the solution should be kept a suitable interval of supersaturation degree during the preparation process of catalysts. To further investigate the role of pH for catalytic activity, a series of Fe/nano-AC were prepared with different pH. In this section, the content of Fe was 0.2 mol L−1; F![[thin space (1/6-em)]](https://www.rsc.org/images/entities/char_2009.gif) :
:![[thin space (1/6-em)]](https://www.rsc.org/images/entities/char_2009.gif) Fe was 3
Fe was 3![[thin space (1/6-em)]](https://www.rsc.org/images/entities/char_2009.gif) :
:![[thin space (1/6-em)]](https://www.rsc.org/images/entities/char_2009.gif) 1; calcination temperature was 500 °C. The catalytic hydrolysis efficiency of CS2 over these catalysts are exhibited in Fig. 6. The results showed that CS2 removal efficiency initially increased and then decreased with increasing pH. The optimal pH is 5.1 and above 90% CS2 conversion last 540 min at least.
1; calcination temperature was 500 °C. The catalytic hydrolysis efficiency of CS2 over these catalysts are exhibited in Fig. 6. The results showed that CS2 removal efficiency initially increased and then decreased with increasing pH. The optimal pH is 5.1 and above 90% CS2 conversion last 540 min at least.
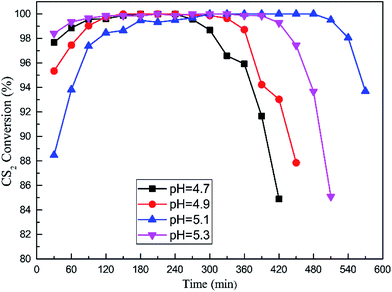 | ||
Fig. 6 Catalytic hydrolysis of CS2 over Fe/nano-AC modified by different pH (reaction conditions: 90 ppm CS2; GHSV = 10![[thin space (1/6-em)]](https://www.rsc.org/images/entities/char_2009.gif) 000 h−1; reaction temperature = 50 °C; RH = 11.8%). 000 h−1; reaction temperature = 50 °C; RH = 11.8%). | ||
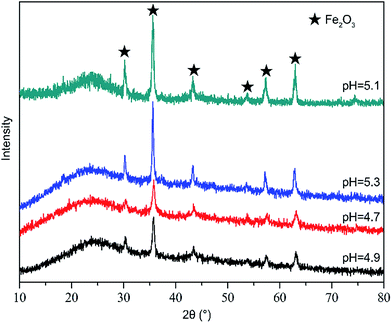
Table 4 showed the metal dispersion and Fe content (Fe2O3, wt%) on the surface of Fe/nano-AC modified by different pH. From Table 4, the metal dispersion was 1.14% when pH was 4.7. When pH was 5.1, the metal dispersion rose to 8.01%. When pH was high (above 5.3), the metal dispersion decreased from 8.01% to 6.80%. For pH < 5.1, the precursor of Fe3+ (Fe2O3) did not reach the saturation degree in the solution, which led to less Fe2O3 deposits on the surface nano-carbon than that at pH = 5.1. When pH was above 5.1, the saturation degree was excessive high. A large number of the precursor of Fe3+ (Fe2O3) precipitation formed in the solution and no continuous film was gained on surface nano-carbon. It agreed with previous study.31 In addition, the result of XRD in Fig. 7 also showed that the peak intensity of Fe2O3 initially increased and then decreased with increasing solution pH. It indicated that pH could lead to the change of the precursor of Fe3+ (Fe2O3) in the solution, which led to the change of Fe2O3 on the surface of catalyst. All of these factors which were discussed above would affect the activity of Fe/nano-AC on catalytic hydrolysis of CS2.
| Samples | Dispersion (%) | Fe content (Fe2O3, wt%) |
|---|---|---|
| pH = 4.7 | 1.14 | 11.3 |
| pH = 4.9 | 4.71 | 20.8 |
| pH = 5.1 | 8.01 | 25.7 |
| pH = 5.3 | 6.80 | 23.1 |
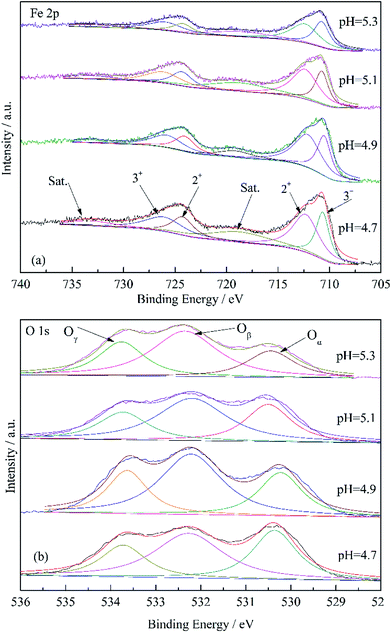
XPS analysis was performed to further clarify the influence of solution pH on catalytic hydrolysis of CS2. The Fe 2p XPS spectra of Fe/nano-AC modified by different pH (4.7, 4.9, 5.1 and 5.3) were showed in Fig. 8. Two obvious peaks of Fe 2p appeared at 710.75 eV and 724.34 eV.32 In addition, two shake-up satellites with binding energies of 718.65 eV and 733.31 eV were also clearly observed.33 All of these features are typical of Fe2O3. By analysis the content of Fe2+ and Fe3+, the Fe3+/(Fe2+ + Fe3+) ratios decreased according to the sequence: 75.1% (pH = 5.1) > 56.3% (pH = 4.9) > 54.7% (pH = 5.3) > 48.0% (pH = 4.7). It indicated that Fe3+ was conductive to the removal of CS2. Fig. 8 also showed the peak separation of the O 1s region for the different catalysts. The peaks of O 1s were composed of three overlapping peaks: the chemical adsorbed oxygen (531.3–532.3 eV, marked as Oα), the lattice oxygen (529.2–530.3 eV, marked as Oβ) and the adsorbed water species presser on the surface (532.7–533.5 eV, marked as Oγ).34–36 As shown in Fig. 8, the ratio of Oα/(Oα + Oβ + Oγ) over Fe/nano-AC at pH = 5.1 (32.6%) was higher than Fe/nano-AC at pH = 4.7 (25.5%), Fe/nano-AC at pH = 4.9 (28.2%) and Fe/nano-AC at pH = 5.3 (25.9%). It indicated that low O content was conducive to the removal of CS2. According to above analysis, it can be found that Fe3+ and O groups was the main factors that affected the catalytic activity: Fe3+ affected the catalytic hydrolysis activity and O groups affected the oxidation activity.
3.5 Influence of calcination temperatures on catalytic hydrolysis of CS2
As an important process of catalyst preparation, the calcination temperature has a great influence on the activation, grain distribution, and formation of catalysts. The crystallinity and oxidation states can be changed at different calcination temperatures. Fig. 9 showed the influence of calcination temperatures on the catalytic hydrolysis of CS2 over the Fe/nano-AC. In this section, the content of Fe was 0.2 mol L−1; F![[thin space (1/6-em)]](https://www.rsc.org/images/entities/char_2009.gif) :
:![[thin space (1/6-em)]](https://www.rsc.org/images/entities/char_2009.gif) Fe was 3
Fe was 3![[thin space (1/6-em)]](https://www.rsc.org/images/entities/char_2009.gif) :
:![[thin space (1/6-em)]](https://www.rsc.org/images/entities/char_2009.gif) 1; pH was 5.1. The results showed that the optimal calcination temperature is 500 °C for the catalytic hydrolysis of CS2. When the calcination temperature was above 600 °C, the CS2 conversion efficiency reduced sharply. The surface oxidation of transition metals could be affected by the calcinations temperature. At low temperature (below 500 °C in this work), the final hydrolysis product (H2S) might be oxidized into sulfate species and sulfur, which damaged hydrolysis active sites due to that the oxidizing nature of peroxy radicals may occur.37 In addition, it suggested that there is a certain relationship between the activity and the crystallinity of the oxidation state.
1; pH was 5.1. The results showed that the optimal calcination temperature is 500 °C for the catalytic hydrolysis of CS2. When the calcination temperature was above 600 °C, the CS2 conversion efficiency reduced sharply. The surface oxidation of transition metals could be affected by the calcinations temperature. At low temperature (below 500 °C in this work), the final hydrolysis product (H2S) might be oxidized into sulfate species and sulfur, which damaged hydrolysis active sites due to that the oxidizing nature of peroxy radicals may occur.37 In addition, it suggested that there is a certain relationship between the activity and the crystallinity of the oxidation state.
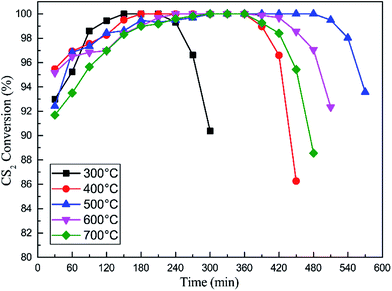 | ||
Fig. 9 Catalytic hydrolysis of CS2 over Fe/nano-AC modified by different calcination temperatures (reaction conditions: 90 ppm CS2; GHSV = 10![[thin space (1/6-em)]](https://www.rsc.org/images/entities/char_2009.gif) 000 h−1; reaction temperature = 50 °C; RH = 11.8%). 000 h−1; reaction temperature = 50 °C; RH = 11.8%). | ||
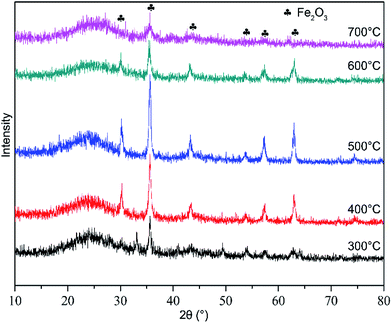
In order to further explain the influence of different calcination temperatures, the phase and crystalline orientations of 300 °C, 400 °C, 500 °C, 600 °C and 700 °C were investigated by XRD analysis and presented in Fig. 10. It can be seen that peaks with strong intensity appear at 2θ = 30.33°, 35.74°, 43.41°, 53.78°, 57.39° and 63.06°. The peak intensity of Fe2O3 increased with increasing calcination temperatures from 300 °C to 500 °C. Fe2O3 can enhance the hydrolytic activity. However, the peak intensity of Fe2O3 reduced rapidly when the temperature rose steadily to above 600 °C. It indicated that high calcination temperature was not conducive to the generation of Fe2O3. The reason is that dispersion of metal oxide particles on the surface of catalysts were damaged when the calcination temperature was excessive high, and the activity of catalyst could be decreased due to reunion and sintering.38 In addition, it would be occur that the pore structure of Fe/nano-AC was changed. We further confirmed this point according to the BET results.
Fig. 11a showed the nitrogen adsorption isotherms of some typical samples. The structural parameters were displayed in Table 5. According to the IUPAC classification, these samples exhibited an adsorption isotherms of type IV. It indicated that the samples were predominantly mesoporous materials. Meanwhile, the N2 adsorption capacity of Fe/nano-AC (500 °C) was highest among the four catalysts. It can be concluded that the calcination temperature affected the surface area and pore volume. It showed similar distribution patterns for all the samples in Fig. 11b. It can be observed that the Fe/nano-AC (500 °C) has more pores with a radius of 5–10 nm than that of others catalysts. This results suggest that more pore sizes of 5–10 nm play an important role in CS2 catalytic hydrolysis reactions. As mentioned above, the hydrolysis activity of the Fe/nano-AC was improved due to a large amount of pores (5–10 nm) at a calcination temperature of 500 °C.
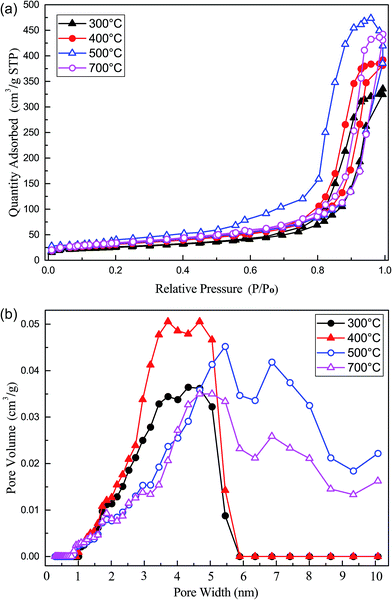 | ||
| Fig. 11 (a) Nitrogen adsorption isotherms and (b) pore size distribution for Fe/nano-AC modified by different calcination temperatures. | ||
| Samples | Surface area (m2 g−1) | Total pore volume (cm3 g−1) | Average pore diameter (nm) |
|---|---|---|---|
| Fe/nano-AC(300 °C) | 313 | 0.19 | 3.22 |
| Fe/nano-AC(400 °C) | 404 | 0.26 | 3.34 |
| Fe/nano-AC(500 °C) | 381 | 0.32 | 3.26 |
| Fe/nano-AC(700 °C) | 397 | 0.29 | 2.61 |
In our previous study, the reason for the deactivation of catalyst was the consumption of metal oxides (active compounds) and the generation of sulfate on the surface.4,39 The consumption of metal oxides led to the decrease of catalytic hydrolysis activity. The sulfate covered the adsorptive and catalytic active sites, which decreased the adsorptive and catalytic hydrolysis activities of catalyst. In these process, H2S was oxidized into S/SO42− and Fe2O3 was oxidized into Fe2(SO4)3. In the future research, the mechanism of deactivation and catalyst regeneration will be further studied.
4. Conclusions
A series of nano-carbon based catalysts loaded metal oxides were prepared via liquid phase deposition, and used for low temperature catalytic hydrolysis of carbon disulfide (CS2). The influences of preparation conditions for catalytic activity were investigated. These factors included species and content of metal oxides, ratio of F![[thin space (1/6-em)]](https://www.rsc.org/images/entities/char_2009.gif) :
:![[thin space (1/6-em)]](https://www.rsc.org/images/entities/char_2009.gif) Fe, solution pH, and calcination temperature. Fe/nano-AC showed high efficiency on removal CS2. The results showed that Fe/nano-AC with 0.2 mol L−1 Fe ion after calcining at 500 °C had good catalytic activity for the catalytic hydrolysis of CS2. Furthermore, the catalytic hydrolysis activity could be up to the best with the optimum preparation conditions of ratio of F
Fe, solution pH, and calcination temperature. Fe/nano-AC showed high efficiency on removal CS2. The results showed that Fe/nano-AC with 0.2 mol L−1 Fe ion after calcining at 500 °C had good catalytic activity for the catalytic hydrolysis of CS2. Furthermore, the catalytic hydrolysis activity could be up to the best with the optimum preparation conditions of ratio of F![[thin space (1/6-em)]](https://www.rsc.org/images/entities/char_2009.gif) :
:![[thin space (1/6-em)]](https://www.rsc.org/images/entities/char_2009.gif) Fe was 3
Fe was 3![[thin space (1/6-em)]](https://www.rsc.org/images/entities/char_2009.gif) :
:![[thin space (1/6-em)]](https://www.rsc.org/images/entities/char_2009.gif) 1, and solution pH was 5.1. Metal species affected the catalytic hydrolysis of CS2 and the oxidation of H2S. The solution pH and fluoride significantly affected the generation and formation of Fe3+ (Fe2O3). XRD results revealed that the formation of the crystalline phase of Fe2O3 was controlled by the calcination temperature. In addition, the BET results showed that the hydrolysis activity of the catalyst was affected by the amount of pores (5–10 nm). Future research will include the impact of potential poisonous pollutants in yellow phosphorus tail gas.
1, and solution pH was 5.1. Metal species affected the catalytic hydrolysis of CS2 and the oxidation of H2S. The solution pH and fluoride significantly affected the generation and formation of Fe3+ (Fe2O3). XRD results revealed that the formation of the crystalline phase of Fe2O3 was controlled by the calcination temperature. In addition, the BET results showed that the hydrolysis activity of the catalyst was affected by the amount of pores (5–10 nm). Future research will include the impact of potential poisonous pollutants in yellow phosphorus tail gas.
Conflicts of interest
There are no conflicts to declare.Acknowledgements
This work was supported by the National Natural Science Foundation of China [51408282, 21667015]; China Scholarship Council [201508530017, 201608530169 and 201608740011] and the Analysis and Testing Foundation of Kunming University of Science and Technology.Notes and references
- T. J. Bandosz and Q. Le, Carbon, 1998, 36, 39–44 CrossRef CAS.
- A. Bagreev and T. J. Bandosz, Carbon, 2001, 39, 2303–2311 CrossRef CAS.
- K. Li, X. Song, P. Ning, H. Yi, X. Tang and C. Wang, Energy Technol., 2015, 3, 136–144 CrossRef CAS.
- X. Song, P. Ning, C. Wang, K. Li, L. Tang, X. Sun and H. Ruan, Chem. Eng. J., 2017, 314, 418–433 CrossRef CAS.
- A. Bagreev, F. Adib and T. J. Bandosz, Carbon, 2001, 39, 1897–1905 CrossRef CAS.
- K. Sakanishi, Z. H. Wu, A. Matsumura, I. Saito, T. Hanaoka, T. Minowa, M. Tada and T. Iwasaki, Catal. Today, 2005, 104, 94–100 CrossRef CAS.
- Z. Y. Xie, F. Wang, N. Zhao, W. Wei and Y. H. Sun, Appl. Surf. Sci., 2011, 257, 3596–3602 CrossRef CAS.
- H. H. Yi, K. Li, X. L. Tang, P. Ning, J. H. Peng, C. Wang and D. He, Chem. Eng. J., 2013, 230, 220–226 CrossRef CAS.
- C. C. Huang, C. H. Chen and S. M. Chu, J. Hazard. Mater., 2006, 136, 866–873 CrossRef CAS PubMed.
- Y. H. Xiao, S. D. Wang, D. Y. Wu and Q. Yuan, Sep. Purif. Technol., 2008, 59, 326–332 CrossRef CAS.
- A. Bagreev, J. A. Menendez, I. Dukhno, Y. Tarasenko and T. J. Bandosz, Carbon, 2004, 42, 469–476 CrossRef CAS.
- A. Sahibed-Dine, A. Aboulayt, M. Bensitel, A. B. M. Saad, M. Daturi and J. C. Lavalley, J. Mol. Catal. A: Chem., 2000, 162, 125–134 CrossRef CAS.
- Q. Li, H. Yi, X. Tang, S. Zhao, B. Zhao, D. Liu and F. Gao, Chem. Eng. J., 2016, 284, 103–111 CrossRef CAS.
- X. Sun, P. Ning, X. Tang, H. Yi, K. Li, D. He, X. Xu, B. Huang and R. Lai, J. Energy Chem., 2014, 23, 221–226 CrossRef CAS.
- H. Wang, H. Yi, P. Ning, X. Tang, L. Yu, D. He and S. Zhao, Chem. Eng. J., 2011, 166, 99–104 CrossRef CAS.
- Y. H. Yue, X. P. Zhao, W. M. Hua and Z. Gao, Appl. Catal., B, 2003, 46, 561–572 CrossRef CAS.
- P. D. Clark, N. I. Dowling and M. Huang, Appl. Catal., B, 2001, 31, 107–112 CrossRef CAS.
- H. H. Yi, D. He, X. L. Tang, H. Y. Wang, S. Z. Zhao and K. Li, Fuel, 2012, 97, 337–343 CrossRef CAS.
- P. Ning, K. Li, H. H. Yi, X. L. Tang, J. H. Peng, D. He, H. Y. Wang and S. Z. Zhao, J. Phys. Chem. C, 2012, 116, 17055–17062 CAS.
- J. J. Schneider, Adv. Mater., 2001, 13, 529–533 CrossRef CAS.
- V. K. Gupta, N. Atar, M. L. Yola, Z. Ustundag and L. Uzun, Water Res., 2014, 48, 210–217 CrossRef CAS PubMed.
- Y. Li, X. Li, J. Chu, C. K. Dong, J. Y. Qi and Y. X. Yuan, Environ. Pollut., 2010, 158, 2317–2323 CrossRef CAS PubMed.
- H. Tian, J. J. Li, Q. Shen, H. L. Wang, Z. P. Hao, L. D. Zou and Q. Hu, J. Hazard. Mater., 2009, 171, 459–464 CrossRef CAS PubMed.
- J. M. Kim, S. M. Chang, S. Kim, K. S. Kim, J. Kim and W. S. Kim, Ceram. Int., 2009, 35, 1243–1247 CrossRef CAS.
- J. H. Wu, X. S. Li, Y. Zhao, W. P. Zhang, L. Guo and Y. Q. Feng, J. Chromatogr. A, 2011, 1218, 2944–2953 CrossRef CAS PubMed.
- T. Ohno, K. Numakura, H. Itoh, H. Suzuki and T. Matsuda, Adv. Powder Technol., 2011, 22, 390–395 CrossRef CAS.
- S. A. M. Samsuri, M. Y. A. Rahman, A. A. Umar and M. M. Salleh, J. Alloys Compd., 2015, 623, 460–465 CrossRef CAS.
- Q. Y. Li, R. N. Wang, Z. R. Nie, Z. H. Wang and Q. Wei, J. Colloid Interface Sci., 2008, 320, 254–258 CrossRef CAS PubMed.
- S. Deki, Y. Aoi, J. Okibe, H. Yanagimoto, A. Kajinami and M. Mizuhata, J. Mater. Chem., 1997, 7, 1769–1772 RSC.
- C. Rhodes, S. A. Riddel, J. West, B. P. Williams and G. J. Hutchings, Catal. Today, 2000, 59, 443–464 CrossRef CAS.
- H. Pizem and C. N. Sukenik, Chem. Mater., 2002, 14, 2476–2485 CrossRef CAS.
- L. Lian, L. R. Hou, L. Zhou, L. S. Wang and C. Z. Yuan, RSC Adv., 2014, 4, 49212–49218 RSC.
- Y. F. Liu, J. M. Xu, X. Y. Qin, H. X. Xin, X. Q. Yuan, J. Zhang, D. Li and C. J. Song, J. Mater. Chem. A, 2015, 3, 9682–9688 CAS.
- J. C. Dupin, D. Gonbeau, P. Vinatier and A. Levasseur, Phys. Chem. Chem. Phys., 2000, 2, 1319–1324 RSC.
- Y. Eom, S. H. Jeon, T. A. Ngo, J. Kim and T. G. Lee, Catal. Lett., 2008, 121, 219–225 CrossRef CAS.
- L. Chen, J. H. Li and M. F. Ge, Chem. Eng. J., 2011, 170, 531–537 CrossRef CAS.
- L. Wang, D. Y. Wu, S. D. Wang and Q. Yuan, J. Environ. Sci., 2008, 20, 436–440 CrossRef CAS.
- Q. Zhang, I. Lee, J. B. Joo, F. Zaera and Y. Yin, Acc. Chem. Res., 2013, 46, 1816–1824 CrossRef CAS PubMed.
- H. H. Yi, H. Dan, X. L. Tang, H. Y. Wang, S. Z. Zhao and K. Li, Fuel, 2012, 97, 337–343 CrossRef CAS.
| This journal is © The Royal Society of Chemistry 2017 |

