DOI:
10.1039/C7RA06823A
(Paper)
RSC Adv., 2017,
7, 37139-37147
A study on the crystallization behavior and mechanical properties of poly(ethylene terephthalate) induced by chemical degradation nucleation
Received
19th June 2017
, Accepted 13th July 2017
First published on 26th July 2017
Abstract
In order to overcome the low crystallization rate of poly(ethylene terephthalate) (PET), bicyclo[2.2.1]heptane-2,3-dicarboxylic acid disodium salt (HPN-68L), a highly active organic nucleating agent for polypropylene, was selected to replace the special nucleating agent of PET to improve PET crystallization due to its carboxylate anion structure, which usually shows a high induced nucleation ability for PET. The crystallization and properties of the composites were systematically investigated. It was found that HPN-68L had a significant nucleation effect on PET. The crystallization temperature and the nucleation efficiency of PET was increased by approximately 14 °C and 68.4%, respectively at a very low content of 0.6 wt% HPN-68L. Moreover, the half-time of crystallization and isothermal crystallization activation energy decreased upon the addition of HPN-68L. The long period of PET decreased and the number of spherulites increased after adding HPN-68L, while the crystal form of PET did not change. In addition, the nucleation mechanism of HPN-68L induced PET crystallization was studied and a chemical degradation nucleation mechanism was proposed. The flexural strength and modulus of PET were improved, whereas the impact strength decreased to a certain extent upon the addition of HPN-68L.
1 Introduction
Poly(ethylene terephthalate) (PET) is one of the most widely used semi-crystalline thermoplastic polyesters in several areas, such as beverage bottles, fibers, and packaging films because of its excellent mechanical, physical, and chemical properties.1–5 Nevertheless, its use in injection moulding compounds has so far been restricted because its crystallization rate is so slow that it prolongs the molding cycle.6–8 Therefore, increasing the crystallization rate of PET is one of the main directions for PET modification.9,10
It is widely believed that the addition of a nucleating agent is one of the main methods used to improve the crystallization rate of polymers.11,12 A series of inorganic, organic and polymer nucleating agents have been developed. However, organic nucleating agents have attracted more attention due to their extremely high nucleation efficiency resulting from their better compatibility compared to inorganic and polymer nucleating agents.13 Sodium benzoate was one of the earliest organic nucleating agents developed, but it reduced the mechanical and thermal properties of PET.14,15 Subsequently, some long alkyl chain organic carboxylate and bisamide compounds, such as Aclyn285 (Honeywell, America) and Surlyn8920 (Dupont, America), Licomont NaV101, were reported to improve the PET crystallization ability in industrial fields. Generally, as a nucleating agent, it is required for its melting point to be higher than that of the polymer.16,17 However, the melting temperature of these nucleating agents is lower than that of PET (for example, the melting point of Licomont NaV101 is 170 °C), which results in some difficulties in their application. Therefore, we think it is significant to screen PET nucleating agents with high melting points from mass-product nucleating agents, which have been developed for other polymers to meet the needs of PET industrial applications.
Bicyclo[2.2.1]heptane-2,3-dicarboxylic acid disodium salt (HPN-68L)18–21 is a highly active polypropylene nucleating agent with mass-produce and high melting point at 265 °C,22–24 which has good thermal stability and is commercially available. We deduced that it should promote PET crystallization because it has an organic carboxylic acid sodium salt functional group.25 However, there are no reports on inducing PET crystallization with HPN-68L. Hereby this study aims to understand the effect of HPN-68L, as a nucleating agent, on the crystallization and mechanical properties of PET. The crystal structure of the PET/HPN-68L blend system was identified using wide angle X-ray diffraction (WAXD) and small angle X-ray diffraction (SAXS). In addition, the nucleation mechanism of HPN-68 was elucidated and the mechanical properties of PET/HPN-68L blends were also investigated.
2 Experimental
2.1 Materials and sample preparation
Poly(ethylene terephthalate) (PET) used in this study was CB-602 supplied in pellet form from Far Eastern Industries (Shanghai, China). The intrinsic viscosity of PET measured in phenol/1,1,2,2-tetrachloroethane (1![[thin space (1/6-em)]](https://www.rsc.org/images/entities/char_2009.gif) :
:![[thin space (1/6-em)]](https://www.rsc.org/images/entities/char_2009.gif) 1 by mass) was 0.82 dL g−1, corresponding to a viscosity average molecular weight of 2.4 × 10⁴ g mol−1. Bicyclo[2.2.1]heptane-2,3-dicarboxylic acid disodium salt (Hyperform HPN-68L) was purchased from Milliken Co. USA with a melting range from 255 °C to 265 °C, bulk density of 0.28 g cm−3 and average diameter of 10 μm. The chemical structure of HPN-68L26 is shown in Fig. 1.
1 by mass) was 0.82 dL g−1, corresponding to a viscosity average molecular weight of 2.4 × 10⁴ g mol−1. Bicyclo[2.2.1]heptane-2,3-dicarboxylic acid disodium salt (Hyperform HPN-68L) was purchased from Milliken Co. USA with a melting range from 255 °C to 265 °C, bulk density of 0.28 g cm−3 and average diameter of 10 μm. The chemical structure of HPN-68L26 is shown in Fig. 1.
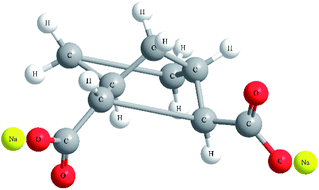 |
| | Fig. 1 The chemical structure of HPN-68L. | |
The PET pellets and HPN-68L were dried at 160 °C under vacuum for 12 h, and then blends of PET and HPN-68L in ratios of 100/0, 99.8/0.2, 99.6/0.4 and 99.0/1.0 (wt/wt) were mixed using a co-rotating twin-screw extruder (type SJZS-10A, China) at a screw speed of 20 rpm. The temperature profiles were 265–270–270–265 °C from the hopper to the die. The standard specimens were obtained using a plastic injection moulding machine (type SZS-15, China). The temperature of the injection moulding was 265 °C, and the mould temperature was 35 °C.
2.2 Characterization and measurements
A TA differential scanning calorimeter (DSC) Q20 (TA, USA) was used to investigate the melting and crystallization behavior. Before testing, the temperature and energy readings were calibrated with indium. All the DSC measurements were carried out under a nitrogen atmosphere at a flow rate of 50 mL min−1, and the samples for all measurements were 4–6 mg. During non-isothermal crystallization, the samples were first heated from room temperature to 280 °C at a heating rate of 20 °C min−1 and held for 3 min to eliminate any thermal history. Subsequently, they were cooled to 35 °C and heated back to 280 °C at a heating rate of 10 °C min−1 to explore their non-isothermal crystallization and melting behavior. During the isothermal crystallization process, the samples were first annealed at 280 °C for 3 min to erase any thermal history and then cooled to the selected crystallization temperature (Tc) at the fastest cooling rate. After completion of the crystallization process, the blends were heated again at 10 °C min−1 until completely melted.
The self-nucleation (SN) procedure that was employed for DSC scanning of all the PET samples was as follows and is shown in Fig. 2: (i) heated from 35 °C to 280 °C at 20 °C min−1 and held at this temperature for 3 min to erase any thermal history. (ii) Cooled from 280 °C to 35 °C at 10 °C min−1 and held for 3 min to create a “standard” thermal history. (iii) Heated from 35 °C to a pre-selected self-nucleation temperature (Ts) and held for 3 min. (iv) Cooled from Ts to 35 °C at 10 °C min−1 and held for 3 min. (v) Heated from 35 °C to melt at 10 °C min−1. The aforementioned five steps were repeated at different Ts.
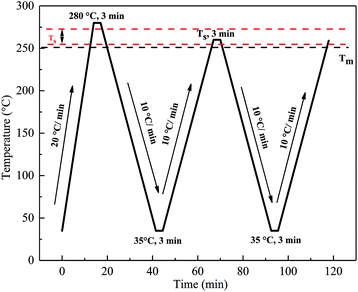 |
| | Fig. 2 The DSC thermal programs used for the self-nucleation treatment. | |
The relative viscosities (ηr) of PET and the PET/HPN-68L composites in a mixed solution of phenol (50 wt%) and 1,1,2,2-tetrachloroethane (50 wt%) were determined using a Ubbelohde viscometer with a capillary diameter of 0.8 mm at 25 ± 0.1 °C. The samples were accurately weighed, dissolved at concentration, C, up to 1 g dL−1 and filtered.
WAXD measurements were performed on a Rigaku D/MARX2200 PC diffractometer (Rigaku, Japan) in the 2θ range from 5° to 45° at a scanning rate of 2° min−1 at room temperature. The WAXD data were collected using Cu Kα radiation (λ = 1.542 Å). The voltage and current were set at 40 kV and 30 mA, respectively. SAXS was carried out on a Bruker D8 Discover at room temperature. The radiation source was graphite monochromatized Cu Kα (λ = 1.542 Å), and the X-ray source was set at a voltage of 30 kV and a current of 30 mA. The SAXS profiles were recorded in a 2θ range from 0.3° to 5° at a scanning rate of 0.25° min−1. Before the WAXD and SAXS test, the samples were isothermally treated at 220 °C for 1 h.
A LEICA DM2500P polarizing optical microscope (POM) (Germany) was used to observe the growth of the spherulites and spherulite morphologies of pure PET and the PET/HPN-68L blends. The sample was pressed into a film on a heating plate of 280 °C and cooled to room temperature. The obtained thin films were melted at 280 °C for 3 min, and the samples were cooled to 220 °C at a maximum cooling rate for isothermal crystallization and kept at this temperature for observation.
The flexural strength of the samples was evaluated using a GTM8050S micro-controlled electronic universal testing machine (China) and the notched impact strength of the samples was examined using an XJC-25ZD impact testing machine (China). All tests were carried out at room temperature and an average of 5 test runs were recorded for each sample.
3 Results and discussion
3.1 Non-isothermal crystallization
Fig. 3 represents the non-isothermal crystallization behavior of pure PET and PET/HPN-68L blends, and the corresponding parameters of the non-isothermal crystallization including the crystallization peak temperature (Tc), crystallization onset temperature (Tonset), melting peak temperature (Tm) and the degree of supercooling (Tm − Tc) are shown in Table 1. In addition, the degree of crystallinity (Xc) was calculated using eqn (1) and its values are also listed in Table 1.27| |
 | (1) |
where ΔHmc (J g−1) is the melting enthalpy of the second heating scan, H0m is the melting enthalpy of a 100% crystalline form of PET (117.6 J g−2),28 and θ is the weight fraction of filler. In general, for a polymer system containing a nucleating agent, a higher crystallization peak temperature indicates a lower degree of supercooling, which is highly desirable in industrial modulation processes as this will reduce the molding cycle and therefore accelerate the production rate.13 Clearly, from Fig. 3, a significant elevation in the crystallization peak temperature (Tc) of PET was observed with an increase from 203.9 °C to 218.0 °C when the HPN-68L content was increased from 0 to 0.6 wt%, reflecting a growth of 14.1 °C. In addition, the degree of the supercooling (Tm − Tc) values for PET and the blend samples with 0.6 wt% HPN-68L were 46.7 °C and 29.5 °C, respectively, implying that the addition of HPN-68L decreases the degree of supercooling. The degree of crystallinity (Xc) for PET increases by 17.2% upon the addition of 0.6% HPN-68L.
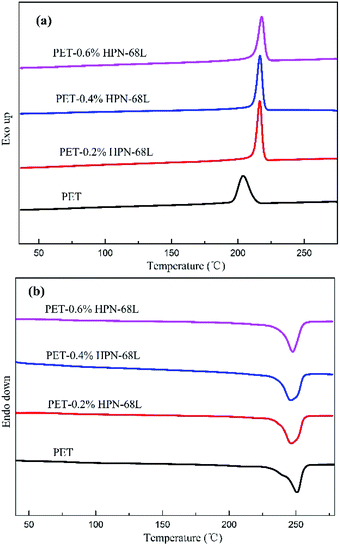 |
| | Fig. 3 The curves obtained for the (a) non-isothermal crystallization and (b) subsequent melting of pure PET and the PET/HPN-68L blends. | |
Table 1 The non-isothermal crystallization and melting parameters of pure PET and the PET/HPN-68L blends
| PET/HPN-68L (wt/wt%) |
Tc (°C) |
Tonset (°C) |
Tm (°C) |
ΔHmc (J g−2) |
Xc (%) |
Tc − Tm (°C) |
| 100/0 |
203.9 |
212.7 |
250.5 |
41.0 |
34.9 |
46.6 |
| 99.8/0.2 |
216.5 |
219.5 |
246.7 |
44.4 |
38.5 |
30.2 |
| 99.6/0.4 |
216.7 |
219.9 |
246.4 |
52.8 |
46.8 |
29.7 |
| 99.4/0.6 |
218.0 |
221.5 |
247.5 |
57.6 |
52.1 |
29.5 |
3.2 Nucleation efficiency
According to eqn (2) proposed by Fillon et al.,29 we can calculate the nucleation efficiency (NE) of HPN-68L.| |
 | (2) |
where tc,NA is the crystallization peak temperature of a polymer with the nucleating agent, tc1 is the crystallization peak temperature of the blank polymer, and tc2,max is the maximum crystallization peak temperature of the ideally self-nucleated pure polymer. To calculate the nucleation efficiency, determination of the self-nucleation crystallization temperature is required. The DSC cooling curve of pure PET after different heat treatments is shown in Fig. 4. It can be seen that the crystallization peak temperature of PET hardly changes in the thermal treatment temperature range of 258–260 °C, which means that the PET spherulites are in a state of complete melting in the range of 258–260 °C. The crystallization peak of PET begins to weaken when the thermal treatment temperature is below 255 °C, indicating that the majority of PET crystals are un-melted with self-nucleation and annealing taking place at the same time.30 When the thermal treatment temperature was in the range of 257–255 °C, the crystallization temperature of PET rises with a decrease in the thermal treatment temperature, meaning that only the self-nucleation of PET occurs during the cooling process. Therefore, the thermal treatment temperature of 257–255 °C was screened as the self-nucleated thermal treatment temperature region, 255 °C was selected as the self-nucleation thermal treatment temperature (Ts) of PET in this work and tc2,max was 225.9 °C. The nucleation efficiency (NE) values are shown in Fig. 5. The value of the NE initially increases but finally decreases upon increasing the amount of HPN-68L and a maximum NE value of 68.4% is acquired for the blend with an HPN-68L weight fraction of 0.6 wt%.
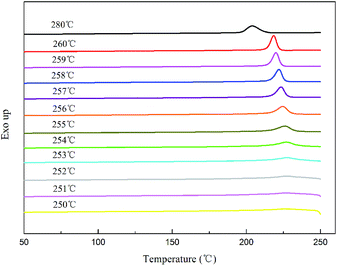 |
| | Fig. 4 The DSC cooling thermograms obtained for PET at different annealing temperatures. | |
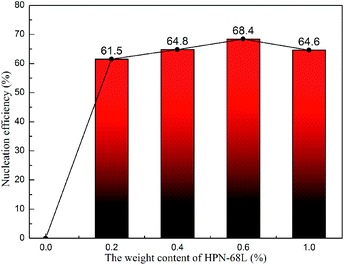 |
| | Fig. 5 The nucleation efficiency (NE) of HPN-68L for PET at various contents of HPN-68L. | |
3.3 Isothermal crystallization kinetics
To further explore the effects of the organic nucleating agent (HPN-68L) on the crystallization rate of PET, the Avrami equation was used to analyze the isothermal crystallization process,31 as shown in eqn (3).
Eqn (3) can also be rewritten in a double logarithmic form as follows.
| |
ln[−ln(1 − Xt)] = ln![[thin space (1/6-em)]](https://www.rsc.org/images/entities/char_2009.gif) k + n k + n![[thin space (1/6-em)]](https://www.rsc.org/images/entities/char_2009.gif) ln ln![[thin space (1/6-em)]](https://www.rsc.org/images/entities/char_2009.gif) t t
| (4) |
The half-time of crystallization (t1/2) can be calculated using eqn (5).
| |
 | (5) |
where
Xt is the relative crystallinity at time
t,
k is the crystallization rate constant and
n is the Avrami exponent, which is related to the nucleation and crystal growth mechanism. The values of
k and
n can be calculated using the slope and intercept of
eqn (4).
Fig. 6 shows that within a relative crystallinity range of 20–80%, log[−ln(1 −
Xt)] exhibits a good linearity against log(
t) for all the samples. However, a deviation can be identified in the relative crystallinity range greater than 80% or less than 20%, and the reason for the deviation was the non-linear growth patterns and impingement of the spherulites.
32 According to
Table 2, the
n values of PET and the PET/HPN-68L blends are non-integers in all cases due to the mixed growth or surface nucleation.
33
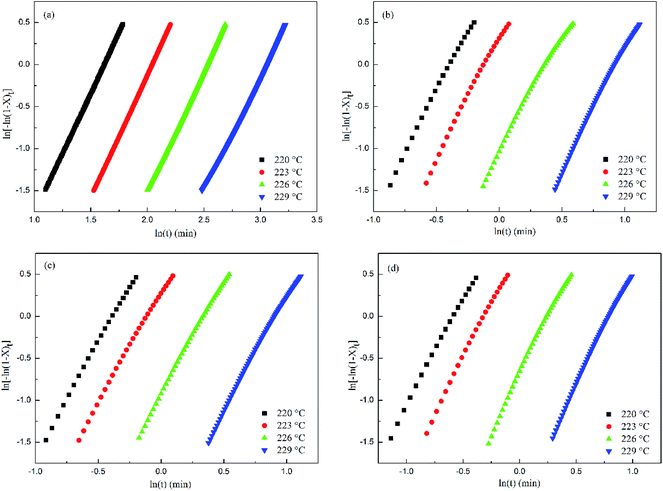 |
| | Fig. 6 Avrami analysis of the isothermal crystallization of PET and PET/HPN-68L blends with different weight fractions of HPN-68L: (a) 0 wt%, (b) 0.2 wt%, (c) 0.4 wt%, and (d) 0.6 wt%. | |
Table 2 The crystallization kinetic parameters of PET and PET/HPN-68L
| PET/HPN-68L (wt/wt%) |
Tc (°C) |
n |
k (min−n) |
t1/2 (min) |
1/t1/2 (min−1) |
Tm (°C) |
| 100/0 |
220 |
2.59 |
1.10 × 10⁻² |
4.95 |
0.20 |
247.5 |
| 223 |
2.49 |
7.07 × 10⁻³ |
6.31 |
0.16 |
249.1 |
| 226 |
2.47 |
5.78 × 10⁻³ |
6.94 |
0.14 |
250.4 |
| 229 |
2.55 |
1.50 × 10⁻³ |
11.09 |
0.09 |
251.6 |
| 99.8/0.2 |
220 |
2.49 |
1.56 × 100 |
0.72 |
1.38 |
246.3 |
| 223 |
2.66 |
8.09 × 10⁻¹ |
0.94 |
1.06 |
247.3 |
| 226 |
2.71 |
2.30 × 10⁻¹ |
1.50 |
0.67 |
248.7 |
| 229 |
2.89 |
3.04 × 10⁻² |
2.95 |
0.34 |
250.4 |
| 99.6/0.4 |
220 |
2.57 |
2.34 × 100 |
0.62 |
1.61 |
248.5 |
| 223 |
2.52 |
9.15 × 10⁻¹ |
0.90 |
1.12 |
249.4 |
| 226 |
2.68 |
2.40 × 10⁻¹ |
1.48 |
0.67 |
250.1 |
| 229 |
2.72 |
4.51 × 10⁻² |
2.73 |
0.37 |
251.0 |
| 99.4/0.6 |
220 |
2.63 |
3.55 × 100 |
0.54 |
1.86 |
247.0 |
| 223 |
2.66 |
1.69 × 100 |
0.72 |
1.40 |
247.7 |
| 226 |
2.90 |
3.12 × 10⁻¹ |
1.32 |
0.76 |
248.7 |
| 229 |
2.84 |
5.70 × 10⁻² |
2.41 |
0.42 |
249.8 |
In general, the reciprocal of t1/2 (1/t1/2) is one of the parameters used to characterize the polymer crystallization rate. A larger 1/t1/2 value indicates a faster crystallization rate. The values of t1/2 and 1/t1/2 are listed in Table 2, and the relationship between Tc and 1/t1/2 is shown in Fig. 7. It is clear that a higher HPN-68L content leads to a larger 1/t1/2 value. For example, the 1/t1/2 value of pure PET is 0.20 min−1 isothermally crystallized at 220 °C, while it increases to 1.86 min−1 after the incorporation of 0.6 wt% HPN-68L. It shows that the crystallization rate increases 9.2 times compared with that of pure PET.
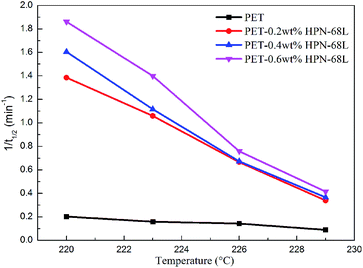 |
| | Fig. 7 The relationship of Tc and 1/t1/2 for pure PET and the PET/HPN-68L blends. | |
3.4 Equilibrium melting temperature and crystallization active energy
In order to further analyze the crystallization kinetics, the equilibrium melting point (T0m) and crystallization active energy (ΔEa) of the samples were estimated.34 According to the Hoffman–Weeks equation, the equilibrium melting temperature (T0m), the crystallization temperature (Tc) and the corresponding melting point (Tm) of samples have the following relationship:35| |
 | (6) |
where β is a constant related to the crystal structure and T0m can be determined by the extrapolation of the experimental melting point Tm versus Tc to the line Tm = Tc according to the eqn (6). The plots of the equilibrium melting temperature for PET and the PET/HPN-68L blends are shown in Fig. 8 and Table 3. We can observe that the equilibrium melting point of PET was 270.4 °C and the equilibrium melting temperature of the blends decreases when the content of HPN-68L increases, which implies that HPN-68L may cause the molecular weight of PET or the thickness of lamellar crystal to decrease (see part 3.5).
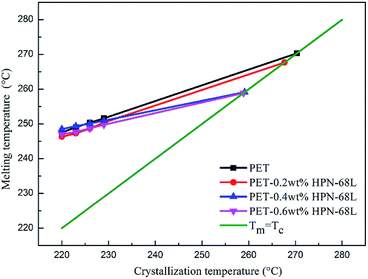 |
| | Fig. 8 The melting temperature of PET in the PET/HPN-68L blends versus the crystallization temperature. | |
Table 3 The values of T0m and ΔEa obtained for PET and the PET/HPN-68L blends
| PET/HPN-68L (wt/wt%) |
T0m (°C) |
ΔEa (kJ mol−1) |
| 100/0 |
270.4 |
−172.9 |
| 99.8/0.2 |
267.7 |
−316.8 |
| 99.6/0.4 |
259.2 |
−336.4 |
| 99.4/0.6 |
258.9 |
−347.5 |
The isothermal crystallization activation energy (ΔEa) can be calculated using the Arrhenius equation and its form is as follows.36
| |
 | (7) |
The eqn (7) is rewritten into a logarithmic form, as shown in the eqn (8).
| |
 | (8) |
where
k is a crystallization rate constant,
k0 is a temperature independent pre-exponential factor, and
R is the gas constant. As shown in
Fig. 9, a straight line can be obtained according to the Arrhenius equation and the slope of the straight line is −Δ
Ea/
R. The Δ
Ea values of the PET/HPN-68L blends are listed in
Table 3; the Δ
Ea of all the samples are negative because the crystallization process is exothermic.
37 The isothermal crystallization activation energy of pure PET was −172.9 kJ mol
−1, and the Δ
Ea of PET reduces to −347.5 kJ mol
−1 upon adding 0.6% HPN-68L, showing that the presence of HPN-68L significantly reduces the crystallization activation energy of the PET blends, which makes the PET chain segment to crystallize more easily and further accelerates the growth rate of the PET crystals.
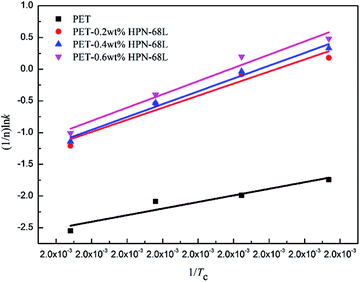 |
| | Fig. 9 The plots of (1/n)ln![[thin space (1/6-em)]](https://www.rsc.org/images/entities/char_2009.gif) k versus 1/Tc used for the determination of ΔEa. k versus 1/Tc used for the determination of ΔEa. | |
3.5 Intrinsic viscosity and nucleation mechanism
The intrinsic viscosity ([η]) of a polymer can be measured using a Ubbelohde viscometer. Generally, a decrease in the molecular weight may cause a decrease in the intrinsic viscosity of the polymer. The intrinsic viscosity was determined from the average of the two intercepts using the Huggins equation and Kraemer equation:38,39| |
 | (9) |
| |
 | (10) |
where ηr = t/t0; ηsp = ηr − 1; k and β are constants, and k is the Huggins constant.| |
 | (11) |
where C is the concentration of the solution and [η] is the intrinsic viscosity. According to eqn (11), two straight lines in the longitudinal coordinates intersect at one point and their common intercept is the intrinsic viscosity.
The viscosity average molecular weight (Mη) can be calculated using the Mark–Houwink equation:
| | |
[η] = KMηα (Mark–Houwink equation)
| (12) |
where
K and
α are the Mark–Houwink constants and their values are 2.1 × 10
−4 dL g
−1 and 0.82, respectively.
As shown in Table 4, the intrinsic viscosity and viscosity average molecular weight of PET decrease with an increase in the HPN-68L content. The decrease in the molecular weight of PET was mainly related to the chemical scissoring effect of the nucleation agent HPN-68L. As is known, HPN-68L is an organic carboxylic acid sodium salt. In its molten state, a chemical reaction40–42 may occur between the terminal group in the PET chains and carboxylic acid sodium of HPN-68L illustrated as Schemes 1 and 2. As shown, it can break down PET chains, which induces a decrease in the intrinsic viscosity and gives PET molecules an anionic group. At a higher temperature, this ionic group on the molecular chain ends tends to form a stable crystal nucleus of a certain size, which allows the subsequent nucleation and crystal growth to proceed, and thereby greatly shorten the crystallization induction period.41 On the other hand, the PET molecular chain breakage causes the decrease of the local molecular weight and promotes the crystallization rate of PET.43 As a brief conclusion, both the effects of enhanced nucleation and polymer chain scissoring from the nucleation agent synergistically improve the crystallization rate of PET.
Table 4 The intrinsic viscosity and viscosity average molecular weight of PET and the PET/HPN-68L blends with different weight fractions of HPN-68L
| PET/HPN-68L (wt/wt%) |
[η] (dL g−1) |
Mη (g mol−1) |
| 100/0 |
0.530 |
1.41 × 10⁴ |
| 99.8/0.2 |
0.505 |
1.31 × 10⁴ |
| 99.6/0.4 |
0.487 |
1.25 × 10⁴ |
| 99.4/0.6 |
0.444 |
1.12 × 10⁴ |
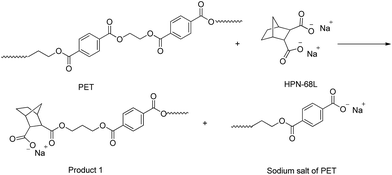 |
| | Scheme 1 | |
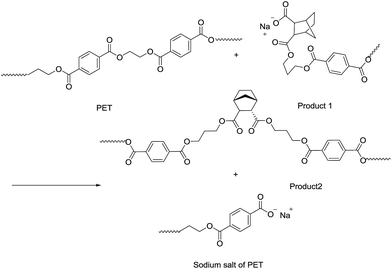 |
| | Scheme 2 | |
3.6 WAXD analysis
The X-ray diffractograms obtained for PET, HPN-68L and PET/HPN-68L blends are shown in Fig. 10. The main diffraction peaks were observed in pure PET at 2θ = 16.3°, 17.6°, 21.5°, 22.7°, 26.1°, 33.2° and 38.9°, which correspond to the (0![[1 with combining macron]](https://www.rsc.org/images/entities/char_0031_0304.gif) 1), (010), (
1), (010), (![[1 with combining macron]](https://www.rsc.org/images/entities/char_0031_0304.gif) 11), (
11), (![[1 with combining macron]](https://www.rsc.org/images/entities/char_0031_0304.gif) 10), (100), (
10), (100), (![[1 with combining macron]](https://www.rsc.org/images/entities/char_0031_0304.gif) 21) and (110) planes. Hence, the PET is a triclinic crystal and its molecular configuration is approximately planar.44 On one hand, the main diffraction peaks for all samples appear at nearly the same 2θ angle when content of HPN-68L is below 0.6 wt%, indicating that the addition of HPN-68L has a negligible effect on the crystal form of PET. On the other hand, a new diffraction peak appears at 2θ = 6.6° apart from the peak of PET at a higher HPN-68L loading of 0.6 and 1.0 wt%, which is attributed to HPN-68L. This may be explained by the agglomerated HPN-68L particles produced when its concentration is greater than 0.6 wt%.
21) and (110) planes. Hence, the PET is a triclinic crystal and its molecular configuration is approximately planar.44 On one hand, the main diffraction peaks for all samples appear at nearly the same 2θ angle when content of HPN-68L is below 0.6 wt%, indicating that the addition of HPN-68L has a negligible effect on the crystal form of PET. On the other hand, a new diffraction peak appears at 2θ = 6.6° apart from the peak of PET at a higher HPN-68L loading of 0.6 and 1.0 wt%, which is attributed to HPN-68L. This may be explained by the agglomerated HPN-68L particles produced when its concentration is greater than 0.6 wt%.
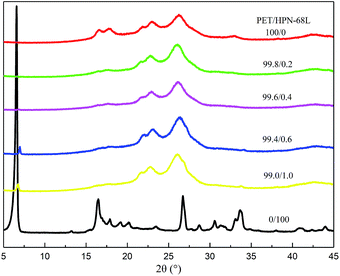 |
| | Fig. 10 WAXD curves for PET, HPN-68L and PET/HPN-68L blends. | |
3.7 SAXS analysis
The small-angle X-ray scattering (SAXS) technique can provide additional information on the structure of lamellae at a larger length scale. The measured SAXS scattering intensity of PET and the PET/HPN-68L blends was rectified using the Lorentz method, as illustrated in Fig. 11. It can be observed that there is an observable scattering peak in both pure PET and its blends, which indicates the existence of ordered structures. Adjacent lamellae spacing, i.e., long period (L), can be estimated using Bragg's law.| |
 | (13) |
| |
 | (14) |
where s is scattering vector, θ is half of the scattering angle and smax is the scattering vector corresponding to the SAXS peak. According to Fig. 11, compared with pure PET, the peak position shifts towards a higher angle upon increasing the HPN-68L content, implying that the long period decreases with the addition of HPN-68L according to Bragg's law analysis. For example, the long periods of PET and the blend samples with 1.0 wt% HPN-68L are 14.07 nm and 12.65 nm, respectively (as listed in Table 5).
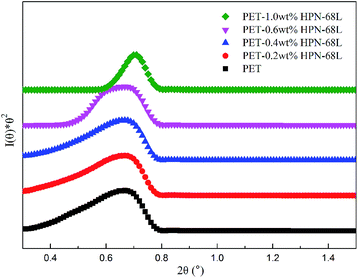 |
| | Fig. 11 The profiles of the Lorentz-corrected SAXS intensity of pure PET and the PET/HPN-68L blends. | |
Table 5 The 2θ and long period L of PET and the PET/HPN-68L blends with different weight fractions of HPN-68L
| PET/HPN-68L (wt/wt%) |
2θ (°) |
L (nm) |
| 100/0 |
0.628 |
14.07 |
| 99.8/0.2 |
0.641 |
13.78 |
| 99.6/0.4 |
0.655 |
13.48 |
| 99.4/0.6 |
0.662 |
13.34 |
| 99.4/1.0 |
0.698 |
12.65 |
3.8 Spherulite morphology
The spherulite morphologies of pure PET and the PET/HPN-68L blends isothermally crystallized at 220 °C for 30 min are shown in Fig. 12. A small part of spherulites appear in pure PET, and the nucleation density of the PET spherulites increases upon adding HPN-68L. In addition, the spherulites arrange more closely and the size is more uniform with HPN-68L content increasing.
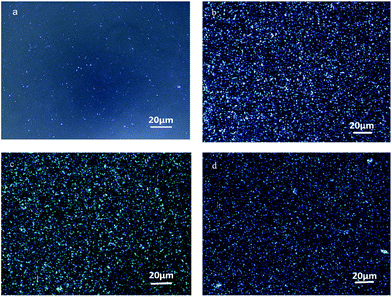 |
| | Fig. 12 The POM of the PET/HPN-68L blends with different weight fractions of HPN-68L: (a) 0 wt%, (b) 0.2 wt%, (c) 0.4 wt% and (d) 0.6 wt% isothermally crystallized at 220 °C for 30 min. | |
3.9 Mechanical properties of PET and PET/HPN-68L blends
The variations in the flexural strength and notched impact strength of the PET/HPN-68L blends are shown in Fig. 13 and 14. Clearly, when the HPN-68L content reached 0.6 wt%, the flexural strength of PET increased from 107.5 Mpa to 128.3, Mpa and the flexural modulus of PET increased by 54.9%, indicating the enhancement in the rigidity of the blend system. This change can be attributed to two aspects. On one hand, the flexural modulus of the composite is related to the proportion of the rigid parts, and the equation for the relationship between the modulus of materials is as follows:45| | |
E0 = Em(1 − Vf) + EfVf
| (15) |
where E0 is the modulus of the composite, Em is the modulus of the non-rigid portion, Ef is the modulus of the rigid portion and Vf is the volume fraction of rigid parts. When the proportion of the rigid part (the crystal part) increases (i.e., the degree of crystallinity), there is usually an evident increase in the modulus of the system.39 Therefore, the addition of HPN-68L significantly increases the crystallinity of PET, resulting in an increase in the flexural modulus of the PET/HPN-68L blends. On the other hand, the spherulite size of PET is more uniform upon adding HPN-68L, leading to the perfection of the crystal form and the more compact arrangement of the crystal, which is conducive to improving the flexural strength. In addition, pure PET shows a notched impact strength of 30.5 J m−1, and with the addition of 0.6 wt% HPN-68L, the value of the notched impact strength decreases to 22.9 J m−1 (as shown in Fig. 14), which is attributed to the decrease of PET molecular weight and partial degradation of PET.
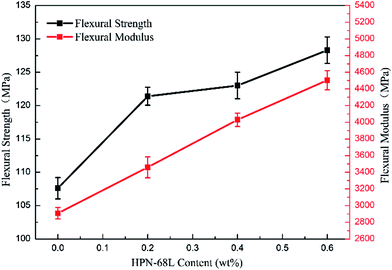 |
| | Fig. 13 The variation in the flexural strength of the PET/HPN-68L blends. | |
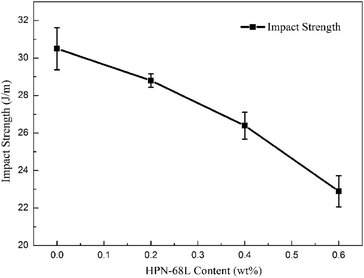 |
| | Fig. 14 The variation in the notched impact strength of the PET/HPN-68L blends. | |
4 Conclusions
HPN-68L is an effective nucleating agent for PET, which can markedly affect the crystallization behavior and mechanical properties of PET, and a chemical degradation nucleation mechanism was proposed. When the HPN-68L content reached 0.6 wt%, the crystallization temperature and nucleation efficiency of PET were reduced by 14.1 °C and 68.4%, respectively. During isothermal crystallization, the crystallization rate of PET increased, and the half-time of crystallization decreased upon increasing the HPN-68L content. Moreover, the long period of PET decreased and the spherulites arranged more closely as the HPN-68L content increased. The crystal structure of PET did not change with the addition of HPN-68L. What is noteworthy is that the flexural strength and flexural modulus increased with an increase in the HPN-68L content, but the impact strength decreased after the addition of HPN-68L due to the partial degradation of PET.
Acknowledgements
Financial support from the National Natural Science Foundation of China (Grant No. 51403210) is acknowledged.
Notes and references
- A. M. Al-Sabagh, F. Z. Yehia, G. Eshaq and A. E. ElMetwally, Ind. Eng. Chem. Res., 2015, 54(50), 12474–12481 CrossRef CAS.
- S. Tang and Z. Xin, Polymer, 2009, 50, 1054–1061 CrossRef CAS.
- T. Y. Tsai, B. Naveen, W. C. Shiu and S. W. Lu, RSC Adv., 2014, 4, 25683–25691 RSC.
- M. Kechadi, L. Chaal, V. Vivier, B. Tribollet and J. Gamby, Phys. Chem. Chem. Phys., 2016, 18, 20583–20590 RSC.
- N. Lotti, M. Colonna, M. Fiorini, L. Finelli and C. Berti, J. Appl. Polym. Sci., 2013, 128, 416–423 CrossRef CAS.
- J. Zhang, L. Wu, M. Zhao, J. Li and C. Wang, J. Appl. Polym. Sci., 2005, 96, 883–893 CrossRef CAS.
- H. G. Haubruge, R. Daussin, A. M. Jonas and R. Legras, Macromolecules, 2003, 36, 4452–4456 CrossRef CAS.
- Z. Y. Shen, F. L. Luo, X. M. Lei, L. J. Ji and K. Z. Wang, J. Polym. Res., 2016, 23(10), 1–10 CAS.
- J. Zhang, J. Appl. Polym. Sci., 2004, 91, 1657–1666 CrossRef CAS.
- J. B. Wang, C. Han, Y. Shen, X. Wu, F. Shen and Y. H. Cui, Elastomerics, 2008, 18(4), 48–51 Search PubMed.
- Y. Chen, M. Xu, Y. Y. Li and J. S. He, Acta Polym. Sin., 1999, 20, 8–14 Search PubMed.
- R. Y. Guo, D. F. Wei and H. Lu, Mater. Sci. Eng., 2003, 19, 121–124 CAS.
- N. Ma, S. Zeng, T. Hu, X. H. Gong, Z. Hu and C. G. Wu, Mater. Rev., 2016, 30(7), 1–9 Search PubMed.
- Y. X. Liu, L. M. Wu and W. J. Xie, Polym. Mater.: Sci. Eng., 1993, 9, 93–97 CAS.
- J. G. Shi, Z. J. Liu, M. H. Zhang, G. L. Zhao, Q. Z. Shi, W. T. Yang and L. M. Zhao, Mater. Sci. Technol. Rev., 2009, 27(16), 110–115 CAS.
- Y. P. Khanna, Macromolecules, 1993, 26(26), 3639–3643 CrossRef CAS.
- H. N. Beck, J. Appl. Polym. Sci., 1967, 11(5), 673–685 CrossRef CAS.
- X. E. Zhao and D. L. Dotson, US Pat. 6, 465, 551, October 15, 2002.
- M. J. Mannion, J. R. Jones and Milliken & Company, US Pat. 6, 946, 507, September 20, 2005.
- K. D. Lake Jr and B. C. Gandhi, US Pat. 6, 995, 202, February 7, 2006.
- X. E. Zhao and D. L. Dotson, US Pat. 6, 559, 211, May 6, 2003.
- Z. J. Liu, J. G. Shi, M. H. Zhang, G. L. Zhao and Y. Zhang, Sino-Global Energy, 2011, 16, 74–78 CAS.
- Y. F. Zhang, X. Li and X. S. Wei, e-Polym., 2010, 104, 1–7 Search PubMed.
- Y. F. Zhang, X. Z. Luo, Y. Chang, K. K. Zhang, Q. W. Wu, J. S. Li and C. H. Lu, China Plast. Ind., 2013, 41(3), 76–78 Search PubMed.
- S. D. Tang, Z. Xin and L. Zhang, China Plast., 2006, 20(11), 21–25 CAS.
- J. G. Shi, M. H. Zhang, G. L. Zhao, Z. J. Liu, Q. Z. Shi, L. M. Zhao and W. T. Yang, Synthetic Materials Aging and Application, 2011, 40(4), 46–52 Search PubMed.
- A. Durmus, N. Ercan, G. Soyubol, H. Deligöz and A. Kaşgöz, Polym. Compos., 2010, 31, 1056–1066 CAS.
- J. W. Chung, S. B. Son, S. W. Chun, T. J. Kang and S. Y. Kwak, J. Polym. Sci., Part B: Polym. Phys., 2008, 46, 989–999 CrossRef CAS.
- B. Fillon, B. Lotz, A. Thierry and J. C. Wittmann, J. Polym. Sci., Part B: Polym. Phys., 1993, 31(10), 1395–1405 CrossRef CAS.
- Z. Y. Shen, F. L. Luo, Q. Xing, P. F. Si, X. M. Lei, L. J. Ji, S. F. Ding and K. Z. Wang, CrystEngComm, 2016, 18, 2135–2143 RSC.
- Z. Y. Shen, F. L. Luo, H. C. Bai, P. F. Si, X. M. Lei, L. J. Ji, S. F. Ding and L. J. Ji, RSC Adv., 2016, 6, 17510–17518 RSC.
- J. Dou and Z. Liu, Polym. Int., 2013, 62, 1698–1710 CrossRef CAS.
- S. W. Kuo, S. C. Chan and F. C. Chang, Macromolecules, 2003, 36(17), 6653–6661 CrossRef CAS.
- P. Zou, S. Tang, Z. Fu and H. Xiong, Int. J. Therm. Sci., 2009, 48(4), 837–846 CrossRef CAS.
- J. D. Hoffman and J. J. Weeks, J. Res. Natl. Bur. Stand., Sect. A, 1962, 66(1), 13–18 CrossRef.
- S. C. Tjong, S. X. Chen and R. K. Y. Li, J. Appl. Polym. Sci., 1997, 64, 707–715 CrossRef CAS.
- J. Cai, M. Liu, L. Wang, K. Yao, S. Li and H. Xiong, Carbohydr. Polym., 2011, 86, 941–947 CrossRef CAS.
- M. Xanthos, B. C. Baltzis and P. P. Hsu, J. Appl. Polym. Sci., 1997, 64(7), 1423–1435 CrossRef CAS.
- D. H. Li, X. J. Ren, C. Y. Gu, R. X. Jing, X. C. Zeng and Z. Q. Yin, Synthetic Technology and Application, 2005, 20(3), 53–55 Search PubMed.
- R. Legras, C. Bailly, M. Daumerie, J. M. Dekoninck and J. P. Mercier, Polymer, 1984, 25, 835–844 CrossRef CAS.
- D. Garcia, J. Polym. Sci., Part B: Polym. Phys., 1984, 22(12), 2063–2072 CrossRef CAS.
- Y. W. Pang, Y. M. Jin and T. Y. Yu, Polym. Mater.: Sci. Eng., 1989, 5, 74–80 Search PubMed.
- M. Lei, Z. Z. Yu, Y. C. Ou and G. S. Yang, High Polymer Materials Science & Engineering, 2001, 17(2), 105–108 CAS.
- J. Font, J. Muntasell and E. Cesari, Mater. Res. Bull., 1999, 34(1), 157–165 CrossRef CAS.
- D. Y. Xu, Polymer Morphology and Processing, China Petrochemical Press, Beijing, 1992, p. 204 Search PubMed.
|
| This journal is © The Royal Society of Chemistry 2017 |
Click here to see how this site uses Cookies. View our privacy policy here.  Open Access Article
 ab,
Faliang Luo
 *ab,
Zhiyuan Shenab,
Xuejian Wuab and
Yaping Qiab
![[thin space (1/6-em)]](https://www.rsc.org/images/entities/char_2009.gif) :
:![[thin space (1/6-em)]](https://www.rsc.org/images/entities/char_2009.gif) 1 by mass) was 0.82 dL g−1, corresponding to a viscosity average molecular weight of 2.4 × 10⁴ g mol−1. Bicyclo[2.2.1]heptane-2,3-dicarboxylic acid disodium salt (Hyperform HPN-68L) was purchased from Milliken Co. USA with a melting range from 255 °C to 265 °C, bulk density of 0.28 g cm−3 and average diameter of 10 μm. The chemical structure of HPN-68L26 is shown in Fig. 1.
1 by mass) was 0.82 dL g−1, corresponding to a viscosity average molecular weight of 2.4 × 10⁴ g mol−1. Bicyclo[2.2.1]heptane-2,3-dicarboxylic acid disodium salt (Hyperform HPN-68L) was purchased from Milliken Co. USA with a melting range from 255 °C to 265 °C, bulk density of 0.28 g cm−3 and average diameter of 10 μm. The chemical structure of HPN-68L26 is shown in Fig. 1.


![[thin space (1/6-em)]](https://www.rsc.org/images/entities/char_2009.gif) k + n
k + n![[thin space (1/6-em)]](https://www.rsc.org/images/entities/char_2009.gif) ln
ln![[thin space (1/6-em)]](https://www.rsc.org/images/entities/char_2009.gif) t
t


![[1 with combining macron]](https://www.rsc.org/images/entities/char_0031_0304.gif) 1), (010), (
1), (010), (![[1 with combining macron]](https://www.rsc.org/images/entities/char_0031_0304.gif) 11), (
11), (![[1 with combining macron]](https://www.rsc.org/images/entities/char_0031_0304.gif) 10), (100), (
10), (100), (![[1 with combining macron]](https://www.rsc.org/images/entities/char_0031_0304.gif) 21) and (110) planes. Hence, the PET is a triclinic crystal and its molecular configuration is approximately planar.44 On one hand, the main diffraction peaks for all samples appear at nearly the same 2θ angle when content of HPN-68L is below 0.6 wt%, indicating that the addition of HPN-68L has a negligible effect on the crystal form of PET. On the other hand, a new diffraction peak appears at 2θ = 6.6° apart from the peak of PET at a higher HPN-68L loading of 0.6 and 1.0 wt%, which is attributed to HPN-68L. This may be explained by the agglomerated HPN-68L particles produced when its concentration is greater than 0.6 wt%.
21) and (110) planes. Hence, the PET is a triclinic crystal and its molecular configuration is approximately planar.44 On one hand, the main diffraction peaks for all samples appear at nearly the same 2θ angle when content of HPN-68L is below 0.6 wt%, indicating that the addition of HPN-68L has a negligible effect on the crystal form of PET. On the other hand, a new diffraction peak appears at 2θ = 6.6° apart from the peak of PET at a higher HPN-68L loading of 0.6 and 1.0 wt%, which is attributed to HPN-68L. This may be explained by the agglomerated HPN-68L particles produced when its concentration is greater than 0.6 wt%.


