 Open Access Article
Creative Commons Attribution 3.0 Unported Licence
Enhanced near room temperature magnetocaloric effect in La0.6Ca0.4MnO3 for magnetic refrigeration application†
Melissa H. M. Tsuia,
Devon T. Dryera,
Ahmed A. El-Gendy *abc and
Everett E. Carpenter*a
aDepartment of Chemistry, Virginia Commonwealth University, 1001 W. Main St., Richmond, VA 23284-2006, USA. E-mail: ecarpenter2@vcu.edu
bDepartment of Physics, University of Texas at El Paso, El Paso, TX 79968, USA. E-mail: aelgendy@utep.edu
cNanotechnology and Nanometrology Lab., National Institute for Standards (NIS), 136 Tersa St., Haram, Giza 12211, Egypt
First published on 2nd October 2017
Abstract
Perovskite manganite La0.6Ca0.4MnO3 (LCMO) nanomaterials were synthesized by a modified Pechini sol–gel process followed by high temperature sintering. Polyethylene glycol of various molecular weights was used to control the particle size and morphology of the materials. XRD and Scherrer analysis were used to confirm the crystal structure and crystallite size of the LCMO nanomaterials. The LCMO nanomaterials showed a paramagnetic to ferromagnetic transition at 277 K. The maximum change in entropy was calculated to be 19.3 J kg−1 K−1 for a field change of 0–3 T and 8.7 J kg−1 K−1 for a field change of 0–1 T, and the relative cooling power was determined to be 627 J kg−1. The La0.6Ca0.4MnO3 reported in this work demonstrated an enhanced magnetocaloric effect compared to the current literature. These results showed the LCMO nanomaterials to be an excellent candidate for magnetic refrigeration applications as they are less costly in comparison to Gd based compounds.
1 Introduction
There has been growing interest in the development of materials for magnetic refrigeration applications as they provide an environmentally friendly option to replace chlorofluorocarbons and hydrochlorofluorocarbons as refrigerants.1 Magnetic refrigeration (MR) technology is based on the magnetocaloric effect (MCE) where the cooling efficiency is dependent upon the relative cooling power (RCP) of the material.1,2 The MCE is a measure of thermal response to change in an external magnetic field.2 It is based on the thermodynamic correlation of reversible change in magnetic entropy in an isothermal process defined using the Maxwell relationship3 shown in eqn (1):
 | (1) |
Lanthanum based perovskite manganites can be synthesized by ball milling, floating zone, pulsed laser deposition, and sol–gel methods.6–9 Major advantages in obtaining nanomaterials via a sol–gel process include the ability to control the nucleation and growth steps resulting in large scale production of monodispersed particles in comparison to other methods. The sol–gel method in the synthesis of perovskite manganites typically involve the dissolution of metal precursor along with citric acid and polyethylene glycol (PEG) in water.10 The presence of citric acid and PEG allow the formation of metal chelate complexes within the solution catalysing the polymerization of the gel.10 In the perovskite manganites system, Wang et al. suggested that PEG polymer encapsulate the La(NO3)3 in controlling the nucleation and growth of particles by creating steric hindrance between the neighbouring monomers.11 In this work, we modified PEG chain length in the synthesis of the LCMO nanocomposites. Through this method, we report a significant enhancement in the magnetocaloric properties of the existing La0.6Ca0.4MnO3 material by varying the chain length of the PEG polymer.
2 Experimental section
Materials and methods
All reagents, lanthanum(III) nitrate hydrate (Alfa Aesar, 99%), calcium carbonate (Aldrich), manganese(II) acetate hydrate (Acros Organics, 99%), citric acid (VWR, ACS grade), polyethylene glycol 600, 2000 (Aldrich), 4000 (TCI America), and nitric acid (Fischer) were used without any further purification.La0.6Ca0.4MnO3 nanomaterial was prepared by a modified Pechini sol–gel method. In a typical reaction, 2.6 g of La(NO3)·xH2O, 0.4 g of CaCO3, and 2.5 g of Mn(CH3COO)2·4H2O were used as the metal precursor. The metal precursor, 0.5 g citric acid, and 0.5 g of various molecular weight polyethylene glycol (PEG) were dissolved in a 4 M nitric acid solution. The solution was heated to 70 °C for 6 h for the polymerization of the gel. The solution turns golden yellow initially and lightens to a pale yellow gel after 6 h. The resulting gel was calcinated at 900 °C to obtain the final black product.
Characterization
Crystal phase identification was performed using PANalytical MPD X'Pert Pro X-ray diffractometer (Cu Kα1 = 1.54 angstroms), and the X-ray diffraction (XRD) patterns were analysed using X'Pert HighScore Plus. Scanning electron microscopy (SEM) was completed on Hitachi SU-70 FE-SEM operating at 5 keV. Samples were prepared using colloidal graphite paste and sputtered with platinum. Transmission electron microscopy (TEM) was performed using Zeiss Libra 120 operating at 120 keV. Magnetic characterization was performed using Quantum Design Versalab physical property measurement system. Field cooled (FC) and zero field cooled (ZFC) magnetization (M–T) curve was measured from 50 to 400 K in 100 Oe external field. The temperature and field dependence of magnetization was measured from 50 to 300 K with a temperature increment of 5 K. Far-IR spectroscopy was performed using Nicolet Advanced iS50 FT-IR with an ATR attachment.3 Results and discussion
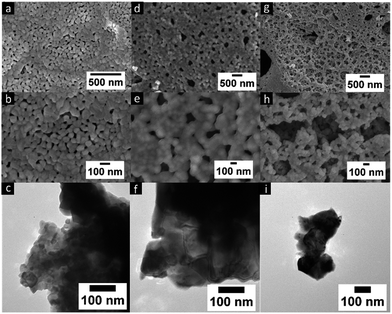
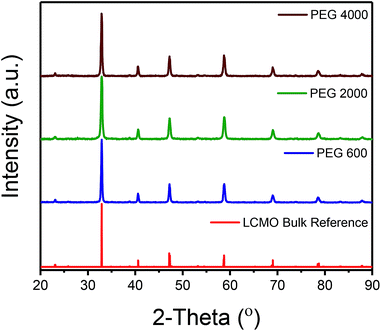
As mentioned previously, LCMO nanomaterials were synthesized using a modified sol–gel method by changing the chain length of the PEG polymer. It is well known that the presence of PEG in the sol–gel process assists in the polymerization of the gel as well as acts as a stabilizer and capping agent in particle formation.11 XRD phase characterization was performed for all LCMO samples as shown in Fig. 1. All samples yield 100% of orthorhombic perovskite crystalline crystal structure (reference PDF: 01-070-4067) as represented in Fig. 1 for the LCMO synthesized using the various PEG. The crystallite size of each sample was calculated using the Scherrer equation using the highest intensity peak at 32.9 2-theta. The crystallite sizes were determined to be 62.3, 33.8, and 57.1 nm for LCMO synthesized using PEG 600, 2000, and 4000 respectively. The LCMO synthesized using PEG 600 and 4000 resulted in larger crystallite size (∼60 nm) in comparison of the sample synthesized using PEG 2000. The morphology of all LCMO nanocomposites were examined under SEM analysis demonstrated in Fig. 2. The LCMO synthesized with PEG 2000 shows a lack of distinct particles and appears to be agglomerated. However, the LCMO particles obtained using PEG 600 and 4000 shows well defined particles with less agglomeration. In addition, TEM images shows similar morphologies for the three samples. Particles synthesized using PEG 600 consist of 42 ± 16 nm particles, whereas particles synthesized using PEG 2000 and PEG 4000 result in similar size particles; 67 ± 35 nm and 71.2 ± 41 nm, respectively. The observed particle size and calculated crystallite size from XRD patterns are in disagreement, suggesting polydispersity or agglomeration in particle distribution within the samples. The particles synthesized using PEG 600 appears to be the smallest of the three samples. This is due to the shorter PEG chain length provide better encapsulation during the gelation process, resulting in smaller particles. Observations of the SEM and TEM micrographs suggests that 42 nm particles synthesized using PEG 600 give rise to higher performance as a magnetocaloric material. | ||
| Fig. 2 SEM and TEM micrographs of particles at different magnifications synthesized using (a–c) PEG 600, (d–f) PEG 2000, (g–i) PEG 4000. | ||
The temperature and field dependence magnetization up to 3 T of the LCMO nanomaterials was measured using a commercial VSM. In order to study the magnetic properties of the LCMO nanomaterials, M–H curves at 5 K interval were obtained in order to calculate the change in magnetic entropy with respect to the temperature. The isothermal magnetization (M–H) curves shown in Fig. 3 were measured by warming the sample from 100 to 300 K in 5 degree increments. Fig. 4 shows the change in magnetic entropy (−ΔSM) for the LCMO samples calculated using eqn (1) and data from Fig. 3. As indicated in Fig. 4, the overall maximum entropy increases as the external field increases. In addition, Fig. 4 reveals that the LCMO sample synthesized using PEG 600 and 4000 result in the high −ΔSM values of 19.3 J kg−1 K−1 and 17.7 J kg−1 K−1 at 3 T. Banerjee criterion plots were used to evaluate the order of magnetic transition. This was achieved by plotting H/M vs. M2 near the transition region shown in Fig. 5. From the Banerjee criterion all three samples exhibit second order magnetic transition with broad temperature range shown in Fig. 4. In MCE materials, first order magnetic transition shows a narrow temperature range in comparison to second order magnetic transition, where the temperature range is typically broader.12 Previous studies suggested that LCMO materials exhibit a change from first order magnetic transition to second order magnetic transition as the size of the particles decreases.13,14
 | ||
| Fig. 3 Isothermal magnetization (M–H) measured from 100 to 300 K (a) PEG 600, (b) PEG 2000, (c) PEG 4000. | ||
 | ||
| Fig. 4 Temperature dependence of change in magnetic entropy of the as-synthesized La0.6Ca0.4MnO3 calculated at various external field (a) PEG 600, (b) PEG 2000, (c) PEG 4000. | ||
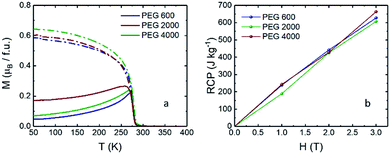
Relative cooling power (RCP) is used to measure the maximum entropy change in an ideal refrigeration cycle and is obtained by multiplying the maximum change in entropy (−ΔSM)max by the change in temperature at full width half maximum (δTFWHM) of the −ΔSM–T curve.1 The RCP calculated for each sample is demonstrated in Fig. 6b, revealing that the RCP values are size dependent.
 | ||
| Fig. 6 (a) M–T curves for the as-synthesized LCMO at 100 Oe applied field for ZFC (solid line) and FC (dash), (b) calculated RCP values. | ||
The field dependence of ΔS for the LCMO manganite at a fixed temperature is accounted for in the N component of the power law ΔSM(H) ∝ HN. The temperature variation of in the N component for the LCMO are shown in Fig. 7. Due to our instrument limitations, the magnetization isotherms were only measured up to 3 T. Therefore the N component of the power law is an approximation between 0 and 3 T. The minimum N values for PEG 600, 2000, and 4000 were found to be 0.66, 0.74 and 0.71, respectively. In all three samples, the N values showed significant differences between the ferromagnetic and paramagnetic phase of the material. The shape of the N(T) behaves similarly to the polycrystalline samples in the literature.15 The sample synthesized using PEG 600 have an N(T) value of 0.66, which was predicted at Curie temperature using the mean field approach.16
In LCMO materials, the PM–FM transition is due to double exchange between the Mn3+ and Mn4+ that causes a spin coupling interaction resulting in Jahn–Teller distortion.17 In addition, lattice distortions can be observed using Far-IR spectroscopy as phonon modes within the LCMO system are infrared active.18 Room temperature Far-IR spectroscopy results shown in Fig. S2† indicate two major maxima at 549 cm−1 and 275 cm−1 for the LCMO synthesized using PEG 600, these peaks are associated with the stretching and bending modes of Mn–O–Mn bond.18 However, in the Far-IR spectra for the PEG 2000 sample, the stretching mode shift to a lower wavenumber indicating that there is a bond angle and distance change between the samples. This suggests that the energy associated with the PEG 2000 sample is lower than that of the PEG 600 and 4000 samples resulting in the increase in magnetic entropy. Since the crystallites synthesized using PEG 600 and PEG 2000 resulted in larger crystallite sizes (>60 nm) in comparison to PEG 4000. The Far-IR spectra could explain the cause of enhanced magnetic entropy in larger crystallite size materials in comparison to smaller crystallites, where the Mn–O–Mn bond energy is higher in comparison to smaller crystallites. In addition, particles synthesized using PEG 600 and 4000 appeared to be less agglomerated in comparison to particles synthesized using PEG 2000. Lampen et al. suggested that in nanoparticle systems the second order magnetic transition is strongly due to surface effects of the particles.14 Our present work suggests that the synthesis parameter and particle morphology affect the surface induced properties of the materials. In addition, the particles synthesized using our method all show second order magnetic transition behaviour.
In comparison to the commonly used materials for magnetic refrigeration applications (Table 1), the La0.6Ca0.4MnO3 in this work showed an enhancement in the magnetocaloric properties of current LCMO materials. Though the TC of the LCMO nanocomposites are lower than that of Gd based material, the magnetic entropy is large enough to be used for magnetic refrigeration applications as the cost of LCMO production is significantly lower than Gd based materials.
| Sample | |(ΔSM)max| (J kg−1 K−1) | TC (K) | RCP (J kg−1) | Ref. |
|---|---|---|---|---|
| La0.5Ca0.5MnO3 | 1.2 (2 T) | 210 | 93 | 19 |
| La0.6Ca0.4MnO3 | 8.7 (1 T) | 277 | 238 | This work |
| La0.6Ca0.4MnO3 | 19.3 (3 T) | 277 | 627 | This work |
| La0.6Ca0.4MnO3 | 8.3 (5 T) | 270 | 508 | 5 |
| La0.8Ca0.2MnO3 | 8.6 (4.5 T) | 236 | 200 | 20 |
| LaMnO3 | 2.4 (5 T) | 150 | 369 | 21 |
| La0.75Sr0.25MnO3 | 1.6 (1.5 T) | 332 | 64 | 22 |
| Gd | 10.2 (5 T) | 297 | 240 | 23 |
| Gd90Fe5.7Al4.3 | 7.2 (5 T) | 279 | 744 | 24 |
4 Conclusions
In summary, near room temperature magnetocaloric properties were obtained for La0.6Ca0.4MnO3 via a modified sol–gel method. In this study, PEG was shown to control morphology and magnetocaloric properties of the LCMO nanomaterials. The structure and morphology were investigated using XRD, TEM and SEM. Magnetic measurements revealed that the nanoparticles undergo a second order magnetic transition with the PM–FM transition near room temperature. The maximum change in magnetic entropy (−ΔSM) was found to be 19.3 J kg−1 K−1 at 278 K for a field change of 0–3 T and 8.7 J kg−1 K−1 for a field change of 0–1 T. The relative cooling power (RCP) that is used to evaluate magnetic refrigeration properties was determined to be 627 J kg−1. This synthesis method has demonstrated an enhanced magnetocaloric effect comparing to the current LCMO literature. In addition, these material are also comparable to that of Gd based magnetocaloric materials, suggesting that this can be a promising material for magnetic refrigeration application.Conflicts of interest
There are no conflicts to declare.Acknowledgements
Acknowledgment is made to VCU Nanomaterials Core Characterization Facility, and VCU Department of Chemistry Instrumentation Facility. Additional acknowledgement is made to Brent M. Williams and Sarah E. Smith for proofreading and suggestions.Notes and references
- M.-H. Phan and S.-C. Yu, J. Magn. Magn. Mater., 2007, 308, 325–340 CrossRef CAS.
- J. Romero Gómez, R. Ferreiro Garcia, A. De Miguel Catoira and M. Romero Gómez, Renewable Sustainable Energy Rev., 2013, 17, 74–82 CrossRef.
- V. K. Pecharsky, K. A. Gschneidner, A. O. Pecharsky and A. M. Tishin, Phys. Rev. B: Condens. Matter Mater. Phys., 2001, 64, 144406 CrossRef.
- A. O. Pecharsky, K. A. Gschneidner Jr and V. K. Pecharsky, J. Appl. Phys., 2003, 93(8), 4722–4728 CrossRef CAS.
- V. M. Andrade, R. J. C. Vivas, S. S. Pedro, J. C. G. Tedesco, A. L. Rossi, A. A. Coelho, D. L. Rocco and M. S. Reis, Acta Mater., 2016, 102, 49–55 CrossRef CAS.
- O. I. Lebedev, G. Van Tendeloo, S. Amelinckx, B. Leibold and H. U. Habermeier, Phys. Rev. B: Condens. Matter Mater. Phys., 1998, 58, 8065–8074 CrossRef CAS.
- M. Pękała, V. Drozd, J. F. Fagnard, P. Vanderbemden and M. Ausloos, Appl. Phys. A, 2008, 90, 237–241 CrossRef.
- M.-H. Phan, S.-C. Yu, N. H. Hur and Y.-H. Jeong, J. Appl. Phys., 2004, 96, 1154–1158 CrossRef CAS.
- H. Gencer, N. E. Cengiz, V. S. Kolat, T. Izgi and S. Atalay, Acta Phys. Pol., A, 2014, 125, 214–216 CrossRef.
- A. E. Danks, S. R. Hall and Z. Schnepp, Mater. Horiz., 2016, 3, 91–112 RSC.
- X. Wang, M. Wang, H. Song and B. Ding, Mater. Lett., 2006, 60, 2261–2265 CrossRef CAS.
- O. Tegus, E. Brück, L. Zhang, W. Dagula, K. H. J. Buschow and F. R. de Boer, Phys. B, 2002, 319, 174–192 CrossRef CAS.
- L. E. Hueso, P. Sande, D. R. Miguéns, J. Rivas, F. Rivadulla and M. A. López-Quintela, J. Appl. Phys., 2002, 91, 9943–9947 CrossRef CAS.
- P. Lampen, N. S. Bingham, M. H. Phan, H. Kim, M. Osofsky, A. Piqué, T. L. Phan, S. C. Yu and H. Srikanth, Appl. Phys. Lett., 2013, 102, 062414 CrossRef.
- M. Pękała, J. Appl. Phys., 2010, 108, 113913 CrossRef.
- H. Oesterreicher and F. T. Parker, J. Appl. Phys., 1984, 55, 4334–4338 CrossRef CAS.
- P. Schiffer, A. Ramirez, W. Bao and S. Cheong, Phys. Rev. Lett., 1995, 75, 3336 CrossRef CAS PubMed.
- K. H. Kim, J. Y. Gu, H. S. Choi, G. W. Park and T. W. Noh, Phys. Rev. Lett., 1996, 77, 1877–1880 CrossRef CAS PubMed.
- M. Pękała, V. Drozd, J. F. Fagnard and P. Vanderbemden, J. Alloys Compd., 2010, 507, 350–355 CrossRef.
- S. Xi, W. Lu and Y. Sun, J. Appl. Phys., 2012, 111, 063922 CrossRef.
- A. Biswas, S. Chandra, M.-H. Phan and H. Srikanth, J. Alloys Compd., 2012, 545, 157–161 CrossRef CAS.
- M. PękaŁa, K. PękaŁa, V. Drozd, J. F. Fagnard and P. Vanderbemden, J. Magn. Magn. Mater., 2010, 322, 3460–3463 CrossRef.
- H. Zeng, J. Zhang, C. Kuang and M. Yue, Appl. Nanosci., 2011, 1, 51–57 CrossRef CAS.
- L. Zhang, M. Bao, Q. Zheng, L. Tian and J. Du, AIP Adv., 2016, 6, 035220 CrossRef.
Footnote |
| † Electronic supplementary information (ESI) available: Additional calculation of TC, Far-IR spectra available. See DOI: 10.1039/c7ra06619h |
| This journal is © The Royal Society of Chemistry 2017 |


