 Open Access Article
Creative Commons Attribution 3.0 Unported Licence
Synthesis of novel copolymers based on p-methylstyrene, N,N-butylvinylimidazolium and polybenzimidazole as highly conductive anion exchange membranes for fuel cell application
Amina Ouadah a,
Hulin Xub,
Tianwei Luoa,
Shuitao Gaoa,
Zeyu Zhanga,
Zhong Lia and
Changjin Zhu*a
aSchool of Chemistry and Chemical Engineering, Beijing Institute of Technology, No. 5, Zhonguancun South Street, Beijing 100081, China. E-mail: zcj@bit.edu.cn
bBeijing Qintian Science & Technology Development Co. Ltd, China
First published on 11th October 2017
Abstract
A series of copolymers as anion exchange membrane materials were synthesized by the copolymerization of N,N-butylvinylimidazolium with p-methylstyrene and polybenzimidazole, and then the corresponding membranes were prepared and are abbreviated in this study as VIBx/PMSy/PBIz. The components of the three polymeric blocks were optimized in order to realize a good compromise between different properties. Membrane test results revealed that the percentage of a single polymeric block in the copolymer influenced directly the anion conductivity of the membrane. Comparing to the commercial membrane A201 Tokuyama, six of the present membranes had a better conductivity at high temperatures, and three displayed better conductivity at all temperatures. The best conductivity is observed for membrane VIB5/PMS1/PBI0.5 which reaches chloride conductivity of 26.3 mS cm−1 at 25 °C and 73.7 mS cm−1 at 100 °C. The membrane had an IEC of 2.6 mmol g−1 and a low activation energy of 6.62 kJ mol−1. Membrane VIB5/PMS2/PBI0.5 is also among the three membranes that had better conductivity, and had 10.77% swelling ratio and 6.66 kJ mol−1 of activation energy. Most membranes showed a low activation energy and in-plane swelling ratio. So far all membranes exhibit a linear Arrhenius behavior and are thermally stable up to 250 °C. The morphology study explored by TEM and AFM showed a well-developed bicontinuous phase distribution of hydrophilic and hydrophobic regions that confirmed a facile transport through the ion channels deduced after the finding of activation energy results.
Introduction
The electrolyte membrane is a very important component in a fuel cell because of its significant influence on the performance.1,2 According to the type of electrolyte, fuel cells could be classified into two categories: proton exchange membrane fuel cells (PEMFCs) where the membranes conduct protons (H+) and anion exchange membrane fuel cells (AEMFCs) where they conduct hydroxide ions (OH−).3 Nafion, known as state of the art, is today the most commercialized electrolyte, its proton conductivity is as high as 100 mS cm−1 at room temperature and 100% relative humidity (Nafion 117), and it also possesses good mechanical properties and an excellent chemical stability.4–6 Still, a very large class of polymers including poly(olefin)s,7 poly(styrene)s,8 poly(phenylene oxide)s,9 poly(phenylene)s,10 and poly(arylene ether)s11 have been studied for use as a proton exchange membrane (PEM) for fuel cell.12However, development of anion exchange membranes (AEMs) has been started recently and fast improvements have been shown because non-noble-metals can be used as catalysts for AEM, which will significantly decrease the cost of fuel cells, although a good compromise of the most important performances including conductivity, mechanical strength, and chemical stability still has not reached the quality of PEMs such as Nafion. The history of AEM can be traced back to 1960s in the Apollo space shuttle program of NASA, where the AEMs covered up to 70% of electrical efficiency-in an alkaline medium-via oxygen kinetic reduction and electrooxidation of the fuel.
A large number of polymers especially aromatics like polyethers, polysulfones, polyketones and polystyrenes have been investigated through functionalization with quaternary ammonium (QA) groups and explored for use as AEM materials.13 This class of membranes considered as a trigger point for research in the fuel cell manufacture2 is more and more investigated to be a good substitute to PEMFCs,14 and great efforts to develop AEM for electrochemical application15 have been seen in the last years due to their capability to operate in an alkaline medium5 rather than the acidic one, where the electrochemical reactions are easier.2 It enables the use of non-noble metals as good catalysts like silver, cobalt, or nickel for fuel-cell operation, which involves a low cost compared to the use of PEMFC.2,13,15–17 Another good property for AEM is the reduction of fuel crossover as the electro-osmotic drag goes in the opposite direction to that in PEMFCs.18 AEMs require a high conductivity-usually achieved via high ion exchange capacity (IEC),5 a low degree of swelling, a good mechanical aspect, and stability under chemical and thermal conditions.19
However, AEMs still need some improvements to perform well. Therefore, so many researchers are active in order to improve their conductivity and alkaline stability2,14,15 and many scientific efforts have been paid for the design of new AEMs with better properties.20 For this advanced AEM materials, the following criteria are believed the crucial: (1) development of new methods so that the control of the position and degree of grafting is suitable.14 As example, the improvement of ionic conductivity has successfully been achieved by choosing the right position of quaternary ammonium (QA) groups and the dimensional water swelling can easily be controlled via covalent cross-linking;20 (2) good choice of polymer backbones with an important alkaline-resistant and thermal stability; (3) incorporation of only stable cations into the polymer backbone.14 Other different criteria have been set for AEMs: (1) the membrane must reach higher conductivity than 100 mS cm−1 as it is obvious that conductivity for the current AEMs is not as high as that of PEMs2,14,15,21 (2) must be chemically stable in an alkaline medium, and (3) must exhibit a good stress and strain14,21 because normally a high ionic conductivity leads to poor properties, especially the mechanical strength, which is the most affected performance.2 Obviously, the major challenge for the current development of AEM is achieving a high conductivity as in PEM, and the most effective way is to attain a high IEC with a moderate swelling ratio.14,21 It also should be stable at a high pH and mechanically robust.14
Among actual AEMs, very few are stable up to 80 °C in an alkaline environment. However, this is one of the most important criteria that decide for fuel cell application. Especially, strong resistance to a temperature above 80 °C is highly recommended, and the choice of a polymer backbone that possesses these properties is the key.14,22 Generally, researchers focused on synthesizing new thermally and chemically durable fluorinated and aromatic polymers.23 At the same time, a good choice of cations in AEM contributes to improvement in the chemical and thermal behavior as hydroxide ion is transported via these cations.22
Perfect cations for AEM are easy to synthesize and to incorporate into the polymer while maintaining optimal conductivity and stability. Imidazolium is one of the most selected cations for use in alkaline AEMs. Imidazoliums are a class of flexible organic compounds with facile modification of substituents, and are able to be converted to the cationic form via alkylation.24
Recently, a series of AEM based poly(1-vinylimidazole) and poly(vinylbenzyl chloride) acting as macromolecular cross-linking agents into the PVA matrix were reported to have a high hydroxide conductivity of 21.9 mS cm−1 at 30 °C and 100% relative humidity.25 A comparative study between benzyltrimethyl-ammonium and 1-benzyl-3-methyl-imidazolium cationic groups grafted on the same poly(ethylene-co-tetrafluoroethylene) (ETFE) backbone revealed that both AEMs displayed similar conductivity.26 More recently, poly(2,6-dimethyl-1,4-phenylene oxide) with imidazolium-terminated long side chains was synthesized for an AEM with much higher conductivity than ammonium functionalized PPO.27
Page and co-author confirmed that the conductivity depends only on the imidazolium ring, using the same backbone they obtained exactly similar results for AEMs based substituted and unsubstituted imidazolium.28
On the other hand, studies confirmed that the alkaline stability depends completely on the polymer backbone structure upon the evaluation of AEMs using the same imidazolium cation but different polymer backbones.29,30
Therefore, the intent of this work was to achieve a good conductivity using the imidazolium cation, and good water uptake and swelling properties using a synthesized backbone via copolymerization of different polymers, so each one can contribute to enhancing one of these properties. In this copolymer design, poly(butylvinylimidazolium) offers a good conductivity while poly(para-methylstyrene) and polybenzimidazole (PBI) enhance the other properties. For this aim, three series have been investigated with different ratio of poly(butylvinylimidazolium), poly(para-methylstyrene) and polybenzimidazole in order to obtain a formula with a good compromise.
Experimental
Materials
Polybenzimidazole (PBI) powder, 1-vinylimidazole, 2,2′-azobisisobutyronitrile (AIBN), potassium hydroxide (KOH) and sodium chloride (NaCl) were purchased from HEOWNS (Tianjin, China), p-methylstyrene (PMS) from Xilong Chemical (China), 1-bromobutane from Energy Chemical (China), dimethyl sulfoxide (DMSO) and tetrahydrofuran (THF) from Tianjin Fuyu Fine Chemical (China), and N-bromosuccinimide (NBS) and benzoyl peroxide (BPO) from Beijing OUHE Technology (China).p-Methylstyrene was passed through a column of alumina to eliminate the inhibitor. The BPO was purified; 10 g of BPO totally dissolved in 40 ml of chloroform has been poured into 100 ml of methanol cooled in an ice bath. The solid was filtered under pressure to obtain the pure BPO. Other chemicals have been used without purification.
Synthesis of copolymer of vinylimidazole/p-methylstyrene (VIB/PMS)
1-Vinylimidazole (5 ml, 55.14 mmol) was mixed with an excess of 1-bromobutane (8 ml, 74.15 mmol) under nitrogen and stirred at 40 °C for 48 hours. Once the reaction is completed, the excess of 1-bromobutane is removed by evaporation. Then the produced vinylimidazolium bromide (VIB) was dried overnight at room temperature. A mixture of VIB (2 g, 8.65 mmol), PMS (different fractions of VIB/PMS were synthesized), and AIBN (30 mg, 0.183 mmol) in 2 ml of DMSO was stirred under nitrogen at 80 °C for 48 hours. The resulting viscous mixture (VIB/PMS) was poured dropwise into acetone, and the collected solid is dried in the oven at 60 °C (rate 99.5%).Bromination of (VIB/PMS) and synthesis of copolymerized VIB/PMS/PBI (membrane preparation)
An appropriate amount of VIB/PMS was dissolved in 2 ml of DMSO, and NBS and BPO were added to the solution. The reaction mixture was stirred at 80 °C for 3 hours under reflux and nitrogen. The resulting mixture of brominated VIB/PMS (VIB/PMSBr) was filtered to eliminate the unreacted NBS and BPO, and then precipitated by the use of THF. After that, the whole mixture has been centrifuged so the entire amount of VIB/PMSBr was reclaimed.The mixture of VIB/PMSBr and PBI in DMSO was stirred. The homogeneous solution was poured into Teflon plate, covered and kept in an oven at 80 °C for 48 hours. Then, the cover was taken off and the sample was dried at the same temperature.
Characterizations
The resulting copolymer VIB/PMS was analyzed by H1 nuclear magnetic resonance (H1 NMR) on a Varian mercury-plus 400 instrument in DMSO-d6, the membrane's Fourier Transformed Infra-Red (FT-IR) spectrums were obtained by using a Horiba FT-720 fourier transform spectrometer with a resolution of 2 cm−1. The thermogravimetric analysis (TGA) was performed with TGA-Q500 in a nitrogen atmosphere at a heating rate of 10 °C min−1 over the range 30–800 °C. Differential scanning calorimetry was recorded using DSC-60, under nitrogen from 35 to 800 °C with a heating rate of 10 °C min−1.Morphology
Transmission electron microscopy (TEM): was performed on stained membranes with ruthenium tetroxide in their chloride ion form to exchange the anions for 48 h and then rinsed with water. The stained membranes were embedded in epoxy resin and microtomed to give sections with 70 nm thick membrane. TEM observation was performed with a JEOL JEM-2010 TEM.Atomic force microscopy (AFM): images were taken using a Digital Instruments NanoscopeIIIa in tapping mode. A 2 μm micro-fabricated cantilever was applied in the resonance frequency range of 1.001 Hz.
Measurements
The ion conductivity was measured using CHI660D impedance analyzer over the frequency ranging from 100 Hz to 0.1 MHz. The conductivity was calculated from the impedance data as follows:
| σ = l/RS | (1) |
The resulted membranes were immersed in 20 ml volume of 0.01 M HCl for 48 hours. The liberated hydroxide ions were then titrated with 0.01 M NaOH. The endpoint was determined visually using phenolphthalein as indicator. The membrane was thoroughly washed with deionized water and dried at 60 °C till a constant weight. The IEC is calculated according to the following equation:
| IEC (mmol g−1) = CNaOH × (VbNaOH − VNaOH)/Wd | (2) |
 | (3) |
Swelling ratio is calculated as follow:
 | (4) |
Electrodes were fabricated using commercial carbon-supported platinum Pt/C catalysts (20% Pt) mixed with 5 wt% of anion conducting copolymer solution (VIB/PMS) in 1-propanol. The mixture has been sonicated for at least one hour and later sprayed on the electrodes: carbon fiber cloth for the anode and carbon paper for the cathode. An aqueous fuel solution containing 2 M of ethanol and 4 M of potassium hydroxide was pumped to the anode; simultaneously, pure oxygen was fed to the cathode without humidification.
Results and discussion
Copolymers VIB3/PMS2, VIB5/PMS2, and VIB5/PMS1 as key intermediates containing different ratios of VIB/PMS were studied first in this work. We increased the percentage of VIB in the copolymer to increase the conductivity of the final membranes and the hydrophobic poly(p-methylstyrene) moiety was supposed to equilibrate the hydrophilic aspect of the copolymer. For each ratio of VIB/PMS different amount of PBI was also used for the final membranes to determine the membranes with a good balance between conductivity and mechanical properties.Chemistry
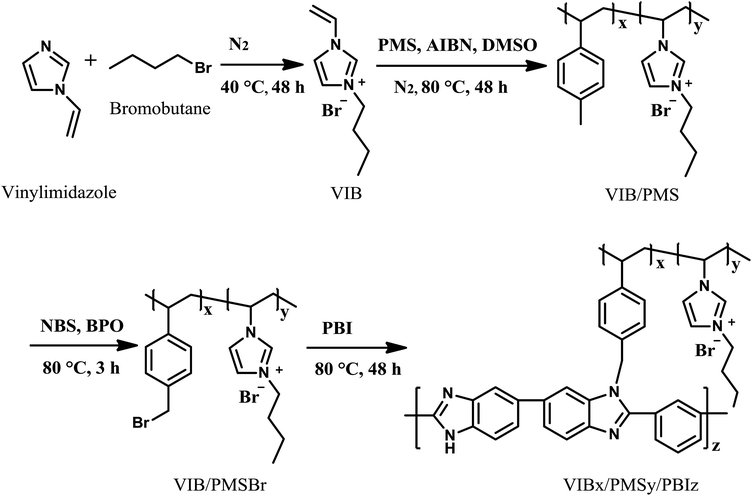
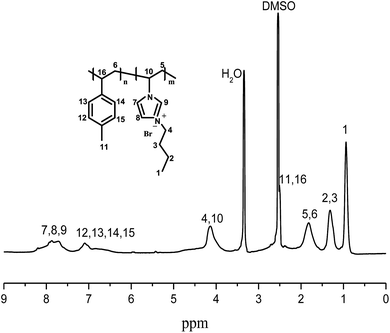
The synthesis of the copolymers is described in Scheme 1. Alkylation of imidazolium with 1-bromobutane produced imidazolium ionic liquid VIB. The copolymerization of VIB with p-methylstyrene was carried out via radical polymerization catalyzed by AIBN to give the intermediate copolymers VIB/PMS. Then, the para-methyl groups of the poly(para-methylstyrene) moiety in VIB/PMS were brominated with NBS, by which VIB/PMS were allowed to cross-link with PBI leading to the final membrane materials VIBx/PMSy/PBIz.VIB/PMS were characterized by spectra of H1 NMR shown in Fig. 1; the peak at 0.912 ppm in the H1 NMR spectra represents the chemical shift of CH3 group in the N-butylimidazolium bromide moiety, the signal at 1.316 ppm is related to the CH2 groups in the N-butylimidazolium, and the chemical shift at 1.8 ppm is assigned to the CH2 groups in the backbone of VIB/PMS. The signal at 2.48 ppm depicts the benzylic CH3 and CH groups, and at 4.13 ppm attributed to the N–CH and N–CH2 groups linked to the imidazole moiety. The signals ranging from about 6.5 to 8.5 ppm belong to CH groups of phenyl and imidazole rings.
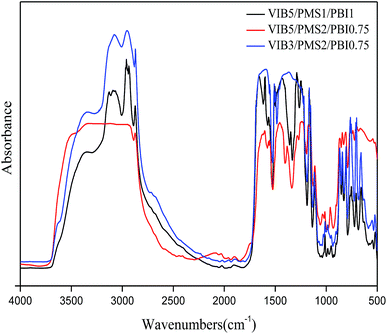
Fig. 2 depicts the superposed IR spectra of the elaborated membranes in absorption mode. In every spectrum the following peaks appear: N–H stretch between 3500–3700 cm−1, heteroatom OH− issued from the absorbed water by the membrane-stretch ranging from 3200 to 3550 cm−1, C–H of phenyl ring in the range 3000–3100 cm−1, C–H vibration of alkyl or alkane between 2800–3000 cm−1, C![[double bond, length as m-dash]](https://www.rsc.org/images/entities/char_e001.gif) N stretch from 1600 to 1800 cm−1, and C
N stretch from 1600 to 1800 cm−1, and C![[double bond, length as m-dash]](https://www.rsc.org/images/entities/char_e001.gif) C stretch at 1500 cm−1.
C stretch at 1500 cm−1.
Thermal properties
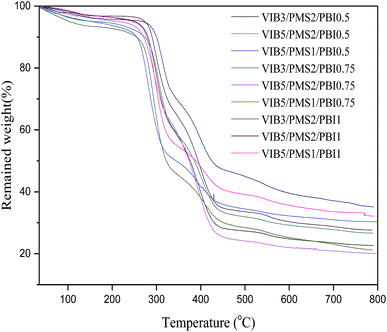
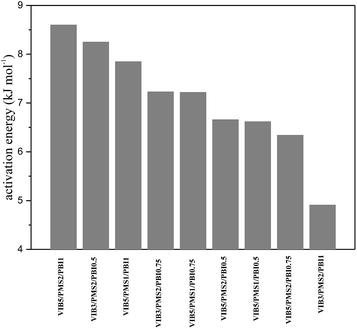
Fig. 3 describes the TGA thermograms of the membranes. A slight decline was observed at around 100 °C indicating the evaporation of residual water. The most distinguished weight losses were observed in two steps, and the first one went from 250 °C to 350 °C, which could be attributed to the degradation of butylimidazolium groups with an approximate weight loss of 40%.31 The second started directly by the end of the first one and was over at about 450 °C, caused by the degradation of the chain connecting rings of phenyl and imidazolium corresponding to a weight loss around 25%. The membrane's residual weight is estimated to be more than 30% of the initial weight. Degradation temperatures of the membranes increased while increasing the percentage of PBI in the membrane and the opposite occurs when we decrease it due to the copolymer network interactions. The exact values are listed in Table 1.| Membrane | Water uptake WU (%) (Cl−) | In-plane swelling SW (%) (Cl−) | Ion exchange capacity IEC (mmol g−1) | Activation energy (kJ mol−1) | Degradation temperature (°C) |
|---|---|---|---|---|---|
| VIB3/PMS2/PBI1 | 27.08 | 2.77 | 1.34 | 4.91 | 268 |
| VIB3/PMS2/PBI0.75 | 43.21 | 9.26 | 1.56 | 7.23 | 245 |
| VIB3/PMS2/PBI0.5 | 126.11 | 5.71 | 1.89 | 8.25 | 235 |
| VIB5/PMS2/PBI1 | 47.3 | 6.99 | 2.04 | 8.6 | 258 |
| VIB5/PMS2/PBI0.75 | 145.26 | 22.83 | 2.05 | 6.34 | 243 |
| VIB5/PMS2/PBI0.5 | 320.19 | 10.77 | 2.06 | 6.66 | 238 |
| VIB5/PMS1/PBI1 | 98.51 | 35.03 | 2.41 | 7.85 | 252 |
| VIB5/PMS1/PBI0.75 | 101.88 | 21.64 | 2.54 | 7.22 | 245 |
| VIB5/PMS1/PBI0.5 | 190.17 | 37.75 | 2.6 | 6.62 | 235 |
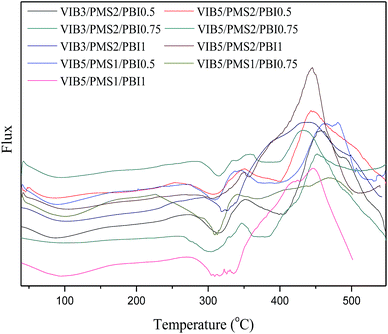
The DSC thermograms (Fig. 4) demonstrated different phenomena observed while the membranes are heated in an inert atmosphere. For our membranes, two exothermic peaks and two other endothermic have been detected. The glass transition of PBI was in the range of 400 °C to 450 °C for all studied membranes, and the reason behind decreasing or increasing the glass transition for the different molar ratio is the interactions created between PMS/VIB and PBI chains.
Both the glass transitions of pure poly(p-methylstyrene) around 110 °C (ref. 32) and ranges from 66 to 105 °C when the poly(p-methylstyrene) is copolymerized;33 and the one of imidazolium (that ranges from 90 to 170 °C)34 can't be observed in these thermograms because the enthalpy of the first peak at 100 °C-due to the evaporation of residual water and the melting of p-methylstyrene in the copolymer35-is higher enough to decline both of them. Or a tertiary blend presents only a single glass transition and in this case we assume that this copolymerization could achieve one phase blend.36
Gathering the thermal characterizations, we conclude that all the present membranes were thermally stable up to 250 °C and have a great potential for use in fuel cell application at high temperatures.
Conductivity
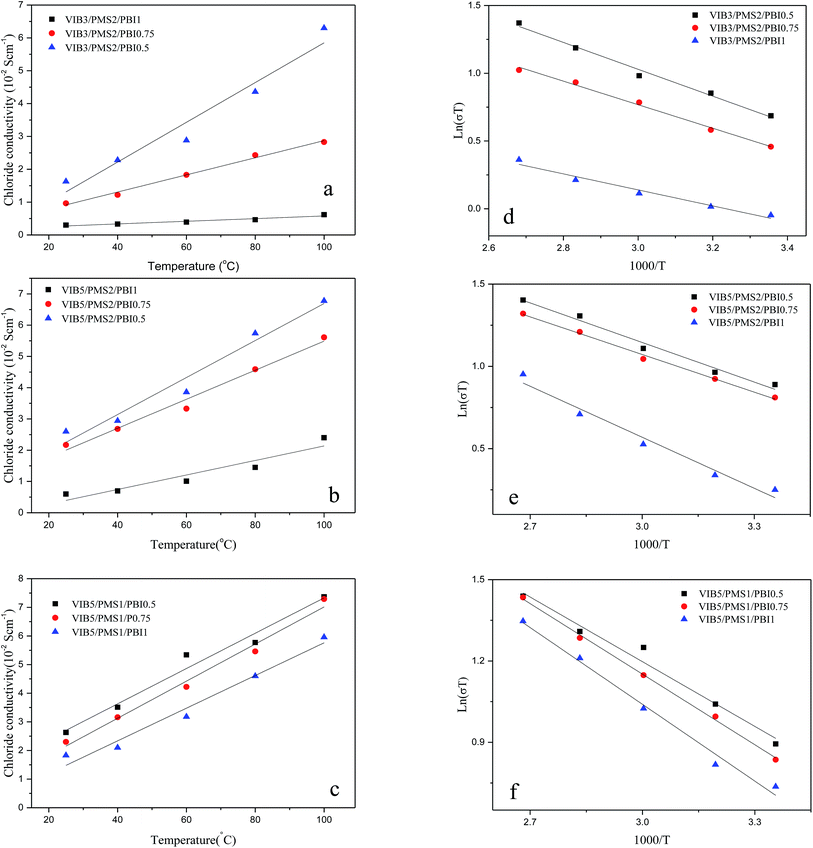
It has been demonstrated that the transportation of ions in AEM takes place in the confined surface domain, where both the vehicular and Grotthuss mechanisms make significant contributions.16 Studies so far have shown that AEMs are less conductive than PEMs. However, a value of low activation energy recognized for AEM compared to that in PEM materials suggests that the conductivity has better improvement in AEMs at elevated temperature than in PEMs, and this property should be explored for AEM in fuel cell design and applications.16The Fig. 6a–c show up that the conductivity increases while the percentage of PBI decreases in the membrane indicating that PBI acts as a barrier for anion conductivity.
In Fig. 5a, we find out that the conductivity increases with increasing the content of VIB in the membrane, which was expected since the VIB units were the conductive sites in the anion membrane composition. Among the present membranes, three samples of VIB5/PMS2/PBI0.5, VIB5/PMS1/PBI0.5, and VIB5/PMS1/PBI0.75 exhibited a distinguished conductivity at either a low or high temperature and were much better than the commercial membrane A201 Tokuyama. More membranes including VIB3/PMS2/PBI0.5, VIB5/PMS2/PBI0.75, VIB5/PMS2/PBI0.5, VIB5/PMS1/PBI0.5, VIB5/PMS1/PBI0.75, and VIB5/PMS2/PBI1 reached chloride conductivity between 0.05 and 0.08 S cm−1 at higher temperature of 100 °C.
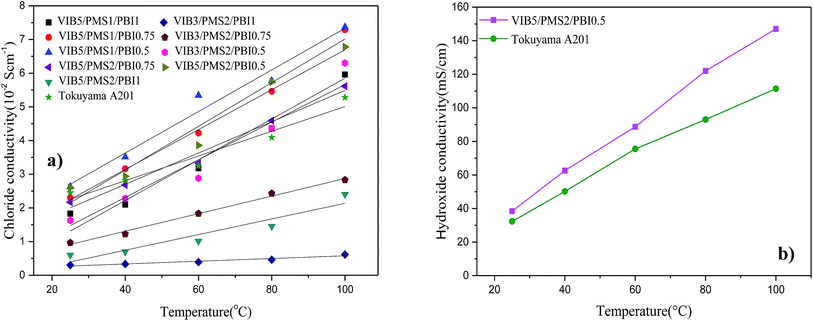 | ||
| Fig. 5 (a) Chloride conductivity of synthesized membranes as function of temperature, (b) hydroxide conductivity of synthesized membrane VIB5/PMS2/PBI0.5 and the commercial membrane A201. | ||
Fig. 5b depicts the hydroxide conductivity of membrane VIB5/PMS2/PBI0.5 and the commercial A201. For both membranes, the conductivity increases while increasing temperature. This expected behavior is due to the increase of free volume which makes the ion conducting channels more connected and facilitates their mobility at higher temperatures.25 The observed hydroxide conductivities reach 38.4 mS cm−1 at 25 °C and 147 mS cm−1 at 100 °C, compared to 32.3 mS cm−1 at 25 °C and 111.4 at 100 °C for the Tokuyama A201. These results are very comparative to nowadays achievements. As comparison, the conductivity of 35.8 mS cm−1 at 30 °C and a maximum of 78.7 mS cm−1 at 90 °C was reported for imidazolium based ionic liquid membrane.37
As it was expected, we notice an increase from chloride to hydroxide conductivity for both membranes. A reason behind this phenomenon is the fact that the hydroxide cluster has the best intrinsic diffusion coefficient between the used anions in AEMs. However, this counterion can often be inconvenient since hydroxide easily reacts at room temperature with carbon dioxide to produce CO32− and HCO3− at the membrane surface leading to a decrease in the hydroxide conductivity. This fact makes the chloride conductivity the most accurate one.38
Ion exchange capacity, water uptake and swelling ratio
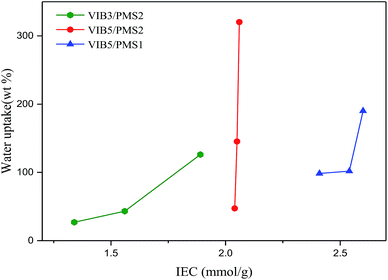
The IEC values for the two membrane series VIB5/PMS2/PBIz and VIB5/PMS1/PBIz owing five portions of the component VIB in the copolymer membranes were in the range from 2.04 to 2.6 mmol g−1, much higher than that of the series VIB3/PMS2/PBIz with three VIB portions due to a higher number of imidazolium cations (Table 1).In the same series where the portion size of VIB is fixed, the increase or decrease in IEC could be attributed to the amount of PBI component and to the different molecular interactions (inter/intra) especially the entanglement between the polymeric blocks in the copolymer membranes.2 Recently, an IEC was found to be 1.52 mmol g−1 for poly[styrene/1-vinyl-3-methylimidazolium iodide]1 and 1.8 mmol g−1 for Tokuyama A201.39 Also, an IEC of 2.3 mmol g−1 was reported for the membrane tetraalkylammonium-functionalized cross-linkers (two ammonium units and two olefins within the same molecule) with chloride conductivity of 24.6 mS cm−1 at 50 °C.40
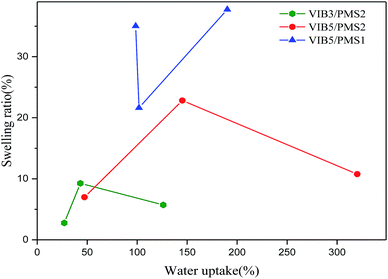
Fig. 7 and 8 illustrate the swelling ratio and water uptake as functions of IEC. It is common that at high IECs, membranes usually absorb excessive amounts of water and become dimensionally unstable.41 Fig. 8 confirms that water uptake is raised while IEC increases. The increase in water uptake in all series of membranes led to higher conductivity. This phenomenon is well known in electrolyte membrane especially when the Grotthuss mechanism is the dominant one.
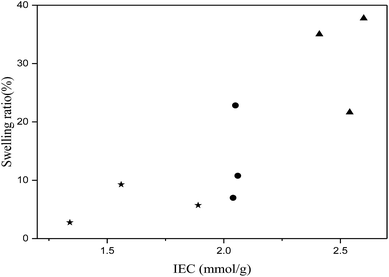 | ||
| Fig. 7 Swelling ratio as function of ion exchange capacity: (★) series VIB3/PMS2, (●) series VIB5/PMS2, (▲) series VIB5/PMS1. | ||
Normally, too much water uptake means a high swelling ratio.13 However, the present membranes showed relatively low swelling ratio although they had high water uptake as shown in Table 1 and Fig. 9. As an example, the SW of the membrane VIB3/PMS2/PBI0.5 was only 5.7% even the water uptake was as high as 126%, and VIB5/PMS2/PBI0.5 had a SW of only 10.76% even if the water uptake went up to 320%. Also, we found that the swelling ratio of the present membranes was non-dependent on the water uptake as shown in Fig. 9. This unexpected finding could be explained by the fact that the copolymerization is responsible for the arrangement of different polymeric blocks in the copolymer membranes, and by the interactions between hydrophobic segments.5 The membranes of series VIB5/PMS1/PBIz displayed a high SW compared to the other series probably due to the lower content of the poly(para-methylstyrene) component. Less poly(para-methylstyrene) portion means higher hydrophilicity and thus higher SW. In addition to cross-linking with PBI, methylstyrene was used and justified in the copolymer preparation to create a balance between hydrophilic and hydrophobic aspects.
Activation energy
The values of activation energy calculated from data in Fig. 6d–f are given in Table 1.42 Reduced values of activation energy ranging from 4.9 to 8.6 kJ mol−1 for the present membranes compared to 5–20 kJ mol−1 for Nafion17 show an efficient conduction pathway and a good chemical conduction environment. The activation energy did not depend on the ion exchange capacity or on the conductivity. Membrane VIB3/PMS2/PBI1 exhibited the lowest value of activation energy, while VIB5/PMS1/PBI0.5 had the best conductivity. This is probably due to a good molecular arrangement of VIB3/PMS2/PBI1 compared to other membranes (Fig. 10).Morphology study
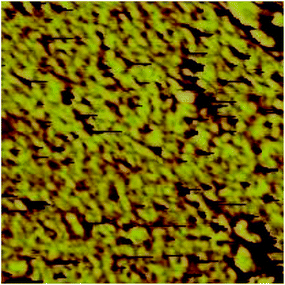
The membrane morphology is responsible for many properties, especially the separation between hydrophilic and hydrophobic clusters. Indeed, a good design of an AEM requires a good molecular architecture and better knowledge of the microphase separation in membranes.23 The morphology study helps to better understand the impact of phase separation on the ion transport.TEM images show the phase separation of hydrophilic (dark) and hydrophobic (bright) regions in the present membranes, and nanometer-scale separated bicontinuous phases were observed (Fig. 13a–d). The two distinguished phases correspond to ion clusters (dark) and polymer backbone (bright) regions, respectively. Membrane VIB3/PMS2/PBI1 (Fig. 13a) shows less dark regions than membranes VIB5/PMS1/PBI0.5 (Fig. 13b) and VIB5/PMS2/PBI0.5 (Fig. 13c), because of its lower percentage of ionic aggregates than the later membranes; but at the same time it presents a better dispersion that explains the low activation energy. For the three membranes in Fig. 13a–c no special shape or agglomeration was identified.17 However, the separation of hydrophobic (polymer backbone) and hydrophilic (ionic clusters) phases is not that clear because of the domain's size, Fig. 13d with higher resolution illustrates how obvious is the separation and we can confirm that the clusters are very narrow and smaller than approximately 5 nm. The same case already reported for alkyl bisimidazolium crosslinked membranes where the size was approximately 2 nm (ref. 43) which justifies the good conductivity; it has been confirmed that a good phase separation between hydrophilic and hydrophobic segments leads to an easy transport through the ion-conducting channels, and a high hydroxide conductivity is normally related to a good nanophase separation in AEM.44 The AFM image in Fig. 11 confirms the TEM observations. A homogeneous continuous dispersion of the two phases is obvious. The yellow regions are the polymer backbone (hydrophobic) and the dark regions are the ion aggregates (hydrophilic). Mostly small spots were observed due to the high solubility of ion clusters in the solvent, and the few large domains were generated by the solubility of the hydrophobic regions. The TEM and AFM data justify the low activation energy of these membranes compared to Nafion 117 and confirm a better ion channels transport inside the membrane.
Alkaline stability
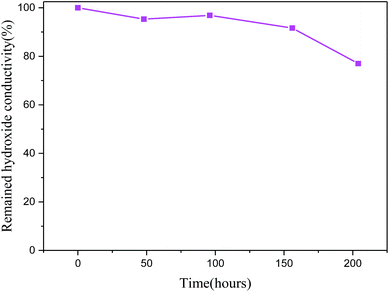
Alkaline stability is a trigger and limiting property for practical use in AEMs as cations and polymer backbone in AEMs are very vulnerable to the nucleophilic attack by the hydroxide ions, and this high nucleophilicity will directly result in a degradation of ion exchange groups and an obvious decrease in the conductivity will occur.45,46 It is well known that ionic liquid polymers with imidazolium and pyrrolidinium cations display better stability than their homolog polymers substituted ammonium or phosphonium cations.45As matter of fact, membrane VIB5/PMS2/PBI0.5 as an example of our elaborated series is showing a dramatic alkaline stability (Fig. 12). We notice that after 204 hours of alkaline treatment in 2 M KOH at 25 °C, the studied membranes maintain more than 75% of their hydroxide conductivity and we didn't observe either shape nor flexibility deterioration or weight loss after the treatment. In comparison to different membranes with the substituted imidazolium, a series of imidazolium functionalized polyphenylene oxide had 25% of hydroxide degradation after only 24 hours of treatment in 1 M KOH at 80 °C while it doesn't reach 5% in our study38 and for poly(2,6-dimethyl-1,4-phenylene oxide) (PPO)-based hydroxide electrolyte membrane treated with KOH (1 M, 96 h) at room temperature, the membrane lost 20% of its initial hydroxide conductivity while in our case it is less than 5% for the same period of time and in 2 M KOH.47
Fuel cell test
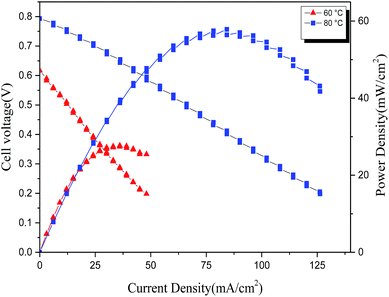
In the fuel cell polarization of membrane VIB5/PMS2/PBI0.5 (Fig. 14), the OCV was about 0.78 V and 0.9 V at 60 °C and 80 °C respectively, higher than the reported value for the commercial A201 (0.47 V)48 implying an efficient phase boundary between the catalyst layer and the membrane and a favorable environment for the electrochemical reaction.25,49 The maximum observed power density was 84 mW cm−2 corresponding to 127 mA cm−2 and 80 °C, lower than our expectation according to the high conductivity exhibited by the membrane. The same case of controversy between the power density and conductivity has been reported previously;50 more recent studies using quaternized guanidimidazole51 and phenolphthalein-containing poly(arylene ether sulfone)s as crosslinked AEM52 reported only 39 mW cm−2 at 50 °C and 83.6 mW cm−2 at 80 °C power density respectively while they exhibited high conductivities.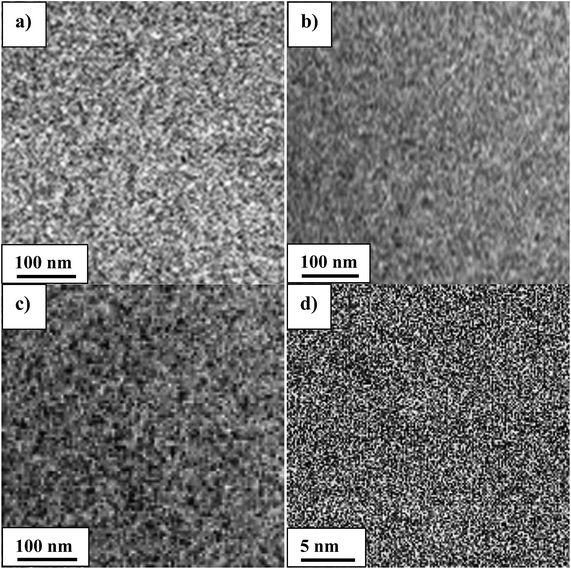 | ||
| Fig. 13 TEM images of membranes in chloride form. (a) VIB3/PMS2/PBI1; (b) VIB5/PMS1/PBI0.5; (c) VIB5/PMS2/PBI0.5; (d) VIB5/PMS2/PBI0.5 (higher resolution). | ||
As matter of fact, the cell behavior has been probably affected by the MEA technology, the electrode's surface activity and the interfacial property between the electrode and the membrane.52,53 Further optimization of the electrode structures, MEA fabrication and test conditions to enhancing the fuel cell performance is required.
Conclusion
N,N-Butylvinylimidazolium was copolymerized with poly(p-methylstyrene) forming copolymers as anion transfer sites in the present AEM design. In order to obtain enough mechanical properties, the copolymers were then cross-linked to PBI leading to the three series of copolymer membranes possessing three polymeric blocks of VIB, PMS, and PBI. As expected, overall increasing the number of the VIB block in the membrane resulted in higher conductivity, and PMS could improve the water swelling and thus the dimensional stability. On the optimization of the three block components, three membranes of VIB5/PMS2/PBI0.5, VIB5/PMS1/PBI0.5, and VIB5/PMS1/PBI0.75 were distinguished because they appeared to have excellent conductivity in a wide range of temperature even better than that of the commercial membrane Tokuyama A201. Between these membranes, VIB5/PMS2/PBI0.5 had a low swelling ratio and also low activation energy because of the very good molecular arrangement and the homogeneous dispersion proved by the TEM analysis. The present membranes were also thermally stable up to temperature reaching 250 °C. Our results enable the use of the elaborated membranes in the fuel cell especially at high temperatures, and showed our methodology successful to reach a good compromise between different properties.Conflicts of interest
There are no conflicts to declare.References
- J. Fang, M. Lyu, X. Wang, Y. Wu and J. Zhao, J. Power Sources, 2015, 284, 517–523 CrossRef CAS.
- Q. Li, L. Liu, S. Liang, Q. Dong, B. Jin and R. Bai, RSC Adv., 2013, 3, 13477–13485 RSC.
- H. Chen, J. Wang, H. Bai, J. Sun, Y. Li, Y. Liu and J. Wang, RSC Adv., 2015, 5, 88736–88747 RSC.
- S. J. Zaidi, in Polymer membranes for fuel cells, Springer, 2009, pp. 7–25 Search PubMed.
- L. Zhu, J. Pan, Y. Wang, J. Han, L. Zhuang and M. A. Hickner, Macromolecules, 2016, 49, 815–824 CrossRef CAS.
- F. Fu, H. Xu, Y. Dong, M. He, Z. Zhang, T. Luo, Y. Zhang, X. Hao and C. Zhu, J. Membr. Sci., 2015, 489, 119–128 CrossRef CAS.
- J. Zhou, M. Unlu, J. A. Vega and P. A. Kohl, J. Power Sources, 2009, 190, 285–292 CrossRef CAS.
- J. Wang, S. Li and S. Zhang, Macromolecules, 2010, 43, 3890–3896 CrossRef CAS.
- Z. Zhao, J. Wang, S. Li and S. Zhang, J. Power Sources, 2011, 196, 4445–4450 CrossRef CAS.
- M. R. Hibbs, C. H. Fujimoto and C. J. Cornelius, Macromolecules, 2009, 42, 8316–8321 CrossRef CAS.
- G. Wang, Y. Weng, D. Chu, D. Xie and R. Chen, J. Membr. Sci., 2009, 326, 4–8 CrossRef CAS.
- B. Shi, Y. Li, H. Zhang, W. Wu, R. Ding, J. Dang and J. Wang, J. Membr. Sci., 2016, 498, 242–253 CrossRef CAS.
- H.-S. Dang and P. Jannasch, Macromolecules, 2015, 48, 5742–5751 CrossRef CAS.
- W.-H. Lee, A. D. Mohanty and C. Bae, ACS Macro Lett., 2015, 4, 453–457 CrossRef CAS.
- B. Wang, W. Sun, F. Bu, X. Li, H. Na and C. Zhao, Int. J. Hydrogen Energy, 2016, 41, 3102–3112 CrossRef CAS.
- C. Chen, Y.-L. S. Tse, G. E. Lindberg, C. Knight and G. A. Voth, J. Am. Chem. Soc., 2016, 138, 991–1000 CrossRef CAS PubMed.
- Y. Li, Y. Liu, A. M. Savage, F. L. Beyer, S. Seifert, A. M. Herring and D. M. Knauss, Macromolecules, 2015, 48, 6523–6533 CrossRef CAS.
- T. Bayer, B. V. Cunning, R. Selyanchyn, T. Daio, M. Nishihara, S. Fujikawa, K. Sasaki and S. M. Lyth, J. Membr. Sci., 2016, 508, 51–61 CrossRef CAS.
- T. S. Olson, S. Pylypenko, P. Atanassov, K. Asazawa, K. Yamada and H. Tanaka, J. Phys. Chem. C, 2010, 114, 5049–5059 CAS.
- L. Liu, S. He, S. Zhang, M. Zhang, M. D. Guiver and N. Li, ACS Appl. Mater. Interfaces, 2016, 8, 4651–4660 CAS.
- S. P. Ertem, T.-H. Tsai, M. M. Donahue, W. Zhang, H. Sarode, Y. Liu, S. Seifert, A. M. Herring and E. B. Coughlin, Macromolecules, 2015, 49, 153–161 CrossRef.
- R. Espiritu, M. Mamlouk and K. Scott, Int. J. Hydrogen Energy, 2016, 41, 1120–1133 CrossRef CAS.
- Y. Zhao, K. Yoshimura, H. Shishitani, S. Yamaguchi, H. Tanaka, S. Koizumi, N. Szekely, A. Radulescu, D. Richter and Y. Maekawa, Soft Matter, 2016, 12, 1567–1578 RSC.
- K. M. Hugar, H. A. Kostalik IV and G. W. Coates, J. Am. Chem. Soc., 2015, 137, 8730–8737 CrossRef CAS PubMed.
- D. Guo, Y. Z. Zhuo, A. N. Lai, Q. G. Zhang, A. M. Zhu and Q. L. Liu, J. Membr. Sci., 2016, 518, 295–304 CrossRef CAS.
- O. I. Deavin, S. Murphy, A. L. Ong, S. D. Poynton, R. Zeng, H. Herman and J. R. Varcoe, Energy Environ. Sci., 2012, 5, 8584–8597 CAS.
- L. Gao, G. He, Y. Pan, B. Zhao, X. Xu, Y. Liu, R. Deng and X. Yan, J. Membr. Sci., 2016, 518, 159–167 CrossRef CAS.
- O. M. Page, S. D. Poynton, S. Murphy, A. L. Ong, D. M. Hillman, C. A. Hancock, M. G. Hale, D. C. Apperley and J. R. Varcoe, RSC Adv., 2013, 3, 579–587 RSC.
- F. Zhang, H. Zhang and C. Qu, J. Mater. Chem., 2011, 21, 12744–12752 RSC.
- M. Guo, J. Fang, H. Xu, W. Li, X. Lu, C. Lan and K. Li, J. Membr. Sci., 2010, 362, 97–104 CrossRef CAS.
- H. L. Ngo, K. LeCompte, L. Hargens and A. B. McEwen, Thermochim. Acta, 2000, 357, 97–102 CrossRef.
- H. L. Lu, S. Hong and T. Chung, Macromolecules, 1998, 31, 2028–2034 CrossRef CAS.
- A. Buonerba, M. Fienga, S. Milione, C. Cuomo, A. Grassi, A. Proto and C. Capacchione, Macromolecules, 2013, 46, 8449–8457 CrossRef CAS.
- C. Fodor, A. Domján and B. Iván, Polym. Chem., 2013, 4, 3714–3724 RSC.
- D. J. Yang, H. J. Kim and D. H. Kim, Catalysts, 2013, 3, 176–188 CrossRef CAS.
- H. Pu, Polymer International, 2003, 52, 1540–1545 CrossRef CAS.
- T. Feng, B. Lin, S. Zhang, N. Yuan, F. Chu, M. A. Hickner, C. Wang, L. Zhu and J. Ding, J. Membr. Sci., 2016, 508, 7–14 CrossRef CAS.
- Y. Liu, J. Wang, Y. Yang, T. M. Brenner, S. e. Seifert, Y. Yan, M. W. Liberatore and A. M. Herring, J. Phys. Chem. C, 2014, 118, 15136–15145 CAS.
- A. M. Park, R. J. Wycisk, X. Ren, F. E. Turley and P. N. Pintauro, J. Mater. Chem. A, 2016, 4, 132–141 CAS.
- N. J. Robertson, H. A. Kostalik IV, T. J. Clark, P. F. Mutolo, H. D. Abruña and G. W. Coates, J. Am. Chem. Soc., 2010, 132, 3400–3404 CrossRef CAS PubMed.
- S. P. Ertem, T.-H. Tsai, M. M. Donahue, W. Zhang, H. Sarode, Y. Liu, S. Seifert, A. M. Herring and E. B. Coughlin, Macromolecules, 2015, 49, 153–161 CrossRef.
- Y. Zhou, J. Yang, H. Su, J. Zeng, S. P. Jiang and W. A. Goddard, J. Am. Chem. Soc., 2014, 136, 4954–4964 CrossRef CAS PubMed.
- A. H. Rao, S. Nam and T.-H. Kim, RSC Adv., 2016, 6, 16168–16176 RSC.
- Y. He, L. Wu, J. Pan, Y. Zhu, X. Ge, Z. Yang, J. Ran and T. Xu, J. Membr. Sci., 2016, 504, 47–54 CrossRef CAS.
- K. M. Meek and Y. A. Elabd, Macromolecules, 2015, 48, 7071–7084 CrossRef CAS.
- S. D. Sajjad, Y. Hong and F. Liu, Polym. Adv. Technol., 2014, 25, 108–116 CrossRef CAS.
- J. Wang, S. Gu, R. B. Kaspar, B. Zhang and Y. Yan, ChemSusChem, 2013, 6, 2079–2082 CrossRef CAS PubMed.
- S. D. Sajjad, D. Liu, Z. Wei, S. Sakri, Y. Shen, Y. Hong and F. Liu, J. Power Sources, 2015, 300, 95–103 CrossRef CAS.
- Y. Zhao, H. Yu, D. Yang, J. Li, Z. Shao and B. Yi, J. Power Sources, 2013, 221, 247–251 CrossRef CAS.
- W. Li, J. Fang, M. Lv, C. Chen, X. Chi, Y. Yang and Y. Zhang, J. Mater. Chem., 2011, 21, 11340–11346 RSC.
- M. Liu, Z. Wang, J. Mei, J. Xu, L. Xu, H. Han, H. Ni and S. Wang, J. Membr. Sci., 2016, 505, 138–147 CrossRef CAS.
- A. N. Lai, D. Guo, C. X. Lin, Q. G. Zhang, A. M. Zhu, M. L. Ye and Q. L. Liu, J. Power Sources, 2016, 327, 56–66 CrossRef CAS.
- S. Gu, R. Cai, T. Luo, K. Jensen, C. Contreras and Y. Yan, ChemSusChem, 2010, 3, 555–558 CrossRef CAS PubMed.
| This journal is © The Royal Society of Chemistry 2017 |

