 Open Access Article
Effect of asphaltene precipitation on CO2-flooding performance in low-permeability sandstones: a nuclear magnetic resonance study
Chen Wanga,
Tiantai Li*a,
Hui Gaoa,
Jinsheng Zhaoa and
Huazhou Andy Li *b
*b
aSchool of Petroleum Engineering, Xi'an Shiyou University, Xi'an, China 710065. E-mail: ttli@xsyu.edu.cn
bSchool of Mining and Petroleum Engineering, Faculty of Engineering, University of Alberta, Edmonton, Canada T6G 1H9. E-mail: huazhou@ualberta.ca; Fax: +1-780-492-0249; Tel: +1-780-492-1738
First published on 4th August 2017
Abstract
With nuclear magnetic resonance (NMR), a novel experimental study is conducted to reveal the pore-scale formation damage mechanism of tight sandstones caused by asphaltene precipitation during CO2 flooding. For each core-flooding experiment, the T2 responses of the hydrogen nucleus in the core samples are measured before and after CO2 flooding, and then compared to quantitatively determine the asphaltene precipitate distribution in pore throats with different sizes. It is found that in the immiscible flooding stage, the degree of asphaltene precipitation increases with an increase in the CO2 injection pressure. After entering the miscible flooding stage, asphaltene can be still precipitated, but with a much lower magnitude. The core permeability tends to be reduced after CO2 flooding, and the permeability reduction is positively correlated with the amount of asphaltene precipitated. The results of the NMR experiments show that during the immiscible flooding stage, oil is recovered primarily from the relatively larger pores. A small amount of asphaltene precipitation occurs in the larger pores (1–1000 ms), filling up a small portion of these pore spaces, while little asphaltene shows up in the smaller pores (0.01–1 ms). As the pressure increases beyond the minimum miscibility pressure (MMP), more oil contained in smaller pores is able to be recovered. The smaller pores tend to be more affected by the precipitated asphaltene in comparison to the larger pores. With the asphaltene-filling phenomenon taking place more in the smaller pores, the tight-core permeability can be substantially compromised after CO2 flooding.
1. Introduction
Tight sandstone reservoirs, a type of unconventional reservoir, are playing an important role in fulfilling the increasing energy supply over the world. Due to the unique characteristics of the tight sandstone reservoirs, including low porosity, low permeability, complex pore-throat configurations, and high heterogeneity, oil recovery from such reservoirs is rather low.1–3CO2 flooding has been widely applied to enhanced oil recovery, not only from conventional reservoirs but also from unconventional ones. Under reservoir conditions, supercritical CO2 would interact with crude oil in the pore space, leading to significantly favorable effects such as reduced interfacial tension, reduced crude oil viscosity, and enhanced swelling of oil.4–6 At pressures higher than the minimum miscibility pressure (MMP), a 100% oil recovery can be theoretically achieved with CO2 flooding.7 Hence, it is reasonable to infer that CO2 can be a suitable agent for oil recovery in tight sandstone reservoirs. However, the performance of CO2 flooding in tight oil reservoirs could be overshadowed by not only the fact that the injectivity of CO2 is low in the tight sandstones, but also by the fact that the asphaltene precipitation due to CO2–oil interaction can cause formation damage issues. Behbahani et al. experimentally demonstrated that during the CO2 flooding, the injection pressure has a significant impact on the amount of asphaltene precipitated; as pressure increases, more asphaltene tends to be precipitated.8 Such precipitated asphaltene will reduce the permeability of the core, which tends to compromise the oil recovery contributed by the enhanced CO2 dissolution in oil.9
To understand the effect of asphaltene precipitation on oil recovery, extensive studies have been conducted to investigate asphaltene precipitation in high-permeability porous media due to CO2 flooding. It has been found that when the asphaltene precipitation appears in the micro-pores in sandstone reservoirs, the larger agglomerates will block up the pore throat directly, while the smaller ones will cause a blockage of the pore throat through a bridging effect at the throat.10 Both of these effects can lead to a significant decrease in permeability, and thus decrease the overall oil recovery during CO2 flooding.11–13 Papadimitriou et al. reported that the precipitated asphaltene will clog the reservoir pores and lead to a 40–90% decrease in permeability.14 Much less research has been conducted to understand the effect of asphaltene precipitation on CO2 flooding performance in low-permeability sandstones compared the extensive researches that have been dedicated to the high-permeability sandstones. Wang et al. demonstrated that, during immiscible CO2 flooding, an increase in the injection pressure results in an increase in the oil recovery factor, which is nevertheless accompanied by an decreased permeability due to the increased amount of asphaltene precipitated at higher pressures; the amount of asphaltene precipitated keeps increasing even after the injection pressure is higher than the MMP, albeit with a lessened degree.15 Cao and Gu showed in their experiments that the oil recovery increases monotonically as the injection pressure increases in the immiscible flooding because of the increased CO2 dissolution in the crude oil. When the injection pressure exceeds the MMP, the oil recovery increases slightly and reaches the maximum afterwards at a higher pressure. In addition, it is observed that the amount of asphaltene precipitation increases continuously in the immiscible and miscible region, and similar observations can be made with regard to the variation trend of the core permeability.16 What is lacking in the previous research is that no investigation has been made to quantify how the asphaltene blocks the pores with different sizes.
It is worthwhile mentioning that, in addition to the asphaltene precipitation issue, another process, i.e., the CO2/rock reactions may also reduce the sandstone permeability. Yu et al. conducted an experimental study of CO2/brine/sandstone interaction under in situ pressure/temperature reservoir conditions. It was found that carbonate materials in the natural core, such as calcite and ankerite, were dissolved during the CO2/rock reactions; as a result, solid precipitates and clays (e.g., kaolinite) were generated. The solid precipitates and clay particles will migrate into the pore space and possibly accumulated at pore throats, leading to a significant decrease in permeability.17 Mohamed et al. experimentally demonstrated that, the CO2/rock reactions bring about 35% to 55% loss in core permeability during the CO2 injection in the sandstone reservoirs.18 Other studies have reported similar findings. But it is noted that all these studies have used natural cores that are retrieved from hydrocarbon reservoirs. Since the natural cores contain feldspars, calcite and ankerite, the asphaltene precipitation and CO2/rock reactions will both take place during CO2 flooding of the natural cores. Therefore, the use of natural cores to investigate the effect of asphaltene precipitation makes it hard to delineate the individual contributions of asphaltene precipitation and CO2/rock reactions towards the permeability reduction. In this research, we are able to elucidate the sole impact of asphaltene precipitation on permeability reduction. We have excluded the effect of CO2/rock reactions by using artificial core samples which do not contain carbonate cementing materials. In addition, there is no quantitative investigation in previous research with regard to: (1) how the asphaltene precipitation alters the pore structures with different sizes; (2) how pore-structure variation results in decreased permeability; and (3) how such pore-structure variation influences the recovery of oil residing in different pores by CO2 injected. Therefore, it is of great importance to understand the sole influence of asphaltene precipitation on the alteration of pore size distribution and thereby the permeability reduction of core samples during CO2 flooding.
In this study, tight artificial cores are used in the experiment to make sure that the change of permeability is only caused by asphaltene precipitation. The cores used consist only of quartz, which ensures that no CO2/rock reactions will occur during a CO2 flood. Eight CO2 core-flooding tests are conducted at the immiscible, near-miscible and miscible conditions. During these tests we measure the oil recovery factors, the amount of asphaltene precipitated, and the decrease in permeability. To elaborate on the detailed mechanisms of the reduction in permeability due to asphaltene precipitation, the nuclear magnetic resonance (NMR) is employed to quantitatively evaluate the distribution of asphaltene precipitation in the pore-throat configurations. 1H NMR relaxometry has found extensive applications in exploring surface interactions in catalysts19 as well as characterizing the properties of porous materials such as metal–organic frameworks,20 silica gels, zeolites, cement, cellulose fibers and rock samples.21 To our knowledge, this study is the first attempt to quantitatively evaluate the effect of CO2 flooding on asphaltene precipitation on the microscopic pore-structure alterations with the aid of NMR technique.
2. Experimental section
2.1 Materials
The cores used in this experiment are the low-permeability artificial cores (cementation of quartz) manufactured from Northeast Petroleum University in China. The artificial cores are prepared with cement and quartz. The following cement/quartz ratios are used: cement weight percentage between 5–15 wt% and quartz weight percentage between 85–95 wt%. Epoxy resin and three additives (dibutyl phthalate, ethylenediamine and acetone) are added into the cement according to following recipe: 0.5 to 1.5 wt% of epoxy resin, 0.1 to 0.5 wt% of dibutyl phthalate, 0.01 to 0.1 wt% of ethylenediamine, and 0.1 to 1.0 wt% of acetone. The process for the core preparation is described as follows: (1) first, stir the quartz sand and cements evenly, and then place the mixture into a mold; (2) place the mold on a press and apply a pressure of 8.3 MPa to press the mold for 15 min; (3) next, place the compressed core in an oven and heat it at 85 °C for 8 h; (4) after heating, move the core out of the oven and let it cool down under room conditions; (5) after being left alone for 48 hours, the core can be used to conduct the flooding experiments. The properties of the cores are listed in Table 2.The crude oil is collected from Jiyuan oilfield in Ordos basin, China. The density and viscosity of the crude oil sample are measured to be 760 kg m−3 and 1.6 mPa s at reservoir conditions of 80 °C and 15 MPa. The asphaltene content of the crude oil is measured to be 1.15 wt% (n-pentane insoluble). Before performing the experiments, wax and SARA (saturates, aromatics, resins and asphaltenes) contents in the oil sample are also measured. The wax content is measured by the thin-layer chromatography/flame ionization detection (TLC-FID) method, while the SARA analysis is conducted using the thin-layer chromatography (TLC).22,23 Wax, asphaltenes and resins are the typical materials found in crude oil that can be precipitated at specific conditions. Table 1 shows the measured contents of wax, asphaltenes and resins. The effect of wax/resins precipitation can be neglected due to their relatively low concentrations in the oil sample. Furthermore, the experimental temperature in this study is maintained at 80 °C which is much higher than the wax appearance temperature. Therefore, the chance of wax precipitation occurring in the core sample is extremely low.
| Component | Asphaltenes | Resins | Waxes |
|---|---|---|---|
| Weight percentage | 1.15 wt% | 0.14 wt% | 0.11 wt% |
| Core sample | 1 | 2 | 3 | 4 | 5 | 6 | 7 | 8 |
|---|---|---|---|---|---|---|---|---|
| Length (mm) | 200.2 | 200.0 | 200.1 | 200.5 | 199.2 | 199.9 | 200.3 | 200.0 |
| Core radius (mm) | 25.1 | 25.0 | 24.9 | 24.7 | 25.0 | 25.0 | 25.1 | 25.4 |
| Porosity (%) | 4.8 | 4.5 | 4.6 | 4.5 | 4.4 | 4.5 | 4.8 | 4.7 |
| Injection pressure (MPa) | 4.6 | 7.2 | 8.5 | 15.2 | 20.7 | 23.2 | 25.5 | 35.2 |
| Permeability (mD) | 0.22 | 0.21 | 0.22 | 0.22 | 0.22 | 0.21 | 0.22 | 0.22 |
| Relative reduction in the permeability (%) | 0 | 9.09 | 13.63 | 18.18 | 27.27 | 36.36 | 40.91 | 45.45 |
| Percentage of asphaltene precipitated after 7 PVs of CO2 injection (%) | 12.56 | 15.18 | 17.33 | 22.23 | 24.23 | 30.91 | 33.15 | 36.26 |
| Final oil recovery after 7 PVs of CO2 injection (%) | 27.35 | 44.05 | 56.11 | 61.17 | 81.65 | 85.90 | 87.98 | 89.12 |
The manually prepared water has a salinity of 30![[thin space (1/6-em)]](https://www.rsc.org/images/entities/char_2009.gif) 000 mg L−1, a salt type of CaCl2, and viscosity of 0.4 mPa s at 80 °C and 15 MPa. It is used in the experiments to simulate the formation water. CO2 with a purity of 99.9% is supplied by Xi'an Specific Standard Coal Gas Supply Station (China).
000 mg L−1, a salt type of CaCl2, and viscosity of 0.4 mPa s at 80 °C and 15 MPa. It is used in the experiments to simulate the formation water. CO2 with a purity of 99.9% is supplied by Xi'an Specific Standard Coal Gas Supply Station (China).
2.2 Experimental setup
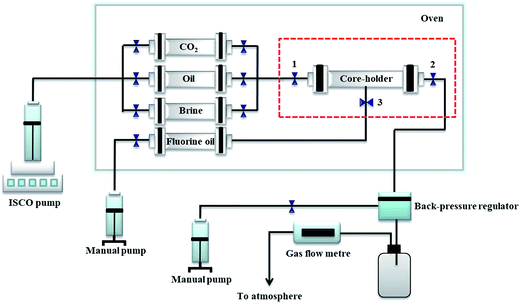
The experimental setup used for conducting the core flood experiments is provided in Fig. 1. A syringe pump (ISCO-260D, Teledyne Isco, Lincoln, NE, America) is used to inject the crude oil, formation water or CO2 from the high pressure cylinders (Huaxing Co., Nantong, China) to the core holder (Huaxing Co., Nantong, China) which is a special core holder used for NMR setup. The ISCO-260D syringe pump has a pressure range of 0–51.7 MPa and a rate range of 0.001–80 mL min−1. The core holder can be operated at a pressure of 50 MPa and a temperature of 150 °C. The back pressure is controlled by a back-pressure regulator (BPR-50, Temco, USA) and the gas production volume is measured by a gas flow meter (Puttom Co., Beijing, China). An electric heater (Huaxing Co., Nantong, China) is used to heat the oven and maintain the temperature at 80 °C.The NMR apparatus (Mini-MR, Niumag, China) is purchased from Suzhou Niumag Corporation, China (http://en.niumag.com). Its magnetic intensity, gradient value and frequency range are 0.5 T, 0.025 T m−1 and 1–30 MHz, respectively. Its control precision is 0.01 MHz. The parameters of the NMR apparatus are set as follows: Te (time of echo), 0.27 ms; Tw (time of wait), 4000 ms; Nech (number of echo), 6000; Ns (number of scan), 64; the pulse width is divided into 90° pulse width (P1 = 22) and 180° pulse width (P2 = 40). For precision control purpose, calibration of the NMR apparatus is required prior to each measurement. The calibration is deemed to be acceptable if the NMR is able to detect the T2 signal of a 10 mg water film.
2.3 Experimental procedures
The slim tube test apparatus is composed of three parts: the injection system, the slim tube and the production system. The slim tube, which is filled with quartz sand, has a length of 20 m and a diameter of 3.75 mm. Before the measurements, the tube is cleaned and dried at 100 °C for 6 h in the oven. Then we measure the air permeability and porosity of the slim tube. The experimental temperature is set to 80 °C and the pressure levels considered in this research include the following: 14 MPa, 18 MPa, 22 MPa, 26 MPa, and 30 MPa. The oil displacement efficiency is found to be less than 90% at two pressure points (14 MPa and 18 MPa) but higher than 90% at the other three pressures.27,28 During the test, the injection rate is maintained at 0.125 mL min−1. But when the gas breaks through, this rate cannot maintain a constant injection pressure; so we properly increase the injection rate to maintain a constant injection pressure in this case. We terminate the slim tube experiment when the volume of CO2 reaches 1.2 times of the core's pore volume (PV). Finally, the pressure-recovery curve is drawn and analyzed to determine the MMP.
(1) The artificial core samples are cleaned and dried at 100 °C for 8 h in the oven. The air permeability is measured by a gas permeameter (Ultraperm – 500 TM, TEMCO, USA).
(2) In order to saturate the core, the core is placed in a sealed container and emerged in the simulated formation water. The sealed container is vacuumed for 24 h under a pressure of −80 kPa, allowing formation water to enter the core sample. Once the core weight remains unchanged the water saturation process is deemed to be terminated. To calculate the porosity, the core is weighed before and after water saturation. The following equation is used to calculate the porosity on the basis of the weight difference of the core before and after water saturation,
 | (1) |
 | (2) |
(3) At this point, the core sample is also scanned by the NMR apparatus to obtain a T2 response under initial water-saturated condition.
(4) The core is displaced with the MnCl2 solution (15![[thin space (1/6-em)]](https://www.rsc.org/images/entities/char_2009.gif) 000 mg L−1) by 3–4 PV in order to eliminate the hydrogen signal of brine. After the displacement the core sample is scanned again by the NMR apparatus.
000 mg L−1) by 3–4 PV in order to eliminate the hydrogen signal of brine. After the displacement the core sample is scanned again by the NMR apparatus.
(5) The core sample is placed in a core holder, and the oil is injected into the core sample with an injection rate of 0.01 mL min−1 until water cut is less than 1%. Upon the end of oil saturation, the T2 response of the core sample is measured again.
(6) CO2 is injected into the core sample at a constant rate of 0.5 mL min−1 at 80.0 °C to conduct experiments at eight pressures of 4.6 MPa, 7.2 MPa, 8.5 MPa, 15.2 MPa, 20.7 MPa, 23.2 MPa, 25.5 MPa, and 35.2 MPa. These pressures are maintained by the back-pressure at the rear of the core holder. The back-pressure is kept 1.0 MPa lower than the injection pressure.
(7) The injection pressure, injection rate, confining pressure and back pressure are all recorded. We collect the produced oil and gas. When the amount of CO2 injected reaches 7 PV, the displacement is completed and the asphaltene content of the produced oil is measured by a spectrophotometer.
(8) After the CO2 flooding test, the core samples are cleaned with benzene and dried at 100 °C for 12 h in the oven. Afterwards, its permeability and porosity are measured again.
(9) After CO2 flooding test, the core sample undergoes the same treatments as described from step 1 to step 4. Eventually, another NMR scan is used to reveal the oil distribution across the different pores of the core sample. It is noted that the NMR scan is also made again in the step 2.
As shown in Fig. 1, to conduct a NMR scan we close valves #1, #2 and #3, decouple the core holder from the flooding apparatus and then place it in the NMR apparatus for T2 scan. The coreflooding apparatus and the NMR apparatus are placed in the same room 2 m apart and thus the nonmagnetic core holder can quickly loaded to the NMR apparatus for testing. The time needed for handling the core holder and conducting NMR scans is relatively short (maximum several minutes), and therefore fluid shrinkage in the core can be ignored.29 These measures greatly minimise the chance of isolation/depressurization and cooling occurring in the core holder during the NMR scan.
The total T2 response of fluids in the tight core samples is given as,30,31
 | (3) |
For fluids flow in the core samples, the transverse relaxation time due to the fluids diffusion (T2B) and due to the bulk relaxation (T2D) can be reasonably neglected, that is, only the relaxation time from the core surface (T2S) mainly contributes to the total T2 response.29 Furthermore, the rock-surface relaxation strongly correlates with the specific area of the rock sample, which is defined as the ratio of the surface area of a pore to the volume of the same pore. A larger specific area can result in a stronger T2 relaxation but a smaller T2 relaxation time. Therefore, the T2 response can be expressed as,32,33
 | (4) |
 | (5) |
| r = CT2 | (6) |
3. Results and discussion
3.1 CO2–oil MMP
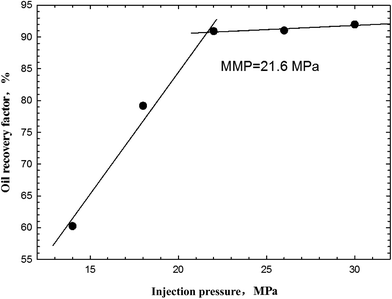
The recovery factor of the slim tube test is described in Fig. 2. At injection pressures lower than the MMP (14.0 MPa and 18.0 MPa), it can be found that the recovery factor increases rapidly from 60.23% to 79.18% as the injection pressure increases. This corresponds to a typical immiscible flooding stage. When the injection pressure is higher than 21.6 MPa, the oil recovery factor is more than 90% and increases slowly as the pressure increases, indicating a miscible flooding stage. As such, the MMP of the crude oil can be determined to be 21.6 MPa since this pressure corresponds to the breakpoint of the oil recovery curve and the recovery factor at this pressure is above 90%.36,37We also compare this measured MMP to the MMP calculated by an empirical correlation. The CO2–oil MMP correlation was initially proposed by Alston et al. and improved by Li et al.37,38 Using this correlation, the MMP is calculated to be 20.5 MPa, showing a 5% relative deviation from the measured MMP.
3.2 Oil recovery due to CO2 flooding
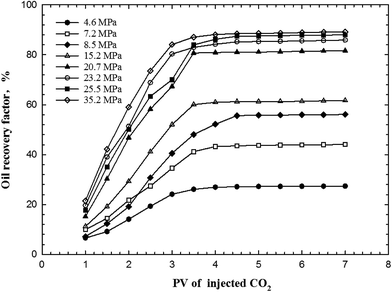
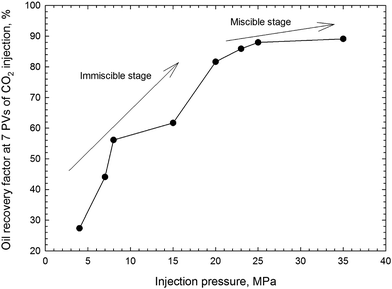
It can be seen from Fig. 3 that when the volume of CO2 injected changes from 1 PV to 4 PV, the oil recovery increases rapidly. Afterward, the oil recovery only increases slightly with a further increase in the CO2 injection volume. Fig. 4 shows the oil recovery factors achieved after 7.0 PVs of CO2 injection vs. the CO2 injection pressure. As seen from Fig. 4, the oil recovery factor tends to increase quickly with an increase in pressure in the immiscible flooding stage. In the immiscible flooding stage, CO2 density increases sharply as pressure increases, leading to faster dissolution of CO2 in crude oil contained in the core sample. The large amount of CO2 dissolved in the crude oil reduces the viscosity of the crude oil, reduces the interfacial tension between CO2 and oil, and swells the volume of the crude oil.6,15 All these beneficial effects lead to a quick recovery of oil in this stage. After entering the miscible flooding stage, these beneficial effects are diminishing, leading to only a slight increase in the recovery factor. Overall, the recovery curve, which is obtained by the CO2 coreflooding experiments, echoes well with that obtained by the slim tube experiments.
 | (7) |
 | ||
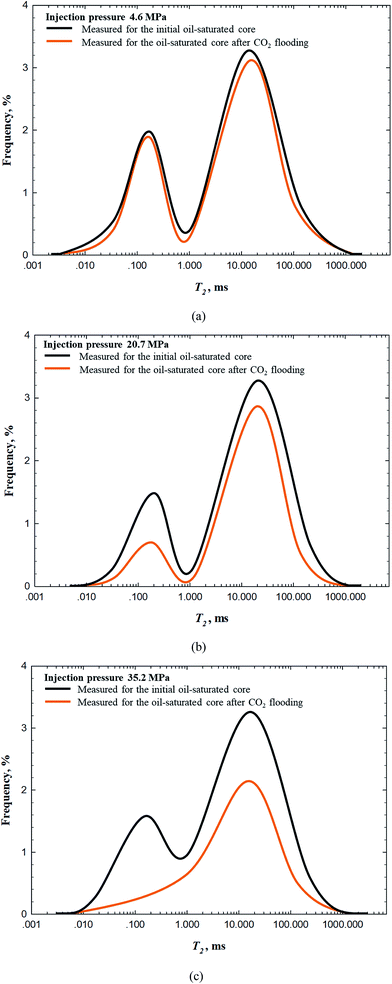
| Fig. 5 Measured T2 responses of core samples before and after the CO2 flooding conducted at: (a) 4.6 MPa; (b) 20.7; and (c) 35.2 MPa. | ||
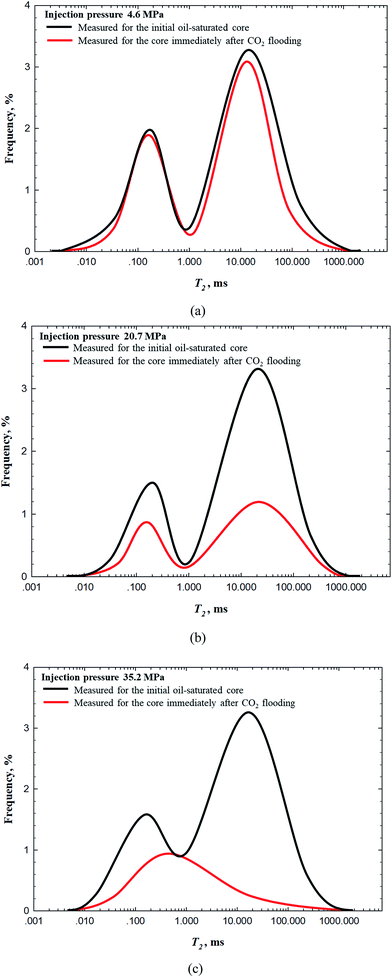
T2 profiles with different levels of intensity are detected at the end of the various CO2 flooding experiments. As for these three cases, the drops in the right peak of the T2 response are all more obvious than that in the left peaks of the T2 response. This indicates that the oil in the larger pores (1–1000 ms) can be more easily accessed and recovered by the injected CO2 than that in the smaller pores (0.01–1 ms). The left peak of the T2 response for the core #1 exhibits a smaller drop. It means that less oil in small pores (0.01–1 ms) has been displaced and recovered by CO2. Based on these observations, we can infer that, compared to the larger pores (1–1000 ms), the smaller pores (0.01–1 ms) can be more easily blocked/filled by the asphaltenes that are precipitated during the CO2 flooding process.
3.3 Asphaltene precipitation and permeability reduction
The percentage of asphaltene precipitated is calculated by comparing the asphaltene contents in the original oil sample and the produced oil, while the percentage of permeability reduction is calculated by comparing the permeability of the core before and after CO2 flooding, while. The following equation is used to calculate the percentage of asphaltene precipitation,
 | (8) |
 | (9) |
Table 2 also shows the percentage of asphaltene precipitated as well as the relative reduction in the permeability after each flooding experiment. At an injection pressure of 4.6 MPa, asphaltene precipitation first appears, leading to that the asphaltene content in the produced crude oil is reduced compared to that in the original oil sample. Fig. 6 plots the percentage of asphaltene precipitated after 7 PVs of CO2 injection and the relative permeability reduction of the core samples at different injection pressures. It can be seen from Fig. 6 that, in the immiscible flooding stage, the amount of asphaltene precipitation tends to significantly increase as the pressure increases. When the injection pressure rises above the MMP, we can still observe asphaltene precipitation after the CO2 flooding experiments, but such precipitation is much less compared to that resulted from the immiscible flooding. These findings are generally consistent with those reported in Wang and Gu.15
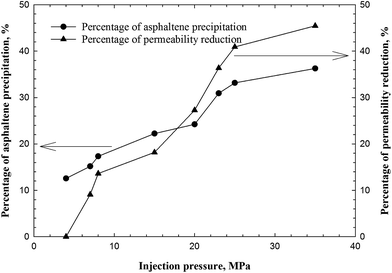 | ||
| Fig. 6 The percentage of asphaltene precipitated and the relative reduction in permeability of the core samples at different injection pressures. | ||
Similarly, the permeability of the core samples is seen to decreases with increased injection pressure. This is attributed to the fact that the amount of asphaltene precipitated in the core samples is increased as pressure increases. It can be observed from Fig. 6 that the degree of permeability reduction is positively correlated with the percentage of asphaltene precipitated. In the immiscible flooding stage, an increase in pressure results in more severe asphaltene precipitation. With more asphaltene precipitated, more pore spaces can be blocked by the asphaltene. As a result, a more severe reduction in the core permeability ensues. A question arises here with regard to how the asphaltene precipitation has blocked the pore spaces in the core sample, and thereby altered the pore size distribution of the core sample. This will be addressed by the NMR tests discussed in Section 3.4.
3.4 Effect of asphaltene precipitation on NMR responses
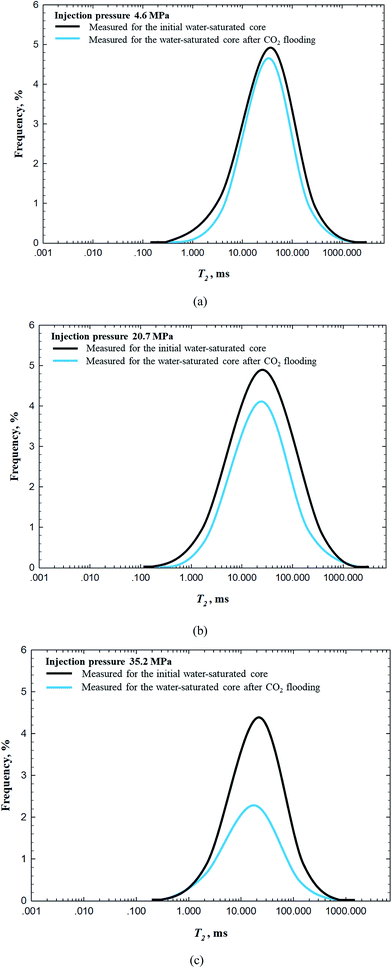 | ||
| Fig. 7 Comparison of the T2 response measured for the initial water-saturated core and for the water-saturated core after CO2 flooding conducted at: (a) 4.6 MPa; (b) 20.7 MPa; and (c) 35.2 MPa. | ||
It can be observed from Fig. 7(a) that the T2 response measured for the water-saturated core after CO2 flooding (4.6 MPa) moves to a slightly lower position compared to that measured for the initial water-saturated core. This indicates, after CO2 flooding, a small portion of the larger pores is clogged by the asphaltene precipitated. The blockage of the larger pores becomes more severe when the CO2 flooding is conducted at higher pressures, as illustrated by Fig. 7(b) and (c).
4. Conclusions
We conduct an experimental study to reveal the formation damage mechanism of tight cores due to asphaltene precipitation during CO2 flooding. Because of the use of artificial tight cores, we make sure that only asphaltene will be the major solid phase that is precipitated during CO2 flooding, while the solid precipitation due to CO2/rock reactions is excluded. The following conclusions can be obtained from the study:•In the immiscible flooding stage, the degree of asphaltene precipitation increases with an increase in the CO2 injection pressure. After entering the miscible flooding stage, asphaltene can be still precipitated, but with a much lower magnitude. The reduction in the core permeability after CO2 flooding shows a similar dependence on CO2 injection pressure.
•A comparison is made between the T2 response measured for the initial oil-saturated core and the T2 response measured for the core immediately after CO2 flooding. It is found that, in the immiscible flooding stage, the oil recovery mainly originates from the recovery of the oil that is contained in the relatively larger pores. As the pressure increases beyond the MMP, more oil contained in the smaller pores is able to be tapped.
•We also compare the T2 response measured for the initial water-saturated core and the T2 response measured for the water-saturated core after CO2 flooding. The comparison shows that in the immiscible flooding stage, a small amount of asphaltene precipitation occurs in the larger pores (1–1000 ms), filling up small portion of these pore spaces, while little asphaltene shows up in the smaller pores (0.01–1 ms). In the miscible flooding stage, the smaller pores tend to be more affected by the precipitated asphaltenes compared to the larger pores, leading to a substantial decrease in the core permeability.
Acknowledgements
C. Wang thanks the visiting PhD scholarship provided by the China Scholarship Council (CSC) for supporting his stay at the University of Alberta. The authors also acknowledge the editorial assistance provided by Sean Perkins in preparing the manuscript.References
- D. J. Soeder and P. L. Randolph, SPE Form. Eval., 1987, 2, 129–136 CrossRef CAS.
- P. H. Nelson, AAPG Bull., 2009, 93, 329–340 CrossRef.
- L. Xiao, C. C. Zou and X. H. Xie, Australian Society of Exploration Geophysicists, 2016, 575–580 Search PubMed.
- K. Asghari, M. Dong, J. Shire, T. Coleridge, J. Nagrampa and J. Grassick, SPE Prod. Oper., 2007, 22, 260–264 CrossRef CAS.
- Y. C. Zhao, Y. C. Song, Y. Liu, H. F. Liang and B. L. Dou, Ind. Eng. Chem. Res., 2011, 50, 4707–4715 CrossRef CAS.
- H. Z. Li, S. Zheng and D. Yang, SPE J., 2013, 18, 695–707 CrossRef.
- H. Z. Li, J. S. Qin and D. Y. Yang, Ind. Eng. Chem. Res., 2012, 51, 3516–3523 CrossRef CAS.
- T. J. Behbahani, C. Ghotbi, V. Taghikhani and A. Shahrabadi, Energy Fuels, 2012, 26, 5080–5091 CrossRef.
- R. K. Srivastava, S. S. Huang and M. Dong, SPE Prod. Facil., 1999, 14, 235–245 CrossRef CAS.
- Y. F. Hu, S. Li, N. Liu, Y. P. Chu, S. J. Park, G. A. Mansoori and T. M. Guo, SPE J., 2004, 41, 169–182 CAS.
- B. S. Soulgani, B. Tohidi, M. Jamialahmadi and D. Rashtchian, Energy Fuels, 2011, 25, 753–761 CrossRef CAS.
- P. Zanganeh, S. Ayatollahi, A. Alamdari, A. Zolghadr, H. Dashti and S. Kord, Energy Fuels, 2012, 26, 1412–1419 CrossRef CAS.
- T. J. Behbahani, C. Ghotbi, V. Taghikhani and A. Shahrabadi, Fuel, 2014, 133, 63–72 CrossRef.
- N. I. Papadimitriou, G. E. Romanos, G. C. Charalambopoulou, M. E. Kainourgiakis, F. K. Katsaros and A. K. Stubos, SPE J., 2007, 57, 281–293 CAS.
- X. Q. Wang and Y. A. Gu, Ind. Eng. Chem. Res., 2011, 50, 2388–2399 CrossRef CAS.
- M. Cao and Y. A. Gu, Fuel, 2013, 109, 157–166 CrossRef CAS.
- Z. C. Yu, L. Liu, S. Y. Yang, S. Li and Y. Z. Yang, Chem. Geol., 2012, 326, 88–101 CrossRef.
- I. M. Mohamed and H. A. Nasr-El-Din, Paper SPE 151142, presented at SPE International Symposium and Exhibition on Formation Damage Control, Lafayette, Louisiana, USA, 15–17 February, 2012 Search PubMed.
- J. Mitchell, L. M. Broche, T. C. Chandrasekera, D. J. Lurie and L. F. Gladden, J. Phys. Chem. C, 2013, 117, 17699–17706 CAS.
- T. C. Wang, N. A. Vermeulen, I. S. Kim, A. B. Martinson, J. F. Stoddart, J. T. Hupp and O. K. Farha, Nat. Protoc., 2016, 11, 149–162 CrossRef CAS PubMed.
- I. Habina, N. Radzik, T. Topor and A. T. Krzyzak, Microporous Mesoporous Mater., 2017, 252, 37–49 CrossRef CAS.
- X. Lu, B. Kalman and P. Redelius, Fuel, 2008, 87, 1543–1551 CrossRef CAS.
- D. A. Karlsen and S. R. Larter, Org. Geochem., 1991, 17, 603–617 CrossRef CAS.
- R. L. Christiansen and K. H. Haines, SPE Reservoir Eng., 1987, 2, 523–527 CrossRef CAS.
- P. M. Jarrell, C. Fox, M. Stein and S. Webb, SPE Monogr., 2002, 22 Search PubMed.
- S. B. Hawthore, D. J. Miller, L. Jin and C. D. Gorecki, Energy Fuels, 2016, 30, 6365–6372 CrossRef.
- A. M. Elsharkawy, F. H. Poettmann and R. L. Christiansen, Energy Fuels, 1996, 10, 443–449 CrossRef CAS.
- F. Yang, G. B. Zhao, H. Adidharma, B. Towler and M. Radosz, Ind. Eng. Chem. Res., 2007, 46, 1396–1401 CrossRef CAS.
- H. Gao, Y. Liu, Z. Zhang, B. Niu and H. Li, Energy Fuels, 2015, 29, 4721–4729 CrossRef CAS.
- H. Li, J. Zhu and H. Guo, Chin. J. Magn. Reson., 2008, 25, 273–280 CrossRef CAS , in Chinese.
- M. Megawati, M. V. Madland and A. Hiorth, J. Pet. Sci. Eng., 2012, 100, 123–130 CrossRef CAS.
- K. R. Brownstein and C. E. Tarr, Phys. Rev. A, 1979, 19, 2446–2453 CrossRef.
- P. Yang, H. Guo and D. Yang, Energy Fuels, 2013, 27, 5750–5756 CrossRef CAS.
- M. Megawati, M. V. Madland and A. Hiorth, J. Pet. Sci. Eng., 2012, 100, 123–130 CrossRef CAS.
- Z. Q. Mao, Y. D. He and X. J. Ren, Chin. J. Geophys., 2005, 48, 412–418 CrossRef.
- F. L. Yang, G. B. Zhao, H. Adidharma, B. Towler and M. Radosz, Ind. Eng. Chem. Res., 2007, 46, 1396–1401 CrossRef CAS.
- H. Z. Li, J. S. Qin and D. Y. Yang, Ind. Eng. Chem. Res., 2012, 51, 3516–3523 CrossRef CAS.
- R. B. Alston, G. P. Kokolis and C. F. James, SPE J., 1985, 25, 268–274 CrossRef CAS.
| This journal is © The Royal Society of Chemistry 2017 |

