 Open Access Article
Creative Commons Attribution 3.0 Unported Licence
Elastic properties of the hydrogen-bonded liquid and glassy glycerol under high pressure: comparison with propylene carbonate†
A. G. Lyapin *ab,
E. L. Gromnitskayaa,
I. V. Danilov
 ab and
V. V. Brazhkina
aInstitute for High Pressure Physics, Russian Academy of Sciences, Troitsk, Moscow, 108840 Russia. E-mail: alyapin@mail.ru
bMoscow Institute of Physics and Technology, Dolgoprudny, Moscow Region, 141701 Russia
First published on 30th June 2017
Abstract
Hydrogen bonds can significantly influence the properties of molecular glass formers, particularly with respect to their elasticity. We present an ultrasonic study of the elastic properties of liquid and glassy glycerol (a substance with hydrogen bonding) under pressure, comparing to the similar results obtained for propylene carbonate (a substance without hydrogen bonding). Pressure dependences of the isothermal bulk modulus are almost linear for both liquids with relatively similar slopes. The values of the pressure derivative of the bulk modulus (7.8 for glycerol and 8.6 for PC) indicate that the pair intermolecular interaction in both liquids is close to that in the Lennard-Jones liquid. This also firmly means that the volume–temperature scaling in glycerol with volume exponent 1.4–1.8 in contrast to PC does not correlate with the effective repulsive part of the pair potential. Pressure dependences of elastic moduli for glassy PC and glycerol are nonlinear and demonstrate similar trends with pressure. The ratio of the elastic moduli of glassy glycerol to the appropriate values of PC is approximately 2–2.5 at atmospheric pressure, as in liquid states. The Poisson's ratio of glycerol is less than that of PC and closer to 0.25 which indicates a relatively higher role of central forces. The observed differences in elastic behavior between liquid or glassy glycerol and PC are discussed in terms of the role of strong hydrogen bonding in glycerol.
1 Introduction
The main features of the structural, thermodynamic, and dynamic properties of molecular glass formers in both liquid and glassy states are determined by the intermolecular potential. Currently developed empirical force field models for intra- and intermolecular interactions in organic and molecular compounds1–3 involve summation over all atoms of different terms, including pair potentials, electrostatic contributions, angular dependent interactions, and torsion forces depending on dihedral angles. For hydrogen bonds, additional pair potential terms are usually introduced.1,2,4,5 At high pressures, the atmospheric-pressure empirical potentials1–5 may become incorrect due to, e.g., an insufficiently accurate repulsive pair potential, while quantum calculation6,7 should be still testified by experiment.In the case of organic molecular liquids consisting of small rigid molecules, the fast rotation of molecules leads to the averaging of orientation-dependent components of the intermolecular potential and simplifies an effective potential. The initial success of the free volume model for the hard-sphere liquid well demonstrates this.8,9 It was established that the relaxation properties of molecular glass formers obey the volume–temperature scaling, when, e.g., the position of the α-relaxation peak in dielectric loss,10–13 or viscosity14 are unified functions of the variable 1/(TVγ), where γ is a constant characterizing material. It is known that the thermodynamic properties of a system of soft-sphere particles with an inverse power repulsive potential U = ε(r/r0)−n (here, ε and r0 are energy and distance constants, respectively) are exact functions of 1/(TVγ) with γ = n/3.15,16 In particular, γ = 4 may be related to the repulsive part of the Lennard-Jones (LJ) potential, which will be considered below in a more general form of the m − n potential (Mie potential),17
| U = ε[(r/r0)−n − (r/r0)−m]. | (1) |
The key goal of the current study is focused on a role of hydrogen bonds in the elasticity of molecular organic glass formers under pressure. The energy of the hydrogen bond18,19 is much lower than energies of ion and covalent interactions, but it is several times higher than the typical energy of the van der Waals intermolecular forces forming the basic interaction in molecular substances. From the structural point of view, hydrogen bonds may affect orientational correlations between neighboring molecules in the liquid and a short range orientational order of molecules in the glass.
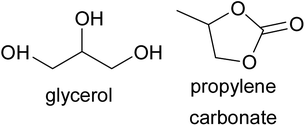
We choose glycerol C3H8O3 and propylene carbonate C4H6O3 (Fig. 1) for a comparative study of substances with and without hydrogen bonds. Both substances have quite similar chemical formulas, sizes and masses of molecules, densities, and temperature dependences of the density ρ(T), as well as the glass transition temperatures (≈157 K for PC and ≈187 K for glycerol).12,20–25 We also point to the absence of pronounced secondary relaxation in both supercooled liquids at atmospheric pressure.12,23,26–29 At the same time, each molecule of glycerol has 3 hydroxyl OH groups (Fig. 1), which can be involved in sufficiently strong hydrogen bonds O–H⋯O (here, O–H is a proton donor and O is an acceptor) between molecules. Indeed, the orthorhombic crystal phase of glycerol30 has infinite hydrogen bonded chains with each oxygen atom being involved in two hydrogen bonds both as a donor and an acceptor.31 The computer simulation of liquid glycerol shows that each molecule has the average number of hydrogen bonds equal to 5.7.32 In contrast to glycerol, three oxygen atoms in the PC molecule are bonded only with carbon in the molecular skeleton (Fig. 1), and one can only expect a formation of a very weak C–H⋯O hydrogen bonds,18,33 energy of which is quite close to that of van der Waals interaction. Because of the bonding difference, the velocity of longitudinal ultrasonic waves in liquid glycerol is by a factor of ≈1.5 higher than that in PC.34–36 Correspondingly, the bulk modulus of liquid glycerol is higher than that of PC by a factor of ≈2. The different elastic properties of both liquids reflect an expected difference between the intermolecular potentials with and without remarkable contribution of the hydrogen bonds. Ultrasonic studies of the glycerol elasticity under pressure37,38 have been carried out only at relatively low pressures.
Comparing glycerol and PC, it is necessary to note other important differences between these liquids. The volume–temperature scaling is quite different in glycerol and PC, because the exponent γ in the scaling parameter 1/(TVγ) is equal to 1.4–1.8 in glycerol12,13,39 and to 3.7–4.3 in PC.11,12,14 The appearance of pronounced secondary relaxation in glycerol at P > 2 GPa40,41 corresponds to another dynamic difference, since the absence of secondary relaxation in PC is observed up to 6 GPa.36 The pressure coefficient of the glass transition temperature (dTg/dP) of PC at P = 0 is higher than that of glycerol approximately by 2 times (≈90 K GPa−1 for PC and ≈47 K GPa−1 for glycerol).12
In this paper, we present ultrasonic measurements of the elastic moduli of liquid and glassy glycerol under pressure, comparing experimental data obtained to similar data for PC.36 The ultrasonic technique provides direct accurate measurement of the elastic moduli, their pressure derivatives, and a possible nonlinearity of particular modulus with pressure. It is important to emphasize that the experimental studies of PC36 and glycerol (this study) were performed under very close experimental kinetic conditions with the same experimental equipment. Due to nonergodic nature, the elastic properties of glasses can depend on a pressure–temperature history, as has been shown recently for PC.42
2 Experimental details
Ultrasonic experiments were carried out using a high-pressure ultrasonic piezometer based on a piston-cylinder device. The technical specifications of this piezometer and the procedure for processing experimental data are thoroughly described earlier,43 but the system for the detection of transmitted and reflected sound pulses has been considerably updated on the basis of the National Instruments PXI platform. The detection system also allows to measure the total attenuation of an ultrasonic wave in the pistons and sample. Changes in the ultrasonic signal paths (the sample length) were measured by shift of the piston with an accuracy of 0.005 mm using dial-type micrometer indicators. The measurements of the changes in the transit times (accurate to ±1 ns) of transverse and longitudinal ultrasonic pulses were performed by the pulsed method with LiNbO3 plates as piezoelectric sensors with carrier frequencies of 5 and 10 MHz, respectively. In order to calculate the shear G and bulk B elastic moduli and Poisson's ratio σ from density ρ, transverse vt and longitudinal vl ultrasonic velocities, we used the homogeneous isotropic medium approximation briefly considered in part 1 of the ESI.† In part 2 of ESI† we also consider ultrasonic measurements of elastic moduli in a state of supercooled liquid in general case and in the case of our measurements.Glycerol was purchased from the Aldrich chemical company and PC from the Acros Organics. The purity of the both materials was guaranteed to be higher than 99.5%. Liquid glycerol and PC were placed in a Teflon capsule (with an internal diameter of 16 mm and a height of 8 mm) with copper caps (with thickness of ≈1 mm). Liquid leakage from these capsules restricted the maximum attainable pressure for measurement of liquid samples at room temperature by a value of about 1 GPa. The measurements at liquid nitrogen temperature were carried out up to ≈1.8 GPa. The estimated pressure uncertainty was ±0.05 GPa at all temperatures. The temperature in the working volume was measured with four copper–constantan thermocouples located in the immediate vicinity of the sample; the temperature gradient across the sample did not exceed 1–2 K. The glass–liquid transitions were studied at natural heating of a low-temperature part of the equipment during ≈5 hours.
The pressure dependences of the sample volume V(P) and density ρ(P) were initially determined from change of its length. After a rough calculation of the bulk modulus B(P) under pressure, taking into account relation between adiabatic and isothermal moduli, the pressure dependence of the compressibility was integrated to obtain the more accurate isothermal EOS and density data (following the definition, 1/B = −(∂V/∂P)T/V). This procedure is repeated recursively (usually 2 times) to achieve a self-consistency of the EOS V(P) and the B(P) dependence with an accuracy of 1–3%.
3 Results and discussion
3.1 Liquids at room temperature
Ultrasonic measurements at megahertz frequencies provide experimental data for adiabatic elastic properties. The difference between isothermal BT and adiabatic BS moduli at room temperature is equal to ≈22% for liquid PC and to ≈14% for liquid glycerol. The pressure dependence of BS/BT was calculated from the data on the volume thermal expansion of glycerol and PC under pressure12 (see details in ESI,† part 3). Fig. 2(a) presents the pressure dependence of the isothermal bulk modulus BT (in further consideration this notation is simplified to B) calculated from adiabatic BS at room temperature for both studied liquids. At normal conditions, density of PC was taken as ρ(295 K) ≈ 1.19 g cm−3,11 while the longitudinal wave velocity was taken from Brillouin measurements,35 vl(295 K) ≈ 1510 m s−1. Similar data for glycerol was taken as ρ(295 K) ≈ 1.26 g cm−3,37,44 and vl(295 K) ≈ 1930 m s−1.34,37,38,45 The maximum pressure (0.6 GPa) achieved during the measurement of liquid glycerol (Fig. 2) was restricted by the strong absorption of ultrasonic waves in the sample due to approach to the glass transition region. For PC, pressure range up to 1 GPa was limited only by the stability of the capsule.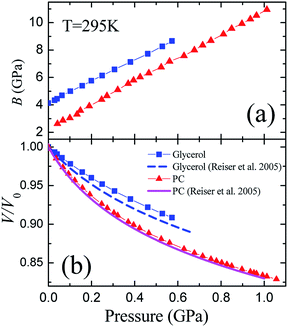 | ||
| Fig. 2 Pressure dependences of the (a) isothermal bulk modulus B and (b) relative volume V/V0 of liquid glycerol and propylene carbonate at room temperature 295 K. The calculated isothermal equations of state are compared in panel B with literature data.12 | ||
Although the initial value of B is twice higher for glycerol (Fig. 2(a)), the pressure dependence of the bulk modulus is quite similar for both substances, and both bulk moduli grow linearly with pressure at the relatively similar rates, (∂B/∂P)T ≡ B′(P) ≈ 7.8 ± 0.2 for glycerol and B′(P) ≈ 8.6 ± 0.2 for PC. Another important fact is that both pressure derivatives of the bulk modulus B′(P) are close to 8, and we discuss this in more details.
If the potential energy of some phase includes the difference between two powers of the density or inverse powers of the volume U = aρv − bρw ≡ α/Vv − β/Vw, it is known that the pressure derivative of the isothermal bulk modulus at zero pressure satisfy the relation,17 B′0 = v + w + 2. If the phase is compressed self-similar, i.e., (r/r0)3 = V/V0 is valid for any typical distance (e.g., coordination radii) of a disordered structure, the following equation can be written for a system with the m − n potential (see eqn (1)),17
 | (2) |
If the pressure-induced volume change is small, ΔV/V0 ∼ 0.1 or less, eqn (2) is quite accurately valid at non-zero pressure, and B(P) dependence is close to linear.
For the LJ 6−12 potential, B′0 = 8. This means that liquid glycerol and PC have B′0 approximately the same as the LJ liquid. Moreover, liquid glycerol and PC have close density and molecular weight. Consequently, the distance between molecules in both liquids is also relatively close. So, one can expect a spatial similarity of their pair potentials. Taking into account the definition, B = −V(∂P/∂V)T = V(∂2U(V)/∂V2) (where U(V) is full potential energy) and the spatial similarity of the both pair potentials, one can conclude that bulk modulus is proportional to potential energy (the depth of the pair potential) in a similar manner in both liquids. Thus, the significant difference between bulk modulus of the two liquids proves a significant difference in the energy of their effective pair interactions, i.e., a significant role of hydrogen bonds in glycerol.
If the effective pair potentials in PC and glycerol are close to each other and to the LJ potential (B′(PC) ≈ B′(glycerol) ≈ 8), the repulsive parts of these potentials are also similar. Correspondingly, although the exponent γ in the scaling parameter 1/(TVγ) for PC is well correlated with the repulsive exponent n of the LJ potential,11,12,14 i.e., 3γPC ≈ nLJ = 12, the corresponding value of γ for glycerol is too low, 3γglycerol ≈ 4.2−5.4,12,39 and does not absolutely correlate with the repulsive exponent n of the effective pair potential, which in principle can not be less than 8.7. The previous lowest limit for n simply follows from the relation (m + n + 6)/3 = B′0 = 7.8 for glycerol and the extreme (and impossible in the real pair potential) equality m = n in eqn (1). Thus, it is firmly established that the volume–temperature scaling in glycerol via the parameter 1/(TVγ) does not correlate with the repulsive exponent of the pair potential. Such discrepancy can naturally be associated with hydrogen bonding in glycerol. Directional hydrogen bonds can significantly affect the rotational dynamics of molecules (detected, particularly, in the dielectric spectroscopy) and crucially influence the absolute curvature of the effective pair potential, parameterized by the bulk modulus B = V(∂2U(V)/∂V2), but they insignificantly affect exponents in the effective pair m − n potential.
Considering the contribution of hydrogen bonds to the intermolecular potential, one should note that terms, responsible for hydrogen bonds in the empirical potentials, usually include the 6–12 (LJ) or 10–12 potential and the Coulomb interaction (∝1/r).2,4,5 The Coulomb contribution can lead to a partial softening of the entire pair potential with respect to the increase of B(P) with pressure. A hypothesis, that difference in B′(P) for glycerol and PC (7.8 and 8.6, respectively) can be related to the contribution of hydrogen bonds in glycerol, is easily verified by examination of water properties. Under normal conditions, the oxygen–oxygen nearest neighbor coordination is close to 4.5,46 while the average number of H bonds per water molecule is ≈ 3.5 ± 0.5.47 Still, hydrogen bonding in water can be considered as near tetrahedrally ordered. Taking the EOS of water at room temperature interpolated from the NIST database48 on the basis of the general EOS,49 it is easily established that the room-temperature B(P) dependence of water is linear at P ≤ 0.8 GPa with B′(P) = 6.2. For methanol and ethanol with strong hydrogen bonding, B′(P) ≈ 5.5 − 6.5.50
The pressure dependence of the relative volume V/V0 is presented in Fig. 2(b) for both substances. They show a typical behavior for liquids at elevated pressures. The volumes of glycerol and PC at 0.6 GPa decrease by ≈9.5 and ≈13%, respectively. We compared our data to the equation of state for glycerol and PC obtained by Reiser et al.12 from direct volumetric measurements. While our results for propylene carbonate are in a perfect coincidence with the volumetric data,12 we observe some differences in the case of glycerol. The compressibility of glycerol determined from the ultrasonic study is slightly less than that from the volumetric measurements.
3.2 Compression of glasses
The pressure dependences of the longitudinal vl and transverse vt velocities for the glassy PC36 and glycerol at 77 K are presented in Fig. 1S of ESI.† Initial values of the transverse and longitudinal sound velocities, measured by autocorrelation method, are close to those in literature, vt = 1890 m s−1 and vl = 3710 m s−1.51 The sound velocities for PC were measured previously as vt = 1250 m s−1 and vl = 2710 m s−1.36 The value of vl for glycerol exceeds that for PC by a factor of 1.3−1.4 at different pressures, while the ratio of transverse velocities varies near 1.5.The pressure dependences of calculated elastic moduli for both glasses are shown in Fig. 3. The density of glycerol at 77 K was taken as ρ = 1.38 g cm−3 from extrapolation of data for the glassy state,24 taking into account low-temperature data.51 The difference between the adiabatic and isothermal bulk moduli for glycerol and PC at 77 K (Fig. 3(b)) is about 1%. The integration of the compressibility provides the pressure dependences of the relative volume for both glasses, which are shown in Fig. 3(c). The pressure dependences of the elastic moduli of glassy PC and glycerol are nonlinear. The pressure derivatives of the bulk moduli of PC and glycerol glasses at 77 K change from ≈6.5 and ≈10 at atmospheric pressure to ≈4 and ≈3.5 at 1.8 GPa, respectively.
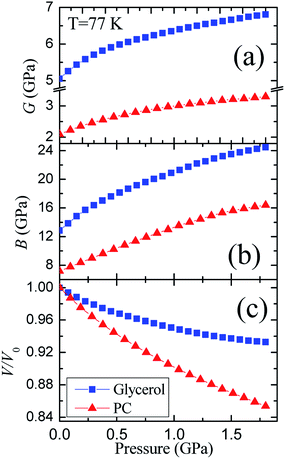 | ||
| Fig. 3 Pressure dependences of the (a) shear G and (b) bulk B moduli, as well as (c) the relative volume for glassy glycerol and propylene carbonate at liquid nitrogen temperature. | ||
The glycerol-to-PC ratios for the shear and bulk moduli change from ≈2.4 and ≈1.8 at P = 0 to ≈2.1 and ≈1.5 at P = 1.8 GPa, respectively. The ratio of the shear moduli is remarkably higher than that of the bulk moduli. Reasons for such relation are most probably connected with strong hydrogen bonds in glassy glycerol. It is well known that hydrogen bonds are quite directional,7,18,19,52,53 including partially covalent properties. This means that the orientational relaxation of molecules in glycerol is more difficult compared to PC where van der Waals forces dominate.
A similar conclusion about the role of hydrogen bonding in glycerol can be made by comparison of the Poisson's ratios (Fig. 4). The Poisson's ratio of glassy glycerol is by ≈0.04 lower than that of PC. The decrease in the σ values from PC to glycerol toward 0.25 can be qualitatively attributed to an increase in the role of central forces in glycerol. It is easy to show that 0.25 is typical for crystals with dominated central forces (see part 5 in ESI†), i.e., alkali metal halides. Taking into account that the strong O–H⋯O hydrogen bonds are directional with the O–H–O angle close to 180° (more exactly, between 160° and 180°),18,52 and the contribution of hydrogen bonds is well described by the pair central forces in the empirical potentials,2,4,5 one can conclude that the relation between Poisson's ratios for glycerol and PC with respect to 0.25 is evidence of the hydrogen bonding in glycerol. In the final part of ESI,† we also consider the known correlation between Poisson's ratio of glass formers and so-called fragility. At high pressure, this correlation is failed.
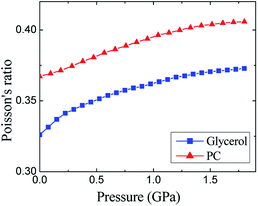 | ||
| Fig. 4 Pressure dependences of the experimental Poisson's ratios for glassy glycerol and propylene carbonate at liquid nitrogen temperature. | ||
3.3 Glass–liquid transition
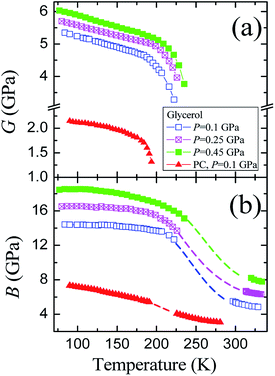
The temperature dependences of the elastic moduli of glycerol measured during isobaric heating (including the glass–liquid transition) under pressure are presented in Fig. 5. One can observe a sharp decrease in the shear modulus just above the glass transition temperature Tg. Near Tg, we lose the ultrasonic signal as described in Section 2. We also remind from this section that the frequency-dependent contribution to the elasticity is negligible for the used experimental frequencies (5–10 MHz) in the temperature intervals where ultrasonic data were collected in Fig. 5. An increase in the elastic moduli with the pressure is in accordance with previous isothermal data for glassy and liquid glycerol, and the relative shift of the dependences to higher temperatures directly indicates an increase of Tg with the pressure. Fig. 5 also presents the elastic moduli of PC at 0.1 GPa (ref. 36) measured in a similar isobaric experiment. The most striking observation is that the relative difference between the glassy and liquid bulk moduli is remarkably less in PC than in glycerol. In PC, the glass-to-liquid ratio of the bulk moduli is less than 1.5. In glycerol, this ratio is slightly higher than 2.5.The transmission data for the longitudinal wave are presented in Fig. 6. The transmission coefficient is defined here as an amplitude ratio of detecting-to-generating signals on the piezoelectric sensors. Therefore, it includes reverse attenuation in the pistons and sample, the transmission coefficient at the piston–sample and sample–piston interfaces, and the direct and inverse coefficients of transformation of the piezoelectric sensors. Obviously, the main contribution to a change in the transmission with increasing pressure in Fig. 6 is made by absorption in the sample, while the other contributions are almost independent of pressure. The transmission coefficient between the pistons and sample (or vice versa) changes insignificantly with pressure because of a significant difference between the acoustic impedances (Z = ρvl) of the piston steel and organic glycerol. Fig. 6 obviously indicates a significant increase in the longitudinal wave transmission (acoustic transparency) near the glass transition temperature with a subsequent sharp drop of transmission down to immeasurable values above Tg. This effect seems to be related to the “healing” of defects of the glass structure, appearing due to rheological processes in the solid glassy sample during compression. The existence of a relation between the acoustic transparency (Fig. 6) and the glass transition is proved by the pressure-induced temperature shift of the region of sharp drop of the glycerol transmission. For pressures of 0.1 and 0.45 GPa, this shift is equal to 15 K, whereas the corresponding shift of Tg is 13.5 K from the Tg(P) equation12 or ΔTg ≈ 15 K from the volumetric data.25
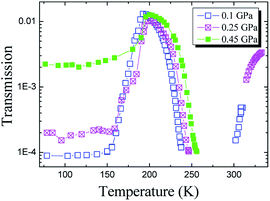 | ||
| Fig. 6 Temperature dependences of the longitudinal wave transmission through the experimental assembly with the glycerol sample at different pressures. | ||
4 Conclusion
Using glycerol and propylene carbonate as model molecular liquids with and without strong hydrogen bonding, we have highlighted the crucial differences and the common features in their elastic properties under pressure in liquid and glassy states. Despite a significant (by factors of 2–2.5) difference between the elastic moduli of PC and glycerol, evidencing the hydrogen bond contribution in the latter case, both substances show quite similar pressure dependences of the elasticity, which are nonlinear in glassy states and are almost linear in liquids. Moreover, hydrogen bonds insignificantly influence the pressure derivatives of the bulk moduli of the liquids under pressure, which implies that glycerol and PC have quite similar functional forms of the effective pair potential. For glycerol, this provides the key result that the exponent γ in the scaling parameter 1/(TVγ), which governs the volume–temperature scaling of the relaxation properties and is equal to 1.4–1.8,12,39 does not correspond to the exponent in the repulsive intermolecular potential in contrast to PC.11,12,14 The decrease in Poisson's ratio toward 0.25 in glycerol comparing to PC seems to be another manifestation of the role of a strong hydrogen bond in glass formers. In this work, we also observed some secondary effects, whose relation to hydrogen bonding demands further theoretical and experimental evidences.Acknowledgements
We are grateful to M. V. Kondrin and A. A. Pronin for useful discussions. This work was supported by the Russian Science Foundation (project no. 14-22-00093).References
- F. A. Momany, R. F. McGuire, A. W. Burgess and H. A. Scheraga, J. Phys. Chem., 1975, 79, 2361–2381 CrossRef CAS.
- S. J. Weiner, P. A. Kollman, D. T. Nguyen and D. A. Case, J. Comput. Chem., 1986, 7, 230–252 CrossRef CAS.
- C. S. Ewig, T. S. Thacher and A. T. Hagler, J. Phys. Chem. B, 1999, 103, 6998–7014 CrossRef CAS.
- A. T. Hagler, S. Lifson and P. Dauber, J. Am. Chem. Soc., 1979, 101, 5122–5130 CrossRef CAS.
- K. T. No, O. Y. Kwon, S. Y. Kim, M. S. Jhon and H. A. Scheraga, J. Phys. Chem., 1995, 99, 3478–3486 CrossRef CAS.
- S. Scheiner, Hydrogen Bonding: A Theoretical Perspective, Oxford University Press, New York, 1997 Search PubMed.
- G. Gilli and P. Gilli, The Nature of the Hydrogen Bond, Oxford University Press, New York, 2009 Search PubMed.
- M. H. Cohen and D. Turnbull, J. Chem. Phys., 1959, 31, 1164–1169 CrossRef CAS.
- D. Ben-Amotz and D. R. Herschbach, J. Phys. Chem., 1990, 94, 1038–1047 CrossRef CAS.
- R. Casalini and C. M. Roland, Phys. Rev. E: Stat., Nonlinear, Soft Matter Phys., 2004, 69, 062501 CrossRef CAS PubMed.
- S. Pawlus, R. Casalini, C. M. Roland, M. Paluch, S. J. Rzoska and J. Ziolo, Phys. Rev. E: Stat., Nonlinear, Soft Matter Phys., 2004, 70, 061501 CrossRef CAS PubMed.
- A. Reiser, G. Kasper and S. Hunklinger, Phys. Rev. B: Condens. Matter Mater. Phys., 2005, 72, 094204 CrossRef.
- K. Z. Win and N. Menon, Phys. Rev. E: Stat., Nonlinear, Soft Matter Phys., 2006, 73, 040501 CrossRef PubMed.
- R. Casalini and S. Bair, J. Chem. Phys., 2008, 128, 084511 CrossRef CAS PubMed.
- T. H. Berlin and E. W. Montroll, J. Chem. Phys., 1952, 20, 75–84 CrossRef CAS.
- W. G. Hoover and M. Rossj, Contemp. Phys., 1971, 12, 339–356 CrossRef CAS.
- F. D. Stacey, B. J. Brennan and R. D. Irvine, Surv. Geophys., 1981, 4, 189–232 CrossRef.
- T. Steiner, Angew. Chem., Int. Ed., 2002, 41, 48–76 CrossRef CAS.
- Hydrogen Bonding—New Insights, ed. S. J. Grabowski, Springer, Netherlands, Dordrecht, 2006 Search PubMed.
- T. A. Litovitz and T. Lyon, J. Acoust. Soc. Am., 1958, 30, 856–859 CrossRef.
- C. A. Angell, L. Boehm, M. Oguni and D. L. Smith, J. Mol. Liq., 1993, 56, 275–286 CrossRef CAS.
- U. Schneider, P. Lunkenheimer, R. Brand and A. Loidl, Phys. Rev. E: Stat. Phys., Plasmas, Fluids, Relat. Interdiscip. Top., 1999, 59, 6924–6936 CrossRef CAS.
- P. Lunkenheimer and A. Loidl, Chem. Phys., 2002, 284, 205–219 CrossRef CAS.
- I. V. Blazhnov, N. P. Malomuzh and S. V. Lishchuk, J. Chem. Phys., 2004, 121, 6435–6441 CrossRef CAS PubMed.
- M. S. Elsaesser, I. Kohl, E. Mayer and T. Loerting, J. Phys. Chem. B, 2007, 111, 8038–8044 CrossRef CAS PubMed.
- G. P. Johari and E. Whalley, Faraday Symp. Chem. Soc., 1972, 6, 23–41 RSC.
- A. Kudlik, S. Benkhof, T. Blochowicz, C. Tschirwitz and E. Rossler, J. Mol. Struct., 1999, 479, 201–218 CrossRef CAS.
- U. Schneider, R. Brand, P. Lunkenheimer and A. Loidl, Phys. Rev. Lett., 2000, 84, 5560–5563 CrossRef CAS PubMed.
- C. M. Roland, S. Hensel-Bielowka, M. Paluch and R. Casalini, Rep. Prog. Phys., 2005, 68, 1405–1478 CrossRef CAS.
- H. van Koningsveld, Recl. Trav. Chim. Pays-Bas, 1968, 87, 243–254 CrossRef CAS.
- F. J. Bermejo, A. Criado, A. de Andres, E. Enciso and H. Schober, Phys. Rev. B: Condens. Matter Mater. Phys., 1996, 53, 5259–5267 CrossRef CAS.
- J. A. Padró, L. Saiz and E. Guàrdia, J. Mol. Struct., 1997, 416, 243–248 CrossRef.
- T. Steiner and G. R. Desiraju, Chem. Commun., 1998, 891–892, 10.1039/A708099I.
- Y. H. Jeong, S. R. Nagel and S. Bhattacharya, Phys. Rev. A, 1986, 34, 602–608 CrossRef CAS.
- M. Elmroth, L. Börjesson and L. M. Torell, Phys. Rev. Lett., 1992, 68, 79–82 CrossRef CAS PubMed.
- M. V. Kondrin, E. L. Gromnitskaya, A. A. Pronin, A. G. Lyapin, V. V. Brazhkin and A. A. Volkov, J. Chem. Phys., 2012, 137, 084502 CrossRef CAS PubMed.
- W. M. Slie and W. M. Madigosky, J. Chem. Phys., 1968, 48, 2810–2817 CrossRef CAS.
- H. Khelladi, F. Plantier, J. L. Daridon and H. Djelouah, Ultrasonics, 2009, 49, 668–675 CrossRef CAS PubMed.
- C. Dreyfus, A. Le Grand, J. Gapinski, W. Steffen and A. Patkowski, Eur. Phys. J. B, 2004, 42, 309–319 CrossRef CAS.
- A. A. Pronin, M. V. Kondrin, A. G. Lyapin, V. V. Brazhkin, A. A. Volkov, P. Lunkenheimer and A. Loidl, JETP Lett., 2010, 92, 479–483 CrossRef CAS.
- A. A. Pronin, M. V. Kondrin, A. G. Lyapin, V. V. Brazhkin, A. A. Volkov, P. Lunkenheimer and A. Loidl, Phys. Rev. E: Stat., Nonlinear, Soft Matter Phys., 2010, 81, 041503 CrossRef CAS PubMed.
- I. V. Danilov, E. L. Gromnitskaya and V. V. Brazhkin, J. Phys. Chem. B, 2016, 120, 7593–7597 CrossRef CAS PubMed.
- O. V. Stal'gorova, E. L. Gromnitskaya, D. R. Dmitriev and F. F. Voronov, Instrum. Exp. Tech., 1996, 39, 880–884 Search PubMed.
- R. Piccirelli and T. A. Litovitz, J. Acoust. Soc. Am., 1957, 29, 1009–1020 CrossRef.
- A. B. Koc and M. Vatandas, Food Res. Int., 2006, 39, 1076–1083 CrossRef.
- A. K. Soper and M. G. Phillips, Chem. Phys., 1986, 107, 47–60 CrossRef CAS.
- A. Rastogi, A. K. Ghosh and S. J. Suresh, in Thermodynamics – Physical Chemistry of Aqueous Systems, ed. J. C. Moreno-Piraján, InTech, Rijeka, 2011, ch. 13, pp. 351–364, DOI:10.5772/21074.
- NIST ChemistryWebBook/Thermophysical Properties of Fluid Systems, http://webbook.nist.gov/chemistry/fluid/.
- W. Wagner and A. Pruss, J. Phys. Chem. Ref. Data, 2002, 31, 387–535 CrossRef CAS.
- E. L. Gromnitskaya, O. V. Stal'gorova, O. F. Yagafarov, V. V. Brazhkin, A. G. Lyapin and S. V. Popova, JETP Lett., 2004, 80, 597–601 CrossRef CAS.
- M. A. Ramos, Philos. Mag., 2004, 84, 1313–1321 CrossRef CAS.
- T. Steiner and W. Saenger, Acta Crystallogr., Sect. B: Struct. Sci., 1992, 48, 819–827 CrossRef.
- G. R. Desiraju and T. Steiner, The Weak Hydrogen Bond: In Structural Chemistry and Biology, Oxford University Press, New York, d 2001 Search PubMed.
Footnote |
| † Electronic supplementary information (ESI) available. See DOI: 10.1039/c7ra06165j |
| This journal is © The Royal Society of Chemistry 2017 |

